Opinion: Money talks, and money flows are saying 'don't trust this rally yet'

- Investors aren't as eager to put money into stocks as they were in the past -
By Simon Maierhofer, MarketWatch
The first half of February was packed with excitement. One of the swiftest corrections in stock market history was followed by a spirited snap-back rally.
Since then, however, stocks have settled into a trading range (up-down-up-down, with no net progress). Will that range break to the upside or downside?
Let's analyze money flow (liquidity) to find out.
Follow the money
The number of stocks advancing and declining on the New York Stock Exchange (NYC advance/decline line) has been the most accurate forward-looking liquidity indicator throughout this bull market.
There are different ways to slice and dice the NYC a/d data. The method below gave a "buy" signal in March 2016 and was published in the Profit Radar Report at the time:
"Although the S&P 500 is still 3.16% below its Nov. 3, 2015, intraday high at 2,116.48 (and 4% below its all-time high), the NY Composite a/d line already surpassed its Nov. 3, 2015, high. While the S&P retraced only 78.6% of its prior losses, the NY Composite a/d line already retraced 117.83%. This data suggests that the rally from the Feb. 11, 2016, low is stronger than the rallies from the September 2015 and October 2014 lows."
The method
On Feb. 26, 2018, when the S&P 500 closed at 2,781, it recovered about 75% (close to Fibonacci 78.6%) of its mini-crash losses (see chart).
This setup is similar to March 2016 (and other ones shown below).
The Dow Jones Industrial Average and Russell 2000 recovered a similar percentage, and the Nasdaq-100 recovered more than 96%.
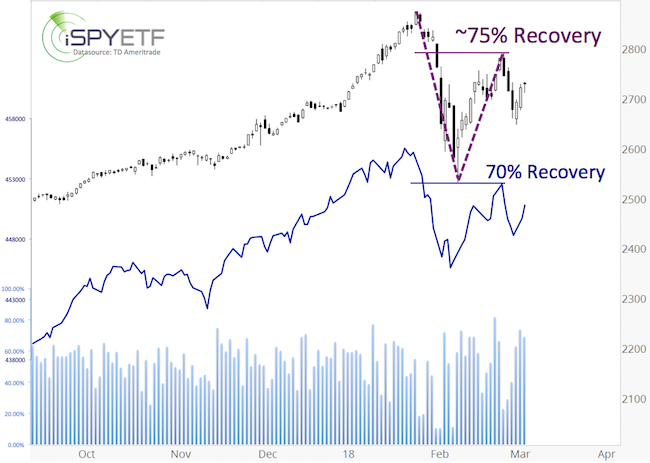
How the NYC a/d line did when the S&P 500 recovered about 75% of its prior losses has been telling throughout this bull market. How so?
If the NYC a/d line was stronger than the S&P 500, there was underlying strength, which led to strong performance in the future.
NYC a/d line weakness often meant there was not enough escape velocity to sustain a prolonged up move.
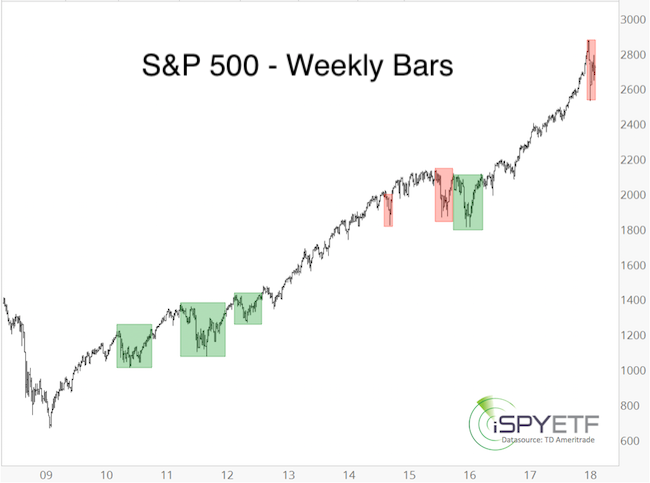
The chart below highlights when the NYC a/d line outperformed (green box) or under-performed (red box) the S&P 500.
The money isn't following
This time around, the NY Composite advance/decline line gained only 70% by the time the S&P 500 was up 75%.
In short, investors are not as eager to put money into stocks as they were in the past. This doesn't mean stocks can't reach new highs, but it's less likely than in the past.
S&P 500 outlook
After the initial February drop and pop, I warned via the Profit Radar Report that:
"The temptation is to think two-dimensional - up or down - since that's what we've experienced lately. However, stocks can also go sideways for a period of time.
"Based on Elliott Wave theory, wave 3 is followed by wave 4, which is where we are currently at. Waves 4 are generally choppy, range-bound, long-winded, unpredictable corrections that retrace ideally 38.2% of the preceding wave 3. The 38.2% Fibonacci retracement level is at 2,536 (reached on Friday).
"In terms of price, wave 4 has already reached its downside target. In terms of time, wave 4 would be unusually short."
In addition to a lengthy and choppy wave 4 correction, there is one other (more bullish) possibility. Both scenarios, along with forward projections and odds are discussed here: S&P 500 update.
Simon Maierhofer is the founder of iSPYETF and publisher of the Profit Radar Report. He has appeared on CNBC and FOX News, and has been published in the Wall Street Journal, Barron's, Forbes, Investors Business Daily and USA Today.
From MarketWatch