Opinion: How to play the volatile highs and lows of the VIX
- Use this unique strategy to invest according to the stock market's 'fear gauge' -
Think you know the significance of high and low VIX readings, and how best to respond?
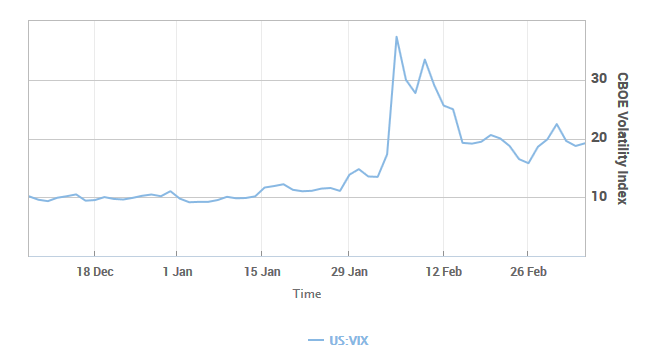
Chances are you're wrong. For example, many financial advisers recommend that clients grin and bear it when the CBOE Volatility Index (VIX) spikes, as it did in late January and early February as the market experienced its first 10+% correction in years. Such volatility is the price we must pay to participate in the stock market, they say.
Still others consider the VIX to be a good contrarian indicator. Following the CBOE's lead in considering the VIX to be a "fear index," these advisers recommend that their clients actually increase their equity exposure when the VIX spikes and reduce it when it recedes.
To be sure, both of these perspectives, while flawed, contain a kernel of truth. But sorting out fact from fiction is essential.
For starters, we need to understand what the VIX measures. It reflects option traders' collective expectation about the S&P 500's volatility over the subsequent 30 days. Needless to say, since volatility can be on both the upside and the downside, it's not precisely accurate to call it a fear gauge. A better analogy would be to a road sign alerting us to a bumpy road ahead.
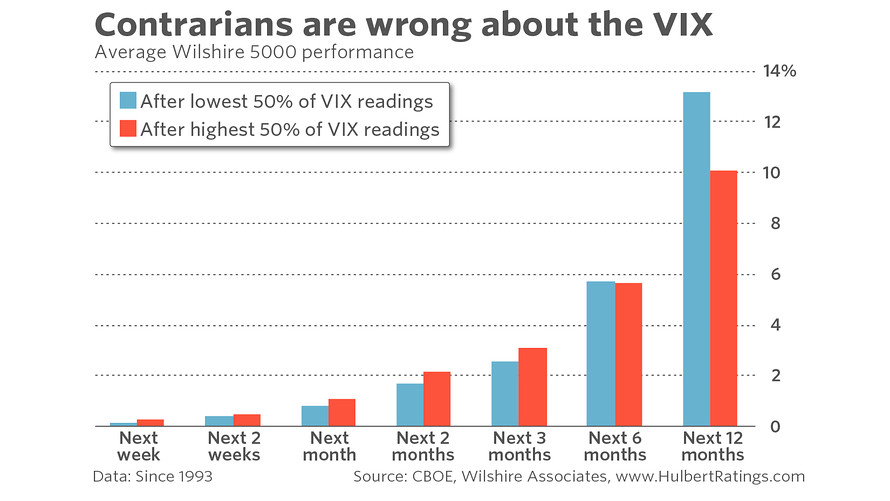
Conventional wisdom is also wrong in asserting that the stock market performs better following higher VIX readings. That is incorrect, according to a study conducted by Tyler Muir and Alan Moreira, finance professors at UCLA and the University of Rochester, respectively. They found that the stock market's average return following high VIX readings is not statistically different than it is following low readings.
Muir, in an interview, said that analysts often miss this point because they focus only on the strong stock market performances that undeniably have occurred when the VIX is particularly high. But, he said, it's also true that some of the lowest stock market returns have come subsequent to high VIX readings. Upon averaging both the good and the bad together, the market's return in the wake of high VIX readings is unexceptional.
Don't believe it? Take a look at the accompanying chart, which compares the stock market returns following below-median and above-median VIX levels. None of the differences in the accompanying chart is significant at the 95% confidence level that statisticians often use when determining whether a pattern is genuine.
This finding, coupled with another well-known volatility-related pattern, creates the possibility of a profitable trading strategy, according to Moreira and Muir. This additional pattern is that periods of high volatility tend to be clustered together - an insight that traces to research conducted by Robert Engle III, a finance professor at New York University who received the Nobel Prize in economics in 2003 for his work along these lines. To the extent the future is like the past, therefore, an investor will forfeit little of any return by doubling up on stocks when the VIX is low and reducing exposure whenever the VIX spikes upwards.
Muir suggests we imagine a hypothetical investor who is always 50% invested in equities. If that investor instead was 100% invested when the VIX is lowest and 0% invested when the VIX is highest, he should make just as much money over time while nevertheless incurring a lot less risk. Alternately, by being even more heavily exposed when volatility is low, an investor could make just as much money as the constant 50% investor while incurring no more risk.
The specific details of the strategy devised by Moreira and Muir are beyond the scope of this column, and interested readers are encouraged to consult their study. But, as a general rule of thumb, Muir said, investors should at the end of each month scale equity exposure up or down inversely to volatility's increase or decrease over the previous month. If the market's volatility doubles, for example, cut your exposure in half.
Take what that means for today's market. Since the VIX rose 23% in January, a follower of this strategy would have reduced his equity exposure at the end of January to be 19% less than it was at the end of December (1 divided by 1.23). The VIX rose another 47% in February, which means that a follower on Feb. 28 would have reduced his equity exposure by an additional 32% (1 divided by 1.47).
Notice carefully that just the reverse scaling algorithm applies when the VIX starts coming back down. That's key because many who would otherwise be willing to follow this strategy balk at having to increase their exposure when the VIX declines. If you also are likely to be reluctant in this regard, then Moreira says you shouldn't even bother with scaling your equity exposure up or down according to volatility.
Even if that's the case, it's still worth knowing that conventional wisdom is wrong about what high- and low VIX readings really mean.
For more information, including descriptions of the Hulbert Sentiment Indices, go to The Hulbert Financial Digest or email [email protected].
From MarketWatch