If you think traders have rewarded the market for good news every time good news has been circulated - but hasn't punished the market for bad news - you're not crazy. That's exactly what's happened. The end result is a market that's gone up and up and up without ever stumbling, in turn resulting in a situation not seen since early 2018. The indices survived a small stumble then, but never really regained a firm footing until after the big setback that would take shape later that year.
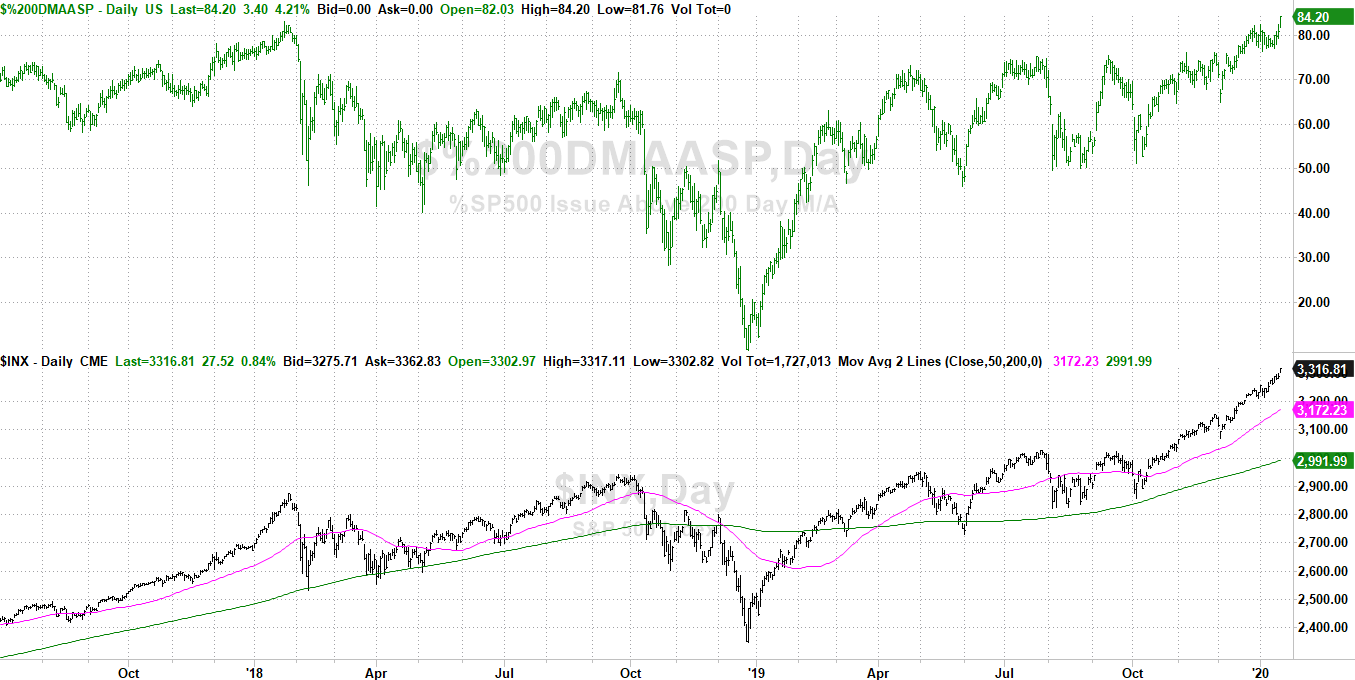
The "extreme" in question is the distance between the S&P 500 and its 200-day moving average line, which is considered the grandmother of all the moving average lines used by technical analysts. As of Thursday, the index is 10.8% above it. At its peak in January of 2018, the index was 13.8% above the 200-day line. That theoretically leaves room for more divergence, though on an absolute (point) basis, the lower value of the S&P 500 then would imply there's not a full 3.0% window for more upside... just a little more.
But, that's not the only extreme we're eyeing right now. As of Thursday, 84.2% of the S&P 500's constituents were above their 200-day line. That's just a hair more than the peak level we saw above their 200-day moving average lines in January of 2018. That's what's indicated on the upper portion of the chart below, with the S&P 500 and its 50-day and 200-day moving average lines (pink and green, respectively) on the lower half.
And yet, that's still not the only unusual extreme to be witnessed here and now. Also as of this week, the marketwide put/call ratio trend is lower than it's been in years.
Put and call options are one-sided bets... bullish or bearish stances that are highly speculative. They're the right to buy or sell a stock (or an index, or an index's value), but not necessarily the obligation to do so. When traders are buying a lot of calls, they're very bullish... collectively speaking. When traders are buying a lot of puts, they're collectively bearish. When they're buying a lot more calls compared to the number of puts they're buying - the put/call ratio - yes, they're overwhelmingly bullish.
Care to guess what the put/call ratio looks like right now? Its 15-day moving average line, which captures the bigger trend, is at 0.679. That's lower than the put/call trend has been since the beginning of 2014.
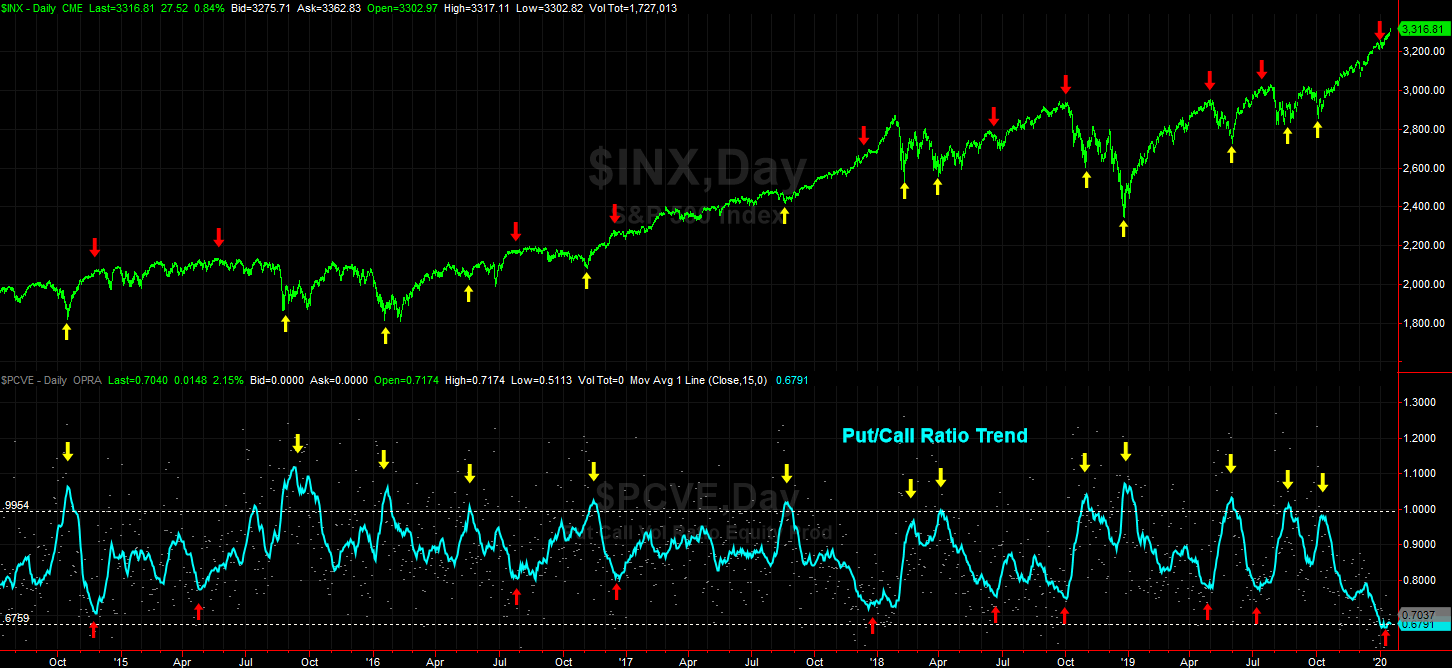
Superficially, that would seem bullish... and in some cases it might be. More often than not though, a put/call ratio at an extreme indicates that traders' presumptions have reached unsustainable levels. A reversal is nigh, shocking unsuspecting investors.
And, as the graphic shows, that works both ways. When the put/call figure is oddly high, the market tends to be close to a bottom. The extreme pessimism is unmerited. Our current concern is the opposite though. Right now, the oddly low put/call ratio says investors are oddly sure that the market won't go down from here, but will only go higher.
It's possible they're right. It's possible the put/call ratio reflects a level of optimism that's so great that traders have no intent of ever letting stock's slide downward... a self-fulfilling prophecy rooted in an uncanny amount of certainty that supersedes reason and common sense.
Still, where does it end? Nothing lasts forever. Even if the situation is a healthy one, the market inherently ebbs and flows. This looks, feels, and smells like a setup for a pullback... or a rally that's even more unusual than the other unusual extremes discussed above.