Weekly Market Outlook - Yes, No, and Maybe... But Mostly Yes

Stocks managed to log a second winning week, but it was a less than impressive one. The S&P 500 gained a modest 1.4% last week, bouncing back a bit on Friday from the intraweek pullback from Wednesday's high.
More important though, the index found technical support when and where the bulls needed it... at least for the S&P 500. The NASDAQ didn't need the help, and the Dow Jones Industrial Average -- which did need the help -- didn't get it. The blue chip-laden index is now sitting below all of its key moving averages line, and seemingly struggling to get over the hump.
The mixed messages these indexes are delivering leaves traders on the fence. Or, at least it should until there's a little more clarity as to the market's true direction here.
We'll dissect all three messages in a moment. Let's first run through last week's biggest economic news and preview what's coming this week.
Economic Data Analysis
Last week's big announcement of course was the Federal Reserve's decision to put another quarter-point rate hike in place... the ninth one in a row. But, this may very well be the next to the last one. The Fed says it's seeing inflation being tempered enough to dial back its current hawkishness, and even has loose plans to lower rates next year and 2025 (maybe).
Investors don't seem entirely convinced, but they don't seem unconvinced either. They're at least entertaining the possibility that relief is in sight.
The only other noteworthy reports from last week were last month's home sales data. Sales of existing homes improved from an annualized 4.0 million to a pace of 4.58 million in February, while new home sales edged slightly however, from a yearly clip of 633,000 to 640,000.
New, Existing Home Sales Charts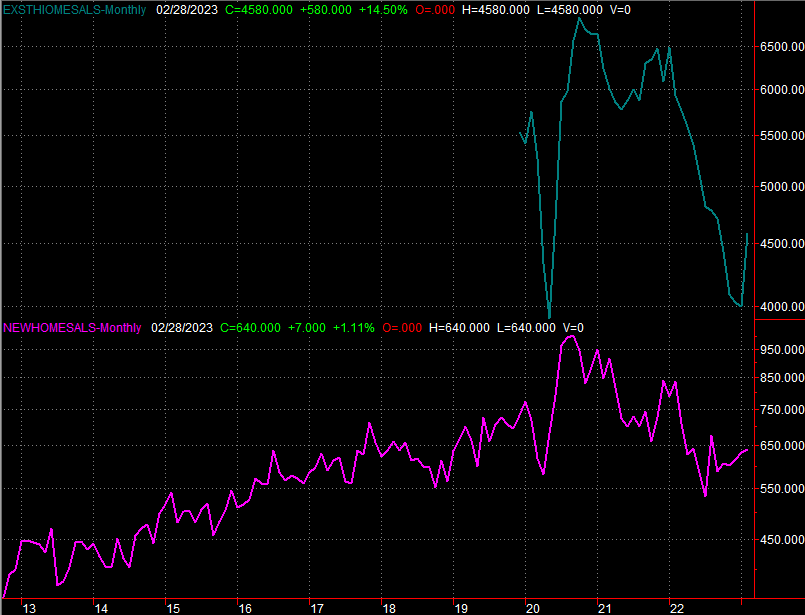
Source: National Board of Realtors, Census Bureau, TradeStation
While both sets of data are still nearer last year's major lows than not, there is some solace in seeing sales on the mend... even if it's being induced by last-minute buyers trying to capitalize on short-term stumbles in interest rates.
Everything else is on the grid.
Economic Calendar
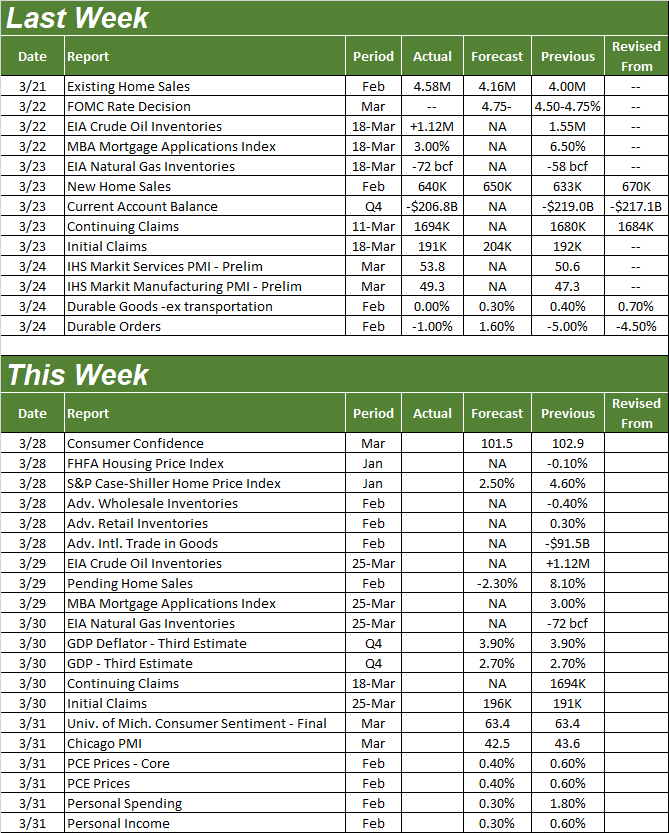
Source: Briefing.com
This week will round out the updated look at the entire real estate market. Look for the FHFS Housing Price Index as well as the S&P Case-Shiller Home Price Index on Tuesday. The data will be for January rather than February. But, it's still going to point to a bigger trend, which has been moving in the wrong direction for a few months now.
Home Price Charts

Source: Standard & Poor's, FHFA, TradeStation
We'll also hear a big dose of consumer sentiment data. On Tuesday look for the Conference Board's consumer confidence report for March, while the University of Michigan's third and final measure of consumer sentiment for this month will be dropped on Friday.
Consumer Sentiment Charts
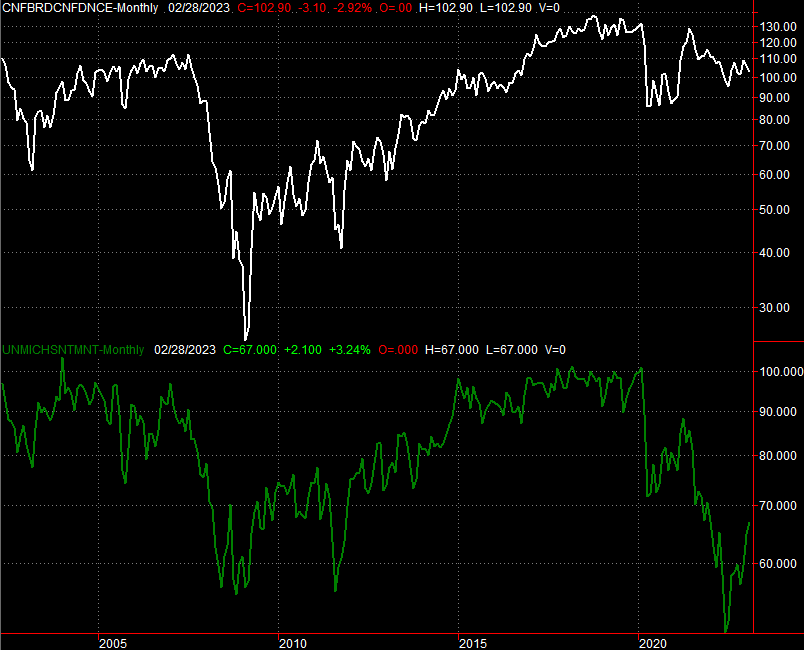
Source: Conference Board, University of Michigan, TradeStation
The two data sets have been moving on opposite direction for the past few months, but mostly they're both moving toward their respective middle grounds.
Stock Market Index Analysis
We'll start this week out with the bad news and work our way forward to the good. The bad news is, the Dow Jones Industrial Average failed to get and stay back above the 200-day moving average line (green) last week. It did move above it briefly for a couple of days, but after bumping into the 20-day moving average line (blue) at 32,450, the blue chip index fell back under all of its key technical ceilings. It's also possible there's still some horizontal resistance -- previously support -- to deal with around 32,585.
Dow Jones Industrial Average Daily Chart
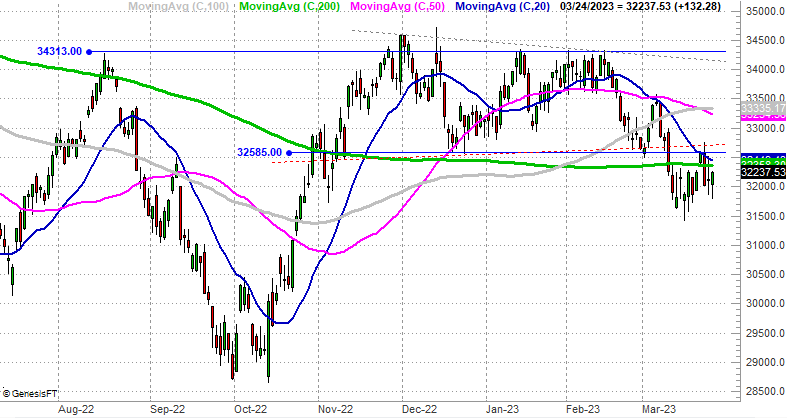
Source: TradeNavigator
The S&P 500 is faring better, but isn't exactly in bullish mode. Take a look. The 50-day moving average line (purple) clearly turned into a technical ceiling last week. But, the 200-day moving average line (green) also held up as support. End result? The index is now trapped squarely between a floor and a ceiling, and could still easily move past either boundary.
S&P 500 Daily Chart, with VIX and Volume
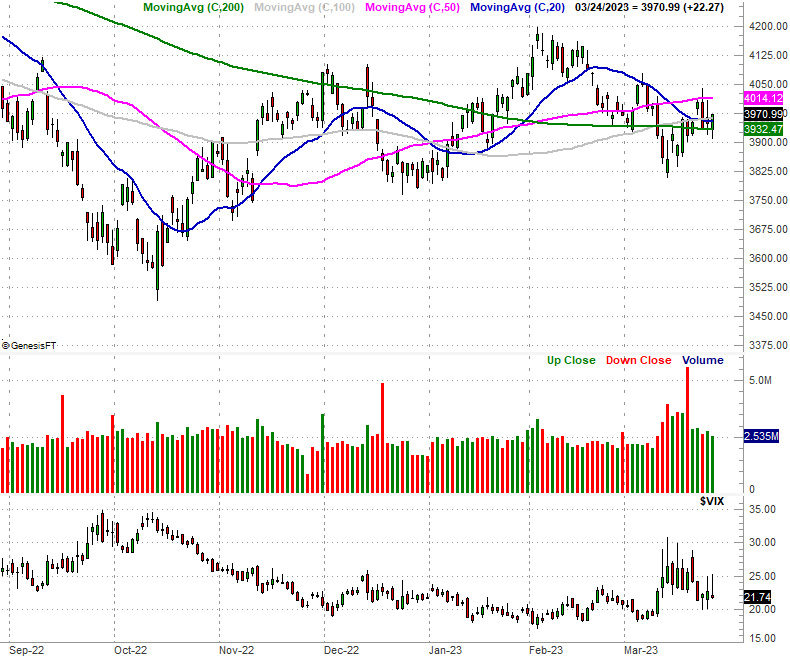
Source: TradeNavigator
Now take a step back and look at the weekly chart of the S&P 500. We can see something here that's not nearly as evident on the daily chart. That's the convergence of all the key moving average lines following last year's bearish divergence. From this vantage point we can see the re-convergence is still intact, leading into what should evolve into a new, full-blown bullish divergence of these moving averages.
S&P 500 Weekly Chart, with VIX and Volume

Source: TradeNavigator
The weekly chart also frames up the volatility index (VIX) within its own support and resistance lines. These are still in play, even if they didn't come into play last week.
Finally, the NASDAQ Composite... which is still doing just great even with the weak end to last week. It's got all the bullish clues an investor could want. Chief among them is -- you guessed it -- the moving average lines. All four of them are now pointed higher following several bullish crossovers of them just within the past couple of months. While choppy, the bigger-picture rally effort is still well underway.
NASDAQ Composite Daily Chart, with VXN
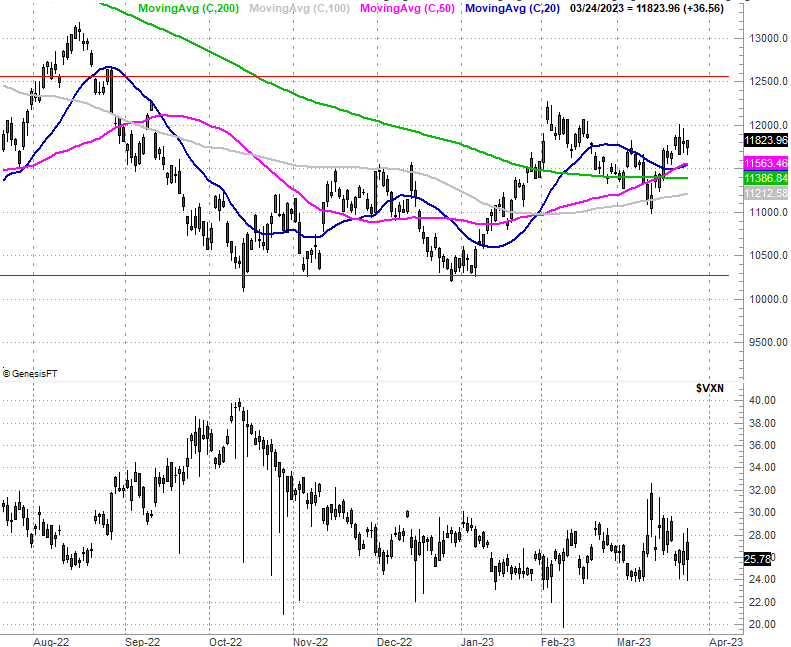
Source: TradeNavigator
Even so, the NASDAQ is stuck between its own floor and ceiling. As the weekly chart of the NASDAQ Composite reminds us, the index's Fibonacci retracement lines at 10,278 and 12,563 still have the NASDAQ trapped between the two milestone levels.... the former of which served as a firm floor a couple of times since October.
NASDAQ Composite Weekly Chart, with VXN
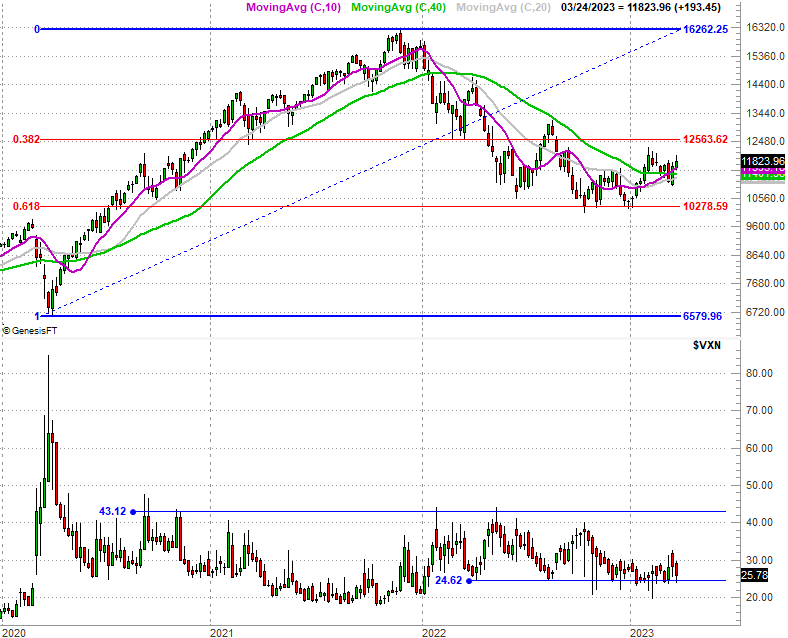
Source: TradeNavigator
It's not as outrageous as it may seem to be on the surface. When the broad market is in rebound mode, it tends to be led by the more aggressive growth stocks typically found in the NASDAQ Composite. Value stocks and bigger blue chips, in fact, tend to lag as investors favor growth over value, and may even be selling value blue chips to free up funding for aggressive growth picks.
This nuance actually bolsters the current bullish argument too, indicating that the average investor's mindset here really is bullish. It's a hint that the recovery effort that first took shape back in October has some staying power rooted in long-term optimism.
The key, of course, is continuing to find support at the moving average lines mentioned above.