Weekly Market Outlook - Worst Day For Stocks Since 2020 Caps Off 4th Straight Weekly Loss, and Yet...
In retrospect, traders were a little too ready to throw in the towel on Friday. While pessimistic comments from Federal Reserve officials can be expected to drive the market lower, Friday's response (in the context of the week's earlier) action feels like a little too much. Maybe investors were also planning to dump some of their holding before the weekend anyway, and the headlines spooked them a little more than they expected to be spooked. Whatever the case, it was rough.
And yet, there's still a plausible path out of trouble before stocks' selling turns unstoppable. It's a tough path to navigate to be sure, but it's there.
We'll look at exactly what happened and what didn't happen last week below. First though, let's review last week's biggest economic announcements and preview what's coming this week.
Economic Data Analysis
If there's a real estate headwind starting to blow because of rising interest rates, it's not yet evident in the nation's housing starts and building permits. Permits inched higher, from 1.86 million to a pace of 1.87 million, topping expectations in the process. And, starts scooted just a hair higher to a pace of 1.79 million, again topping analysts' estimates of 1.75 million.
Housing Starts and Building Permits Charts
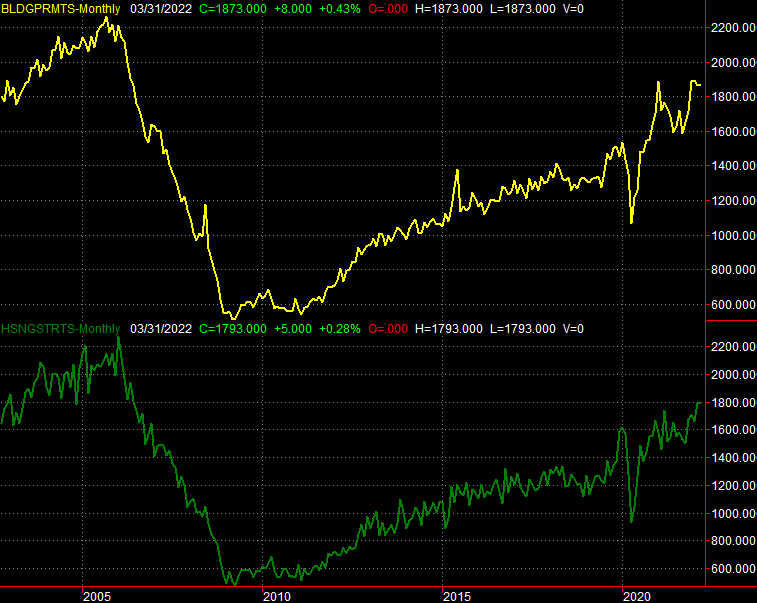
Source: Census Bureau, TradeStation
Neither data set is still rising, as both were just a few months ago. The bigger, longer-term trend is still bullish though, and activity remains relatively robust. Note that the NAHB Housing Market Index only fell slightly in April, and as the chart below shows, existing home sales in March didn't slide too much last month. On the other hand, sales fell dramatically in February, as did sales of new homes.
New, Existing Home Sales Charts

Source: Census Bureau, National Association of Realtors, TradeStation
It's possible housing starts and building permits are firmer than they need to be, setting up the prospect of too many unsold new homes. We certainly saw that in the throes of 2008's subprime mortgage meltdown. We'll just have to keep an eye out for the subtle clues of how the real estate market is changing here, starting with March's new home sales report due on Tuesday.
Everything else is on the grid.
Economic Calendar
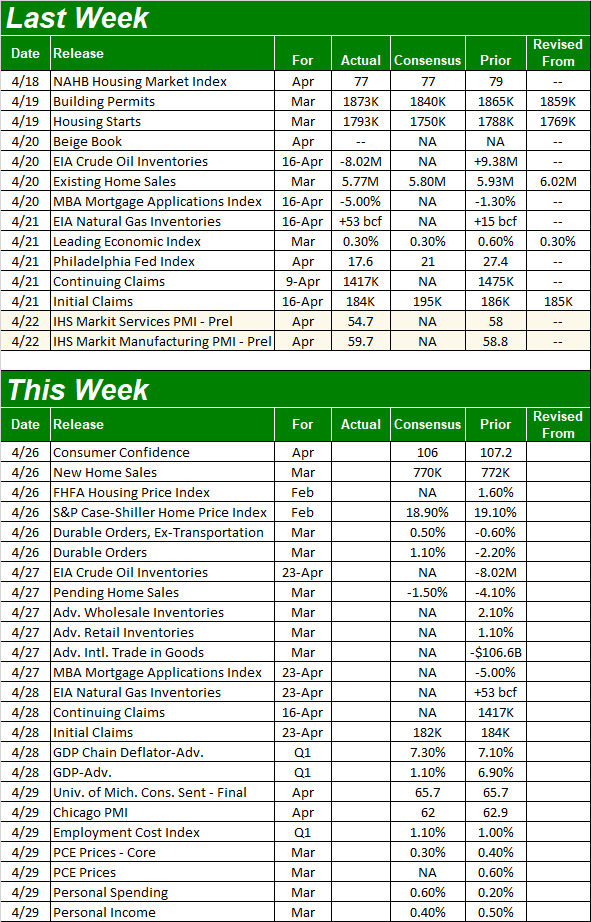
Source: Briefing.com
In addition to Tuesday's look at last month's new homes sales, we're also going to hear about real estate prices that very same day... the FHFA Housing Price Index, and the S&P Case-Shiller Home Price Index. Economists believe the price romp is still underway.
FHFA Housing Price, S&P Case-Shiller Home Price Charts
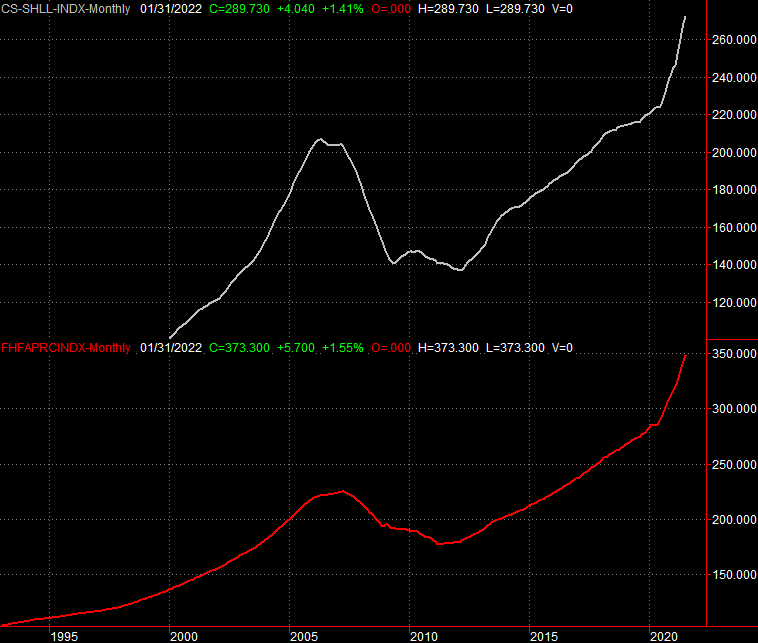
Source: Standard & Poor's, FHFA, TradeStation
Just note that Tuesday's home price reports are for February rather than March, and much has happened in the month in between. Also notice that these two reports only consider prices of sold homes, without considering the number of homes sold. Both are factors to consider.
The only other items of interest coming this week are Tuesday's consumer confidence score from the Conference Board, and the third and final look at April's University of Michigan Sentiment Index. Both have been sliding lower for several months now, and forecasters believe the Michigan number is apt to slightly rebound. The Conference Board's figure, however, is apt to keep falling. Either way, both data sets suggest consumers are worried enough that they could easily stop doing their part to keep the economy propped up... even if they haven't balked yet.
Consumer Sentiment Charts
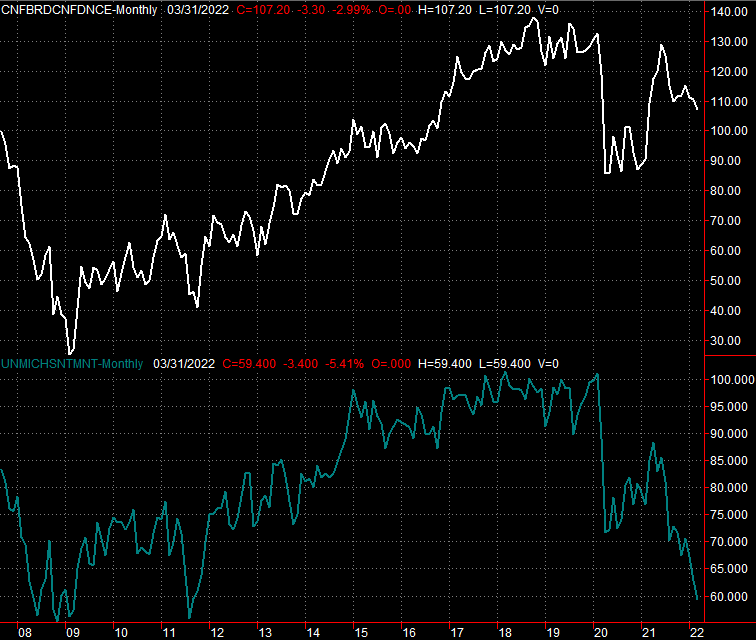
Source: Conference Board, University of Michigan, TradeStation
Stock Market Index Analysis
It's tricky. Was last week's rout going to happen no matter what? Or, was it concerning comments from Cleveland's Federal Reserve Bank President Loretta Mester that sparked the steep selloff, most of which materialized on Friday?
It was probably a little of both, though it matters little now. The damage is done.
And yet, the degree of damage traders should fear has not yet been done... and perhaps it won't be done at all.
Take a look at the daily chart of the NASDAQ Composite below. It was clear on Wednesday and Thursday that the index wasn't going to hurdle the 50-day moving average line (purple) anyway. Traders were likely to give up on the effort on Friday no matter what. Mester just gave them a big reason to do so. In the grand scheme of things, the action isn't that surprising.
NASDAQ Composite Daily Chart, with VXN
Source: TradeNavigator
Take a step back and look at the weekly chart of the NASDAQ Composite, however, and a couple of things become evident that aren't readily evident on the daily chart.
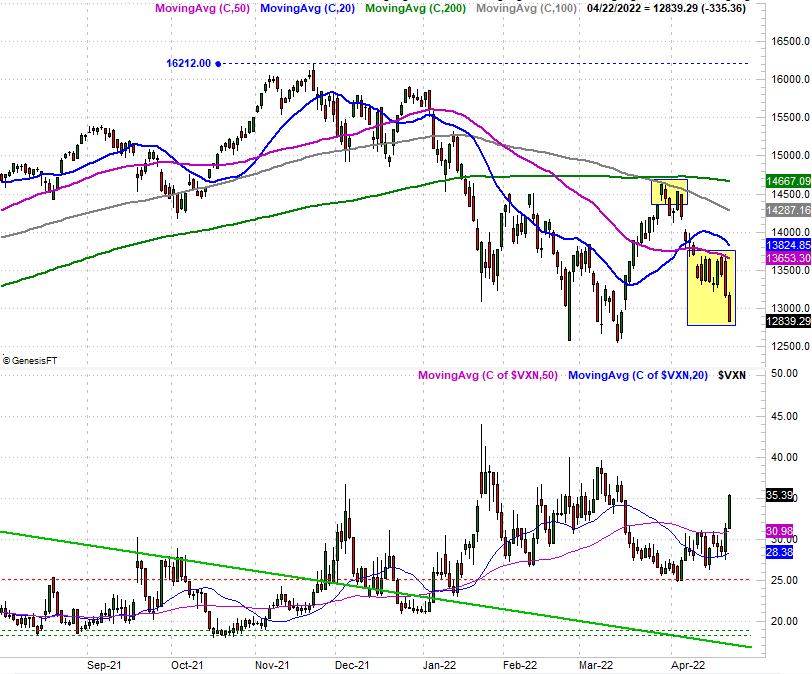
The first of these is, while last week was the worst week for the market in a long while, the selloff has yet to drag the index below a major technical support line at 12,533. As long as that floor is intact, there's a bastion of hope the market won't suffer any more major losses. In the other hand, should that support level finally snap, there's little else that will help keep stocks propped up.
NASDAQ Composite Weekly Chart, with VXN
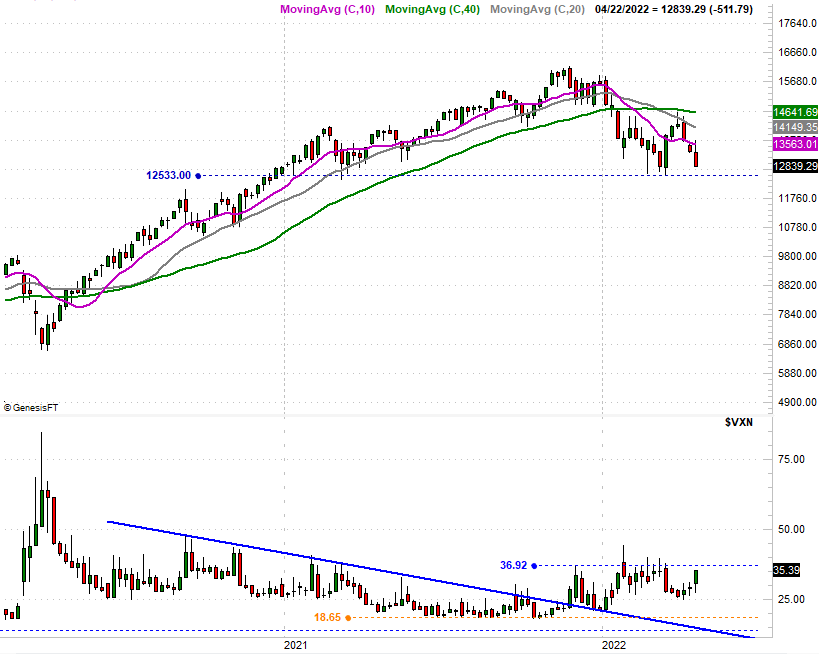
Source: TradeNavigator
The other noteworthy nuance of the NASDAQ's weekly chart is that its volatility index, or VXN, is finally moving... something we've not seen at any point prior to last week even though the market's been edging lower for that long. Traders are genuinely worried now in a way they weren't before, again, perhaps because of comments from the Fed's leaders.
Even so, the VXN has a ceiling that's a counterpart to the NASDAQ Composite's floor at 12,533. That's 37.0, which seems to have been a (loose) cap for the volatility index in February and March. It's worth pointing out that as rocky as things felt for stocks at that time, the market never really fell apart than.
In other words, both lines need to be decisively crossed before assuming the worst for stocks.
The same idea applies to the S&P 500, although with different particulars. Namely, the S&P 500 fought with the converged 20-day and 200-day (blue and green, respectively) moving average lines on Wednesday and Thursday before being up-ended in earnest on Friday. Similarly, the S&P 500's volatility index, or VIX, finally started to move higher in a big way.
S&P 500 Daily Chart, with VIX and Volume
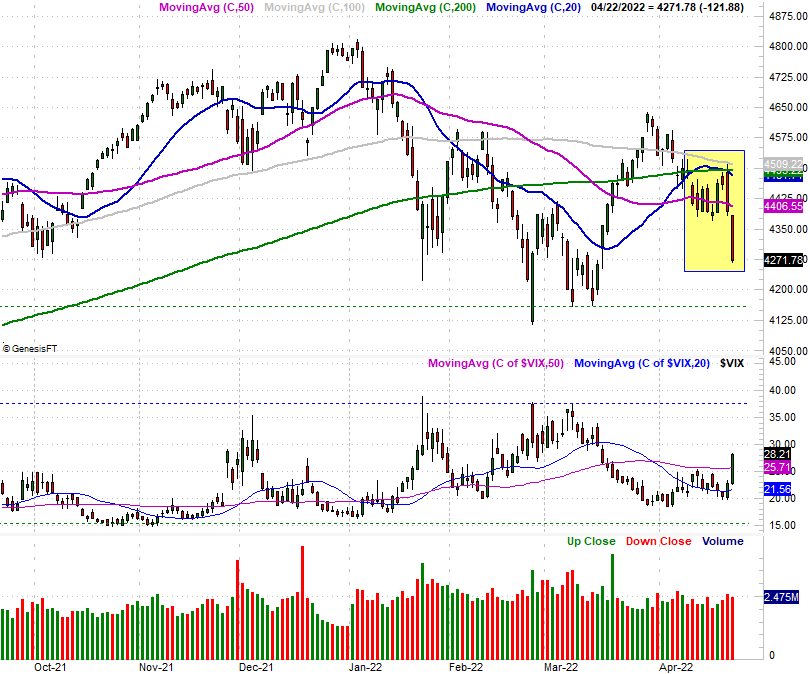
Source: TradeNavigator
Here's the weekly chart of the S&P 500. Same story. Last week was rough, but it's clear the index hasn't yet shattered its most important technical floor at 4150, where it bottomed in March. In the same vein, there's room for the VIX to keep rising before bumping into a key ceiling around 39.0.
S&P 500 Weekly Chart, with VIX and Volume
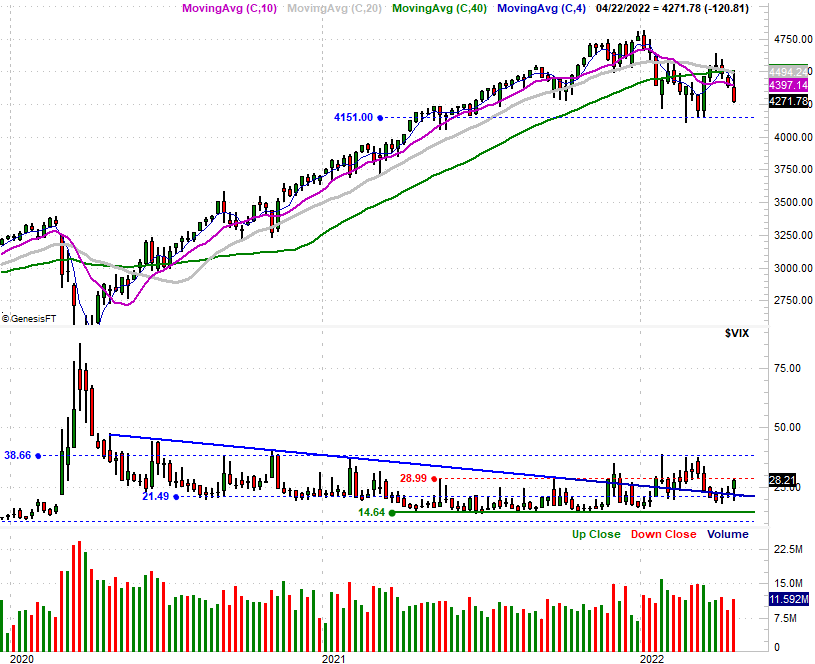
Source: TradeNavigator
It's also worth noting, however, that even though Friday was a rout, the volume was just average. This may or may not be the majority opinion.
The one good/bullish nuance about last week's selloff? It was so bad that it sets the stage for a sharp, reflexive bounce. Don't read too much into that if it happens though, until and unless the both indices manage to hurdle the aforementioned moving averages. That's a tall order too, given the fact that the trend in all the major timeframes is now officially bearish. How so? All four of the S&P 500's key moving averages are now sloped downward; the NASDAQ suffered that fate a week ago.