Weekly Market Outlook - Week Two of 2018 Was Just as Hot as Week One
With nothing specific to stop them, the bulls were more than willing to keep on chugging as we move deeper into the new year. When all was said and done, the S&P 500 gained 1.5% last week, and is now up 4% since the end of 2017.
 That's way, way ahead of the usual pace of gains we'd normally see during the first half of January, and odds are good we'll pay the piper sooner or later for the big move. On the flipside, given the momentum now in place, the profit-taking that's brewing up may not develop for a long, long while.
We'll explore the amazing year-to-date run below, after recapping last week's and previewing this week's economic news.
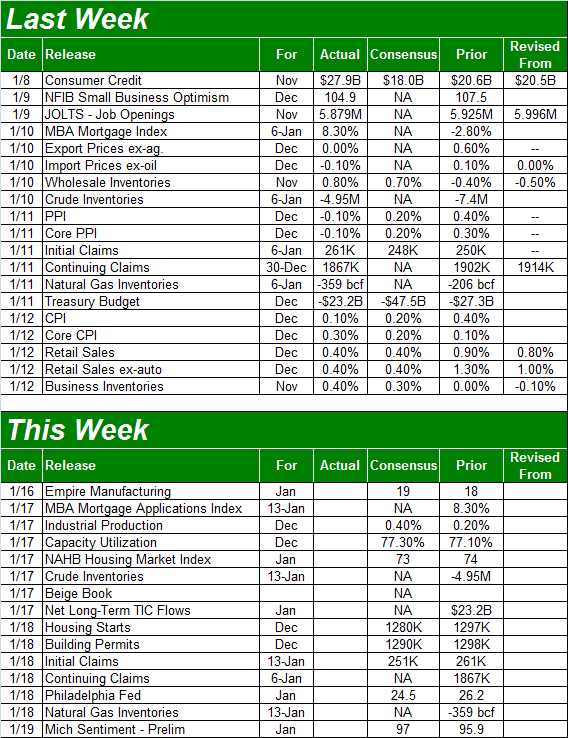
Economic Data
There wasn't a whole lot of stuff from last week to sift through, but a couple of the things we did hear are important.
The first of them was inflation. The prose were looking for a decent price increase for producers as well as consumers. Consumers got it, but producers didn't. The annualized producer price inflation rate now stands at 2.1%, and is a frothy 3.4% for producers. On a core basis (which is arguably a more meaningful measure), consumer inflation stands at 1.8%, and producers are dealing with an annualized inflation rate of 2.3%.
Consumer and Inflation Rate (Annualized) Charts
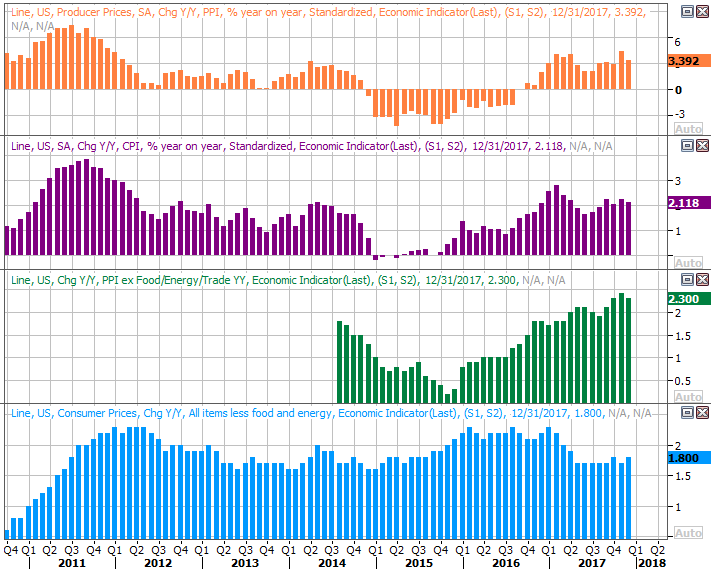
Source: Thomson Reuters Eikon
Inflationary pressure seems to be leveling off, but not so much that the Fed will have to peel back on its plans for three rate hikes this year.
Also of interest was last month's retail sales figures, posted on Friday. Economists were looking for a strong showing, and they got it. Spending was up 0.4% month-to-month, with or without automobile sales factored in. On a year-over-year basis, retail sales are up around 5.0% in most stratifications.
Retail Spending Growth (Annualized) Charts
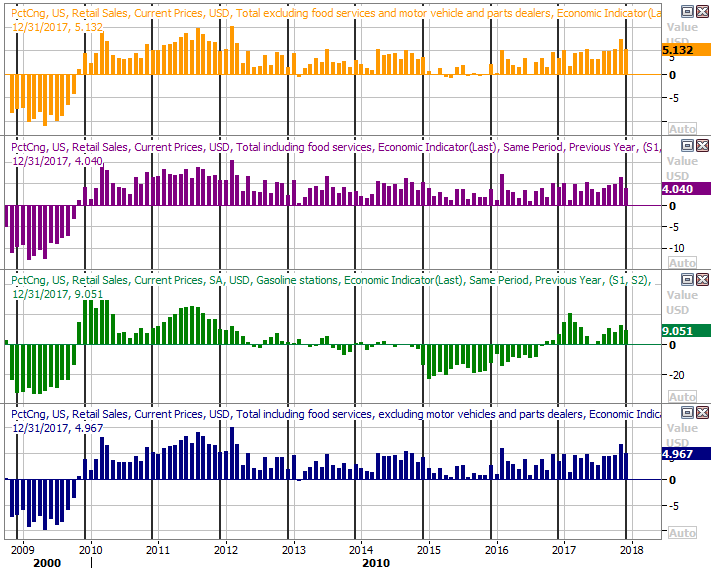
Source: Thomson Reuters Eikon
Also note that retail sales growth is not only strong, but still accelerating.
Everything else is on the grid.
Economic Calendar
Source: Briefing.com
This week will be about as busy, though once again only a couple of items are of real interest.
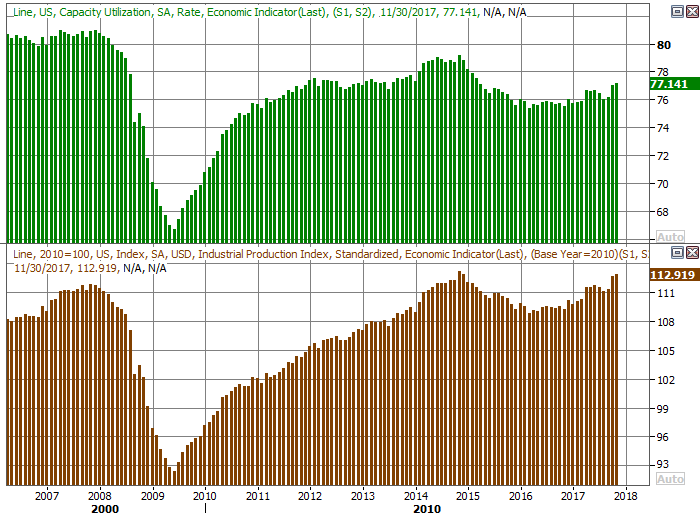
The first of them is Wednesday's look at last month's capacity utilization and industrial production. Both have been trending upward for a while (which is good), but both are expected to have soared last month.
Capacity Utilization and Industrial Productivity Charts
Source: Thomson Reuters Eikon
The importance of these numbers can't be stated emphatically enough. They coincide with corporate earnings, and the market. It's a long-term correlation that doesn't jibe with short-term swings, but it's a tremendous long-term tool for investors to use to make "buy on the dip" decisions... or decisions be in the market at all.
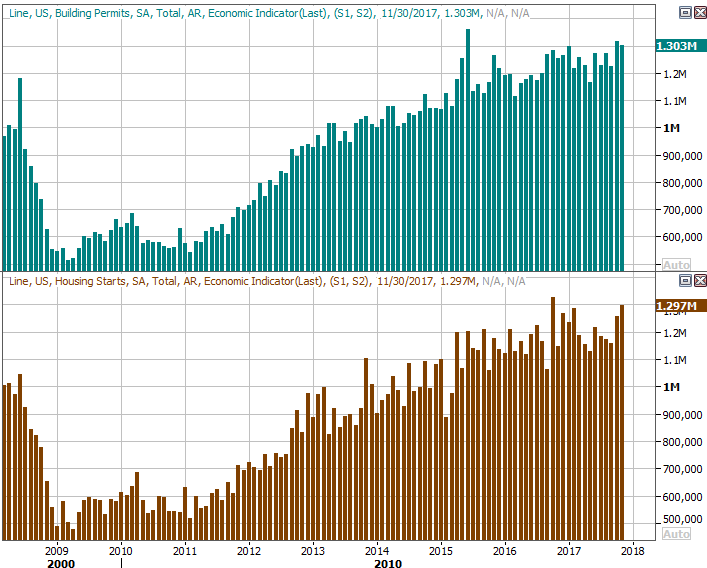
On Thursday we'll get last month's housing starts and building permits.
You may recall starts and permits were quite strong in October and November. Economists think we'll see a slight lull for last month, as weather kicks in and the post-hurricanes surge tapers off. Still, the bigger trend has been and continues essay writer to be one of strong growth. The construction market remains an opportunity.
Housing Starts and Building Permits Charts
Source: Thomson Reuters Eikon
Index Analysis
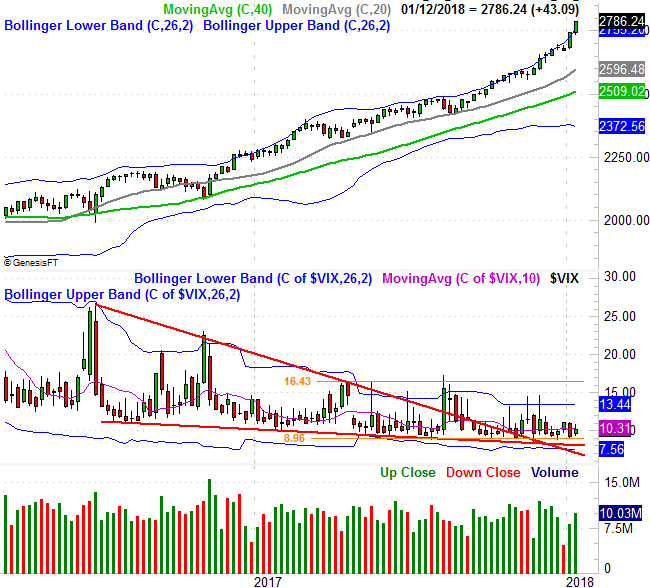
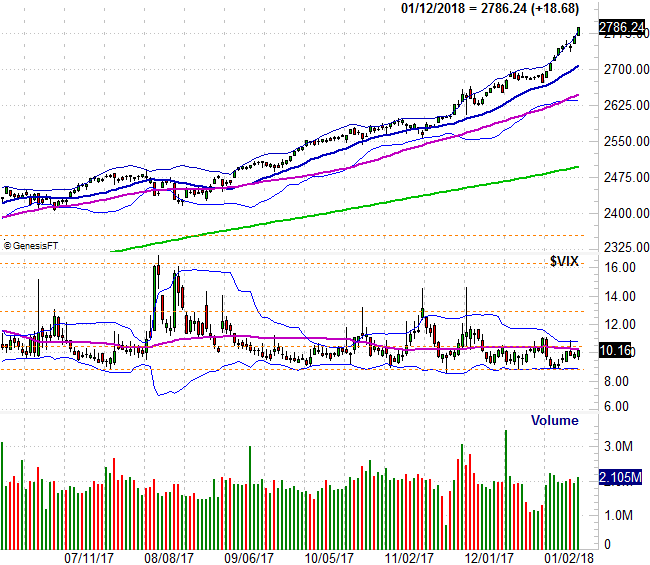
The rally isn't just still going strong. It's accelerating. The weekly chart of the S&P 500 below makes this quite clear.
S&P 500 Weekly Chart, with VIX and Volume
Source: TradeNavigator
This could have two outcomes. They are (and not to be coy or trite) more bullishness, or a selloff. In both cases though, the eventual end looks like there's some downside in the cards.
The bullishness is extreme to be sure, and the strong gains we've seen since the end of last year could heighten the fear or missing out on more upside, drawing in more buyers and creating the "meltup" you have heard discussed a few times of late. That would be a fun - and fortuitous - ride to be sure, though also a short-lived one that ended with a rather spectacular pullback that's too big to shrug off. In that scenario, we're looking for the usual signs of a top. In this case it would likely be a blowoff top, and clear when it materializes.
The other scenario assumes that in some ways, the past couple of weeks WAS the blowoff top... even if not a perfect one. The S&P 500 is now up 33% since early November of 2016, and up 15% since August of last year essay writing service. The profit-taking potential is already packed into things here. We're just waiting for the trigger.
Zooming into the daily chart of the index doesn't tell us anything else, though it does put the recent leg of the bigger-picture rally in perspective. The S&P 500 is now 11.5% above the 200-day moving average line, which is a far greater than the normal degree of maximum divergence.
S&P 500 Daily Chart, with VIX and Volume
Source: TradeNavigator
Unfortunately, conventional technical or fundamental analysis just doesn't apply here. This market action is being driven almost entirely by sentiment and rhetoric, which is fine, but it can stop and turn on a dime. We need to be ready for all possibilities, and as was suggested a week ago, we need to pay special attention to crosses below key moving average lines as signals of bigger breakdowns.
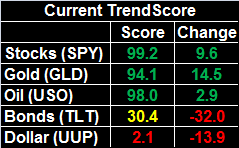
In the meantime, it's been a while since we've taken a holistic view of sector performance. With a couple of them suddenly falling back into or out of favor, it might be worth a refreshed look. Take particular note of the fact that energy stocks are soaring and utility stocks are falling apart. Technology stocks have found a new life too.
Sector Performance Comparison Chart
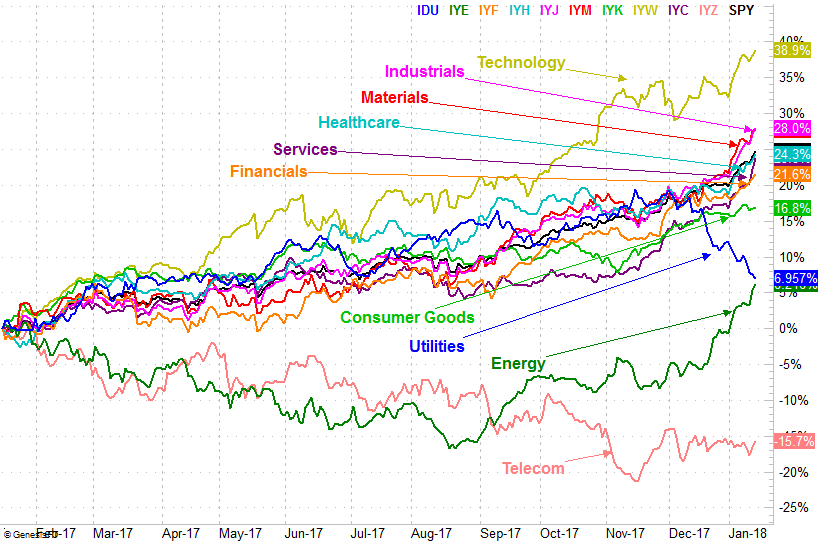
Source: TradeNavigator
As long as the market's gaining, tech will likely lead that charge. And, regardless of what the rest of the market does, odds are good utility stocks will struggle because they're being treated like bonds in an environment where rates are edging higher. The only one of the three mentioned trends we can't entirely trust is the breakout move from energy stocks. That's not to say the energy sector is facing a miserable 2018. It is to say, however, oil prices and energy stocks may have gotten a little ahead of themselves and are due for a dip before regrouping and starting the bigger uptrend again.