Weekly Market Outlook - Two Steps Forward and One Step Back, Right on Cue
 Nobody can honestly say they were surprised the market hit a wall and peeled back on Friday. There are a million things that could easily go wrong for the market here. And, while there are a million things that can still go right, most of them had already been priced in since late June. Stocks were ripe for a little profit-taking, so the would-be sellers were content to lock in their gains headed into the weekend.
It doesn't mean the broad market's in complete pullback mode. It could certainly turn into that. But, thus far, Friday's tumble isn't anything more than an anomaly.
We'll take a closer look at that idea below, after a rundown of last week's and this week's economic announcements. (Spoiler alert: There a ton of 'em to sift through. We'll keep it short and sweet.)
Economic Data
It's difficult to recollect in the midst of all the earnings noise, but we got a handful of noteworthy economic announcements last week that merit a closer look.
It was a particularly big week for home sales, though not a particularly encouraging one. We learned on Monday that sales of existing homes slipped a little, to a pace of 5.38 million. But, on Wednesday we heard last month's new-home sales pace fell from 666,000 to 631,000. That lull, behind May's similar lull, does indeed show at least a modest headwind for housing.
Existing and New Home Sales Charts
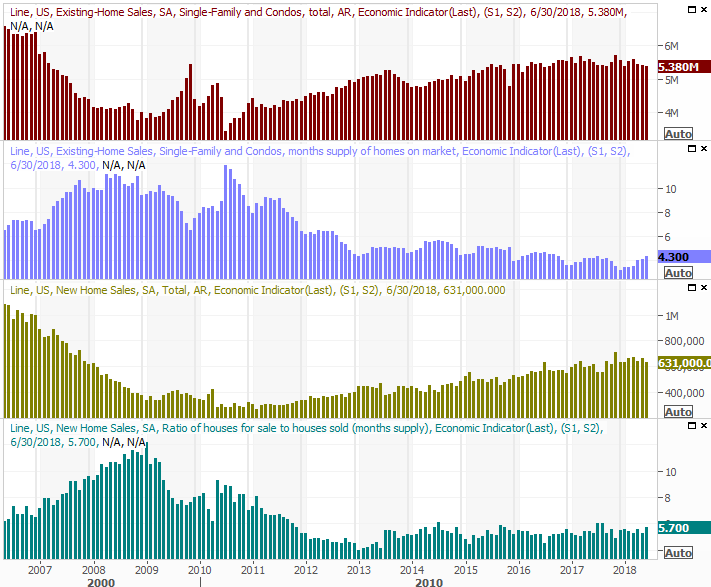
Source: Thomson Reuters
Also notice that inventory levels for new and existing homes edged higher. It had not been clear if a lack of inventory was the core reason home sales had not been growing. Now it is... a lack of inventory isn't the challenge, or at least not the whole challenge. Inventory is still relatively low.
Another big economic announcement last week was, of course, Q2's first GDP growth calculation. Though it didn't quite meet expectations of 4.2%, investors and employees have to be happy with robust growth of 4.1%.
Contrary to the narrative, we actually have seen bigger growth rates within the past few years. This time is different, however, in that the comparison is a legitimately firm one. The occasional GDP growth surges between 2009 and 2014 were mostly the result of fortuitous math. The current environment is one that offers consistent economic strength.
Quarterly (Annualized) GDP Growth Charts
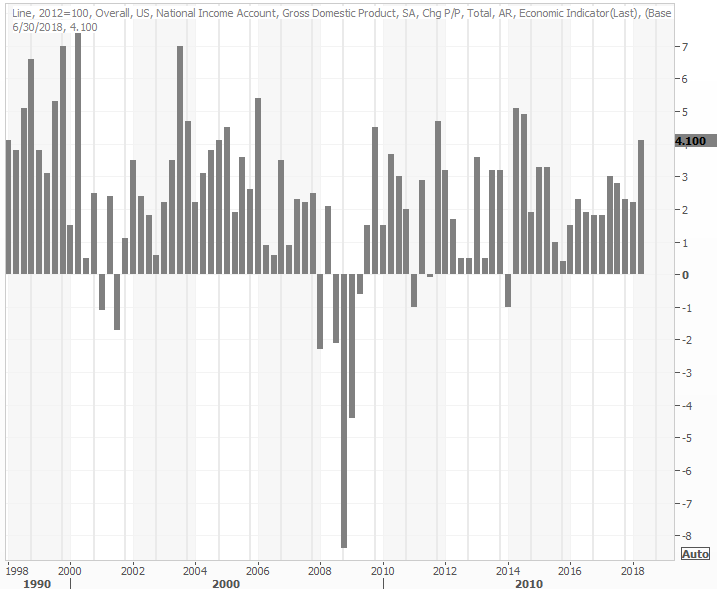
Source: Thomson Reuters
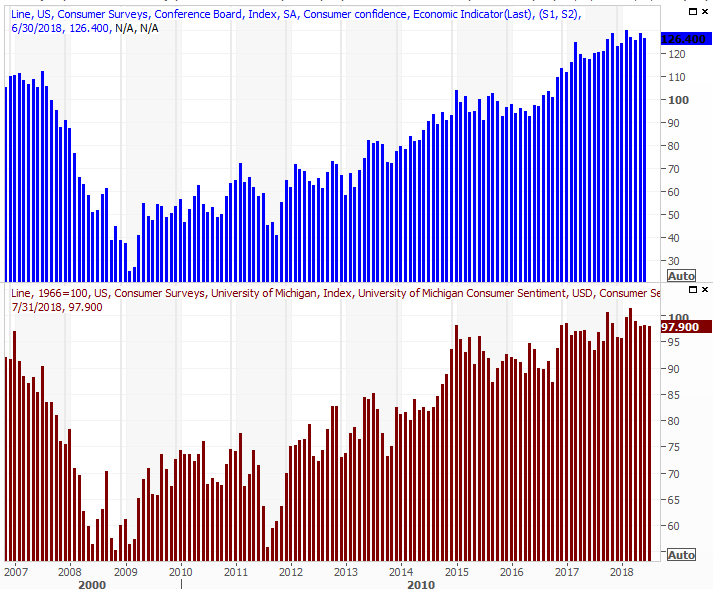
Finally, last week we heard the third and final Michigan Sentiment score for July. We didn't get the Conference Board's measure, as it won't be posted until this week. Given the similarity of the two data sets here, however, we'll show you the one and preview the other... pointing out the bigger trend for both is still onward and upward, but that forward progress is slowing.
Consumer Sentiment Growth Charts
Source: Thomson Reuters
Economists are looking for a modest improvement in consumer confidence as measured by the Conference Board, following the non-change in the Michigan Sentiment Index.
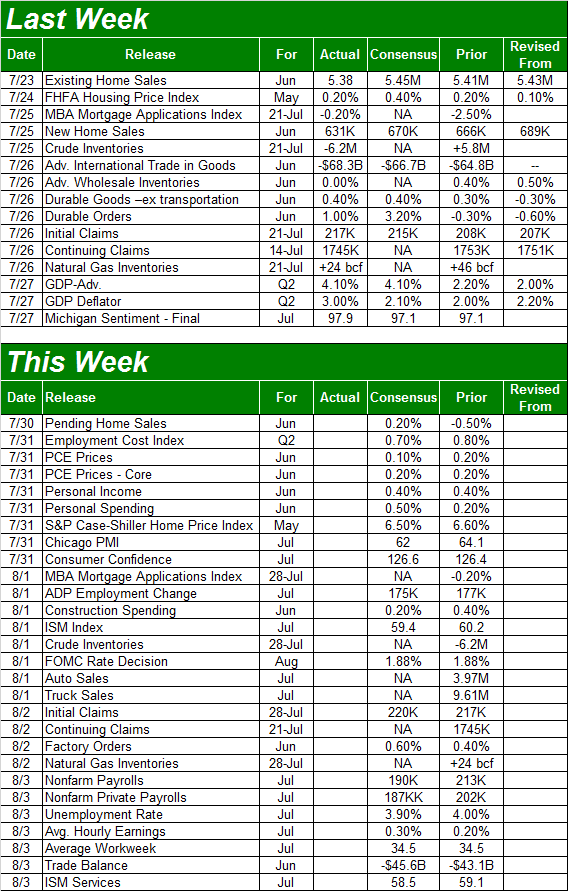
Everything else is on the grid.
Economic Calendar
Source: Briefing.com
Buckle up. As is earnings season wasn't enough for investors to be forced to digest, we're getting a ton of economic news this week including two biggies. On Wednesday the Federal Reserve will have a rate-hike decision for us, and on Friday we'll get July's employment report from the Department of Labor.
We can't look at everything that's coming; we'll have to stick with the highlights.
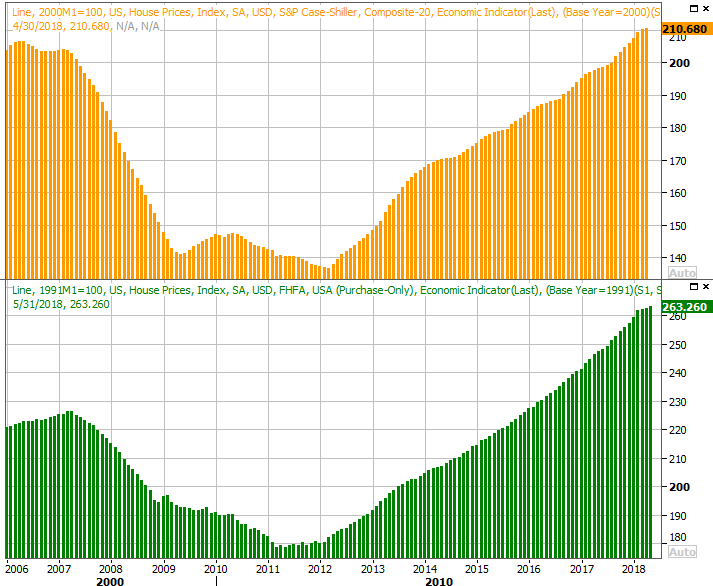
The party starts in earnest on Tuesday, with the Case-Shiller Home Price Index that will round out last week's FHFA Home Price Index. Though home purchases are hitting a headwind, prices remain firm, and continue to improve. That's not apt to change through the final numbers for May... though bear in mind much has happened within the past couple of months.
Home Price Charts
Source: Thomson Reuters
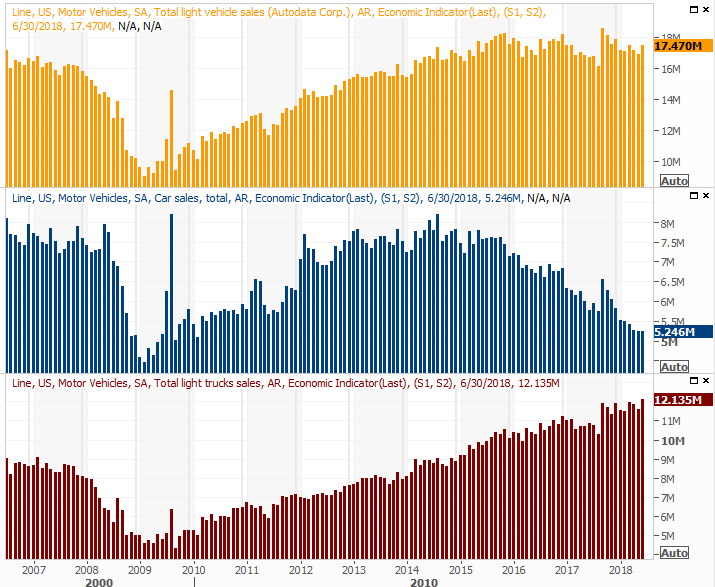
On Wednesday, aside from the FOMC's decision (there's a 95% chance the Fed's not going to raise rates this time around), we're also going to start hearing about July's auto sales. June saw a marked improvement, but it's difficult to call that a trend. Indeed, if there is a trend in place, it remains to the downside.
Auto Sales Charts
Source: Thomson Reuters
The automaker industry desperately needs a good showing here, but somehow isn't apt to get one.
The big Kahuna, of course, is Friday's jobs report. The pros think we made enough progress to whittle the unemployment rate down from 4.0% back down to 3.9%, with 190,000 jobs created. That's not a lot of job growth, but that's not the point. Most everyone who wants a job has a job. The next evolution of the jobs picture is getting a better or higher-paying job. We'll examine that aspect of the report at the site.
Payroll Growth, Unemployment Rate Charts
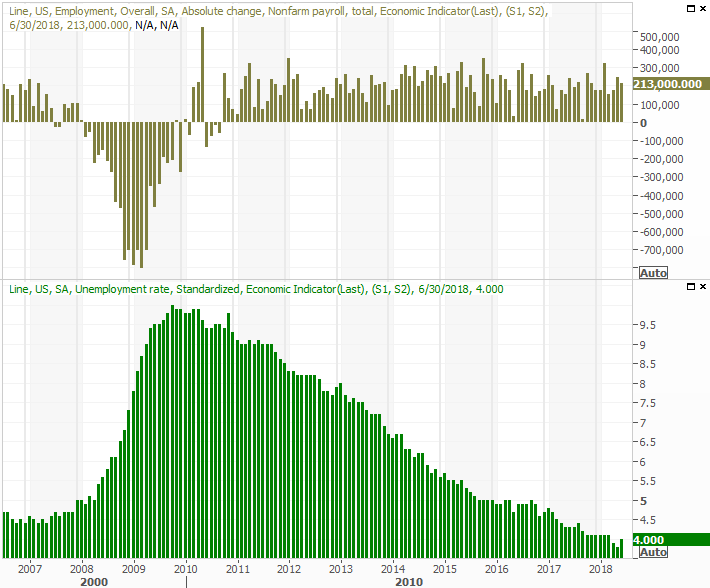
Source: Thomson Reuters
Finally on Friday - as if anyone will have the time or desire to care - we'll get last month's ISM Services data. That report will round out Wednesday's ISM Manufacturing report, which again, will largely go overlooked just because few people will have time to process everything. Just for the record though, the pros think both are going to fall a little. Both remain at very strong levels all the same.
ISM Index Charts
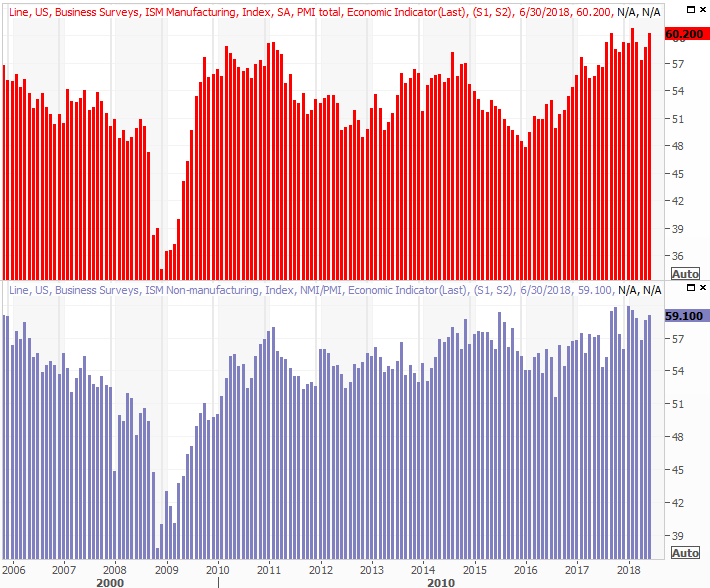
Source: Thomson Reuters
Index Analysis
A week ago we cautioned that, though the undertow was bullish, the S&P 500 was fast-approaching a relatively important resistance line that tagged the last few major highs for the S&P 500. Sure enough, all it took was a kiss of that technical ceiling to put the rally in reverse. Take a look.
S&P 500 Daily Chart, with VIX and Volume
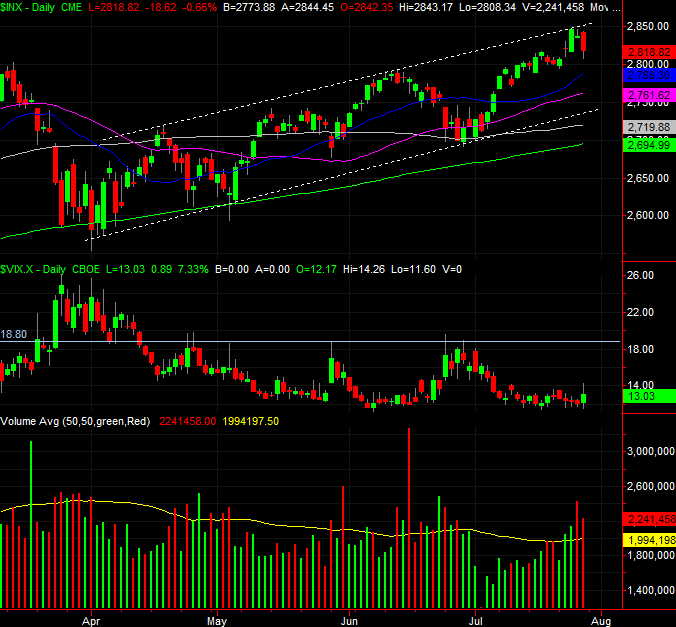
Source: TradeNavigator
It's not necessarily the end of the world. Just as the index has repeatedly bumped into a ceiling, it's also quickly found a rising floor. The pattern may well repeat itself now. Only time will tell. Just for the record though, all signs point to at least a retest of the market's recently-established floors, and there's a reasonably good chance a small pullback could finally turn into a bigger one.
One of the caution flags is the VIX. Though we've seen the market stumble a few times since starting its rally in early July, the VIX was stagnant. Not this time though. This time, it was rattled... even if only a bit. It's a start, if the bears want to capitalize on it.
Also different this time is the amount of volume behind the selling effort, though even the volume surge we saw behind Thursday's and Friday's selling doesn't tell the whole story.
The graphic below puts things in perspective; it will be a familiar one to regular BigTrends readers. The daily 'down' volume has been rising for a while, while the daily 'up' volume has been fading. This was happening even as the overall market was rising, confirming the rally was ultimately flawed.
S&P 500 with Up, Down Volume, Advancers & Decliners
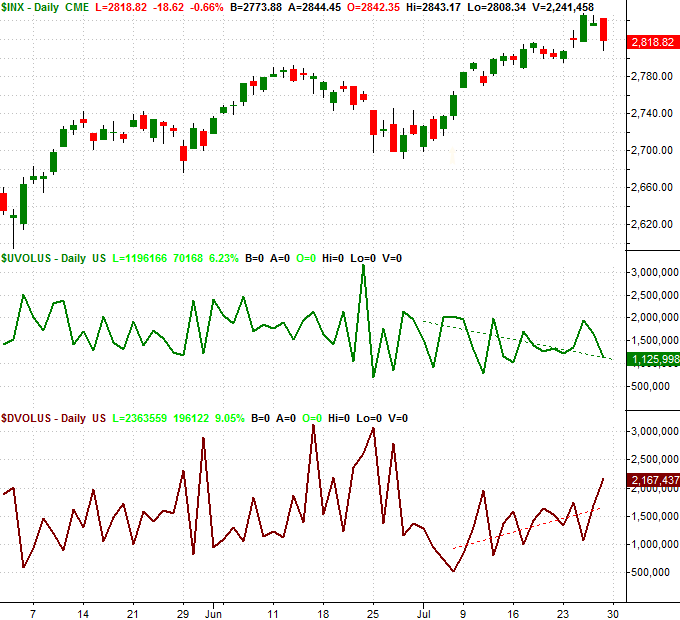
Source: TradeNavigator
Another big red flag is the shape of last week's bar, where the open and close were near the low, but not so much near the high. This is, in effect, akin to an upside-down hammer, signaling a transition from a net-bullish to a net-bearish environment, spurred by some major selloffs from major, market-leading names.
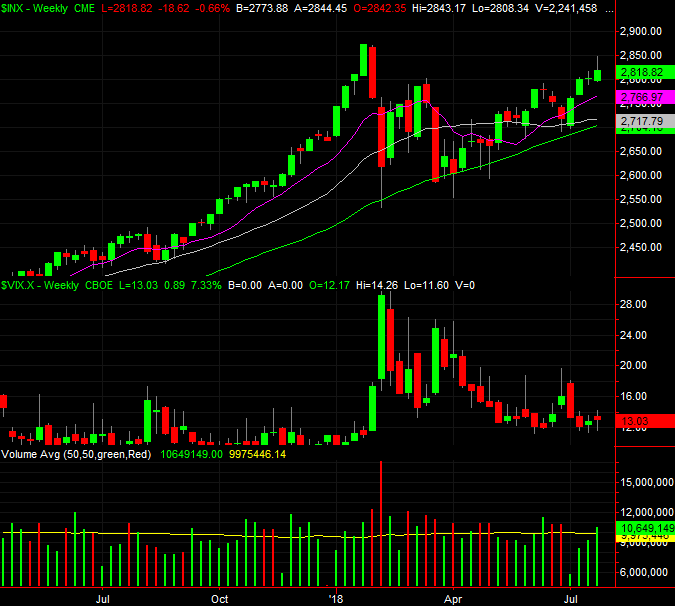
S&P 500 Weekly Chart, with VIX and Volume
Source: TradeNavigator
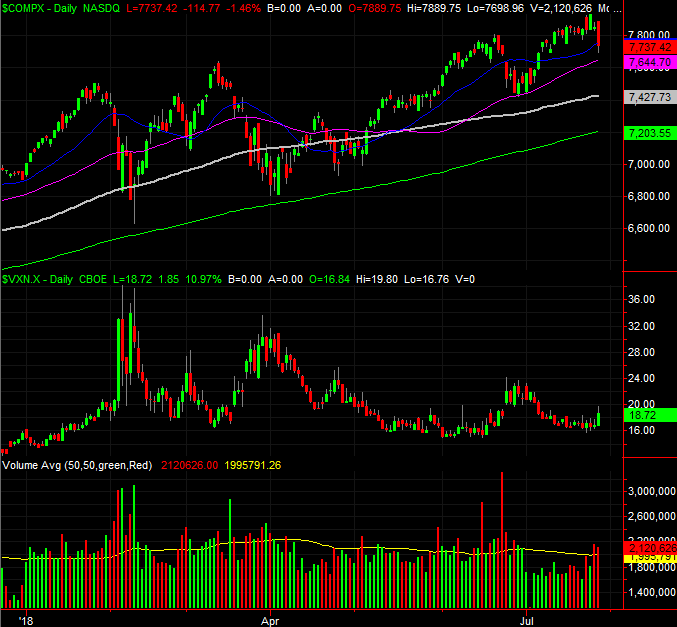
The daily chart of the NASDAQ tells the same story. Though it managed to fight its way to record highs again last week, Friday's stumble may have kick-started a very familiar wave of profit-taking.
NASDAQ Composite Daily Chart, with VXN and Volume
Source: TradeNavigator
On balance, all the clues say we just started a pullback. On the other hand, in the current environment that's not only politically charged but also pushed and pulled by a wave of earnings reports, nothing it set in stone. Keep everything on a short leash, and don't turn your back on the market for a moment.
Hopefully we'll have a little more certainty in a few days, but that's going to require some decisive moves under short-term moving average lines. If the bulls are going to take charge again, it's going to have to happen starting with some buying-volume growth.