Weekly Market Outlook - Traders Lost Interest Pretty Quickly
As we feared a week ago, that breakout move just wasn't meant to last. Between a lack of volume behind the bullish thrust and the time of year (not to mention all the lingering uncertainties), traders just couldn't muster enough mojo to really cement the surge into place.
 That's not to suggest stocks are back in dire straits. All things considered, they're holding their own well enough at a rather important moving average line. Even if it fails, there are several more support lines below it. More than anything, stocks are on the fence. It's a problem only because they could remain in the fence for a while.
We'll weigh the good, the bad and the ugly below, after a quick run-through of last week's economic reports and a preview of this week's economic announcements.
Economic Data
Pretty big week last week in terms of economic data. Let's just take it from the top. In order of appearance...
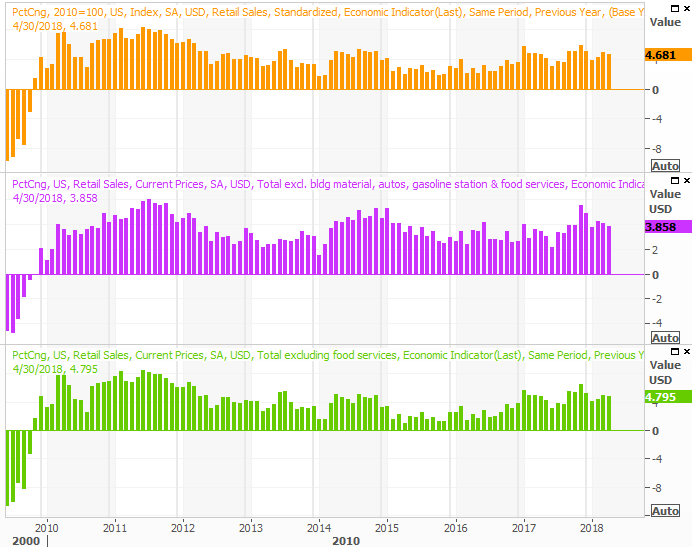
Last month's retail sales were strong, though not surprisingly, not as strong as March's growth. With or without automobiles factored in, retail spending grew 0.3% for the month. That's still on the order of 4% on a year-over-year basis, which is more than enough to keep the consumer-driven economy humming.
Retail Sales Growth (Annualized) Charts
Source: Thomson Reuters
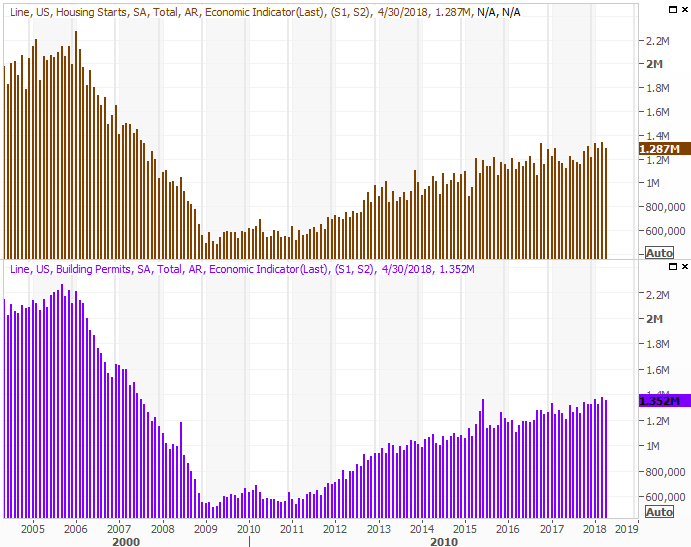
On Wednesday we heard about April's housing starts and building permits. They were, as expected, mediocre. They fell a bit from March's tallies, though March is a big month for starts so a bit of a lull is to be expected. More than anything though, with home prices still on the rise and inventories still lingering near multi-year lows, the modest starts and permits are more by choice than by force. (The market may be waiting to see to what extent rising mortgage rates will crimp demand.)
Housing Starts and Building Permits Charts
Source: Thomson Reuters
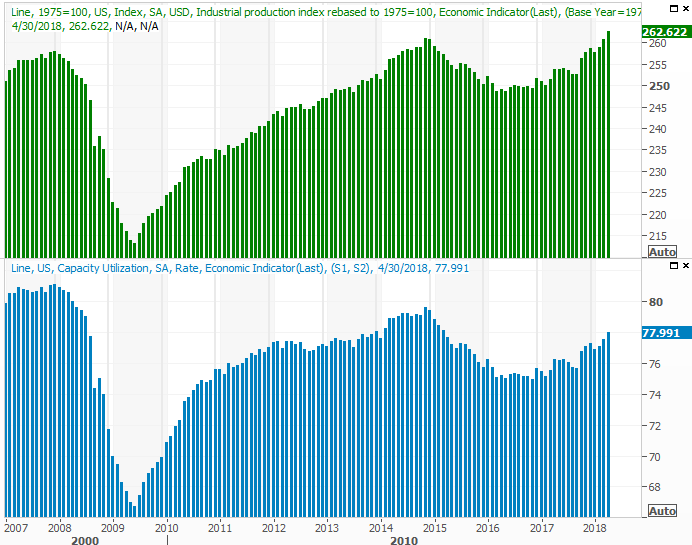
Finally, the last biggie from last week was the Federal Reserve's report on capacity utilization and factory production for April. Both were up, again, more or less in line with expectations.
Capacity Utilization and Industrial Productivity Charts
Source: Thomson Reuters
We've explained it before but it bears repeating now... the capacity utilization and industrial productivity trend coincide amazingly well with corporate earnings, and therefore coincide with the broad market. Though it can't cause or prevent short-term gyrations, it can reverse them when they move in contrast to the bigger-picture undertow. The fact that both continue to trend higher is a bullish sign for stocks.
Everything else is on the grid.
Economic Calendar
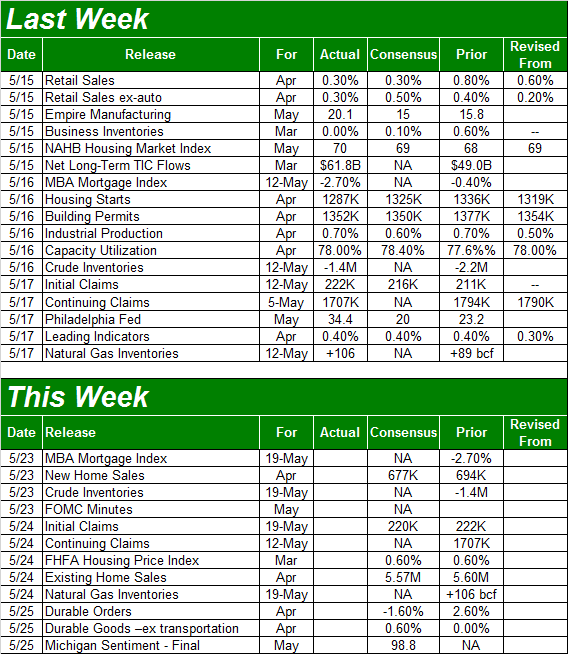
Source: Briefing.com
This week is going to be relatively light in terms of economic news, but certainly all eyes will be waiting for Wednesday's release of the minutes from the most recent FOMC meeting. Rising rates are becoming a concern to the point of stymieing stocks, and any clue that will help traders get a grip on what's to come is sure to be scrutinized in a big way.
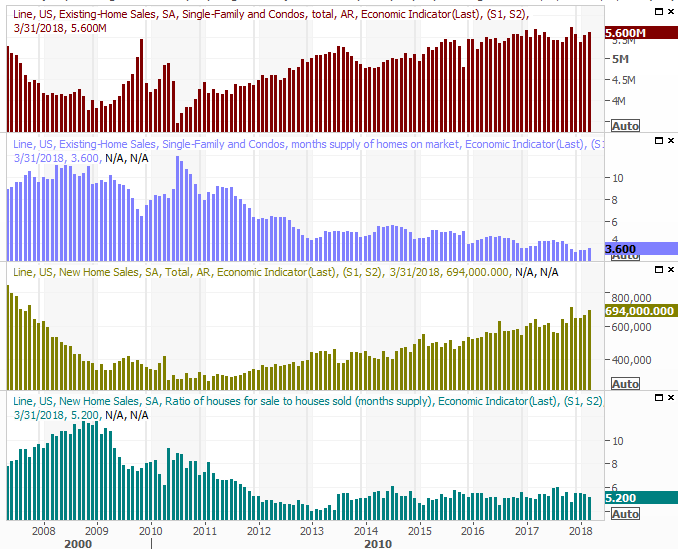
Besides that, it's a huge week (again) for real estate. Look for the new-home sales report on Wednesday, followed by the existing-home sales report on Thursday. Economists expect both to rise, extending a healthy uptrend on both fronts.
Home Sales (New and Existing), Inventory Charts
Source: Thomson Reuters
Notice that - and we mentioned it already - sales are growing despite a lack of inventory. That's not a terrible problem to have, but it's a dynamic that can't persist forever. Sooner or later, home values will reach levels that prompt builders into greater action.
Index Analysis
The breakout move from two weeks ago, to put it simply, fizzled out. The S&P 500 lost 0.5% of its value last week, which isn't the end of the world, but the lack of follow-through at a most critical time is at the very least annoying.
Then again, it wasn't terribly surprising. We cautioned last week there was a distinct lack of volume behind the effort - suggesting a lack of genuine interest - and last week's light volume (more than anything else) implies traders are still mostly disinterested.
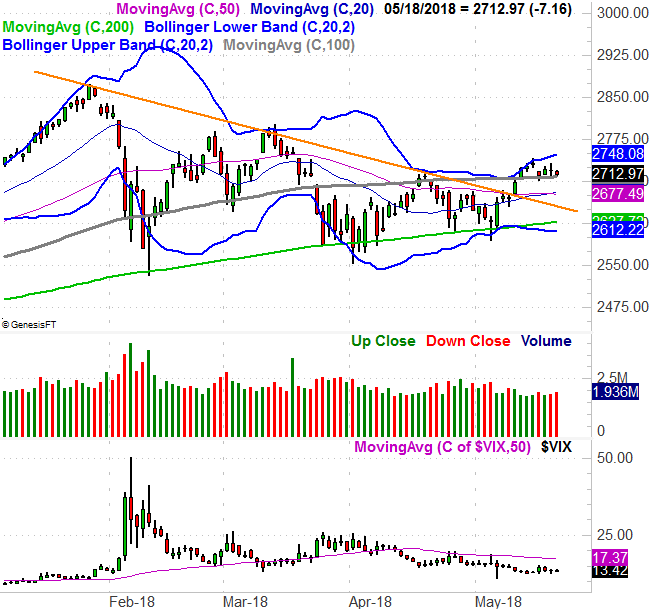
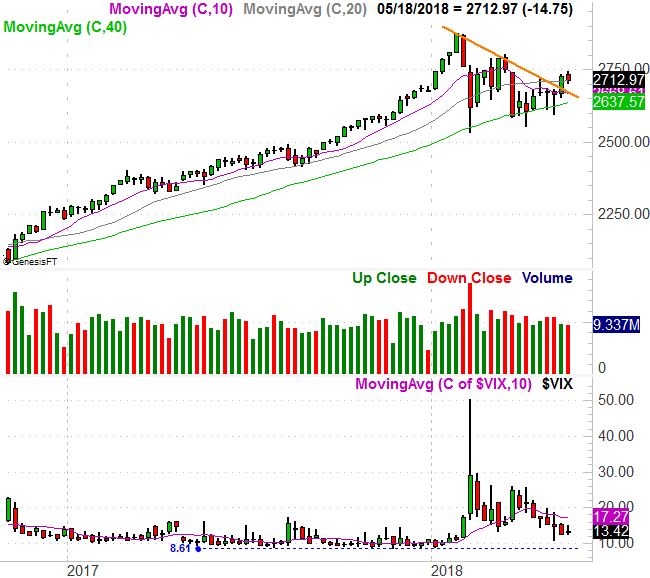
The good news is, the bulls at least left themselves with an advantage. As the daily chart of the S&P 500 below shows, the 100-day moving average line (gray) is now acting as support. As long as it holds up as a floor, the bulls have a chance of establishing a base from which to launch the next breakout thrust.
S&P 500 Daily Chart, with VIX and Volume
Source: TradeNavigator
There are more upsides than that.
Despite the lack of volume, the breakout from two weeks ago (the move above the orange line on the daily chart above as well as the weekly chart below) is still intact. That move doesn't have to be perfectly linear to be rewarding. And, though the VIX is 'low,' it's not at lows that have been absolute floors... not that the VIX's sideways action around 9.0 for the better part of 2017 stood in the way of a rally anyway.
S&P 500 Weekly Chart, with VIX and Volume
Source: TradeNavigator
There's another clue saying the same thing... some information we haven't looked at in a long time.
The simple explanation of the put/call ratio (of options) is, it's a contrarian tool. When traders are the most bearish and buying way more puts than calls, a market bottom is often near. Conversely, when traders are most bullish and buying way more calls than puts, it's actually a sign that a top is nigh.
We're neither near a top nor a bottom for the put/call ratio, but we can still glean something from the current direction of the put/call ratio trend.
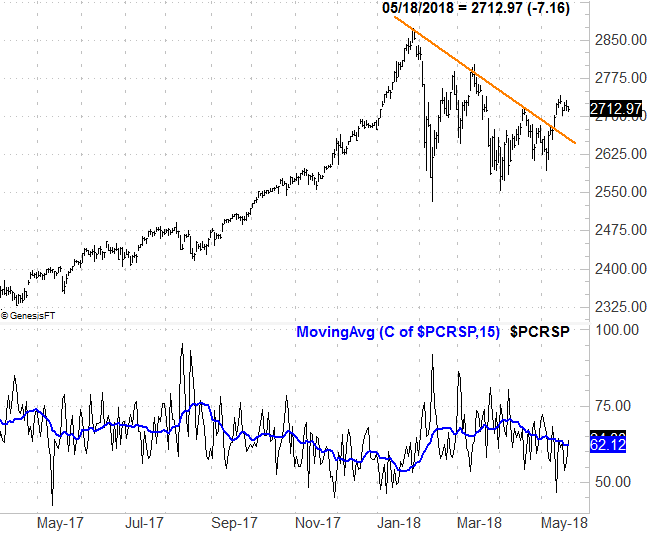
The daily chart of the S&P 500 with the equity-only put/call ratio at the bottom is only made useful when we apply a moving average to the otherwise-erratic daily put/call data. As you can see, the January high didn't become a peak until the put/call ratio got comfortable around 50. On the flipside, the put/call ratio peaks around 75 last year were both particularly strong buy points.
S&P 500 Weekly Chart, with Equity-Only Put/Call Ratio
Source: TradeNavigator
The put/call ratio's moving average line, as was noted, isn't at an extreme reading now, but we do know that even a falling put/call ratio tends to coincide with bullishness... at least until it reaches the 'too low' area around 50.
In other words, there's a decent possibility the bullishness could reignite. If it is to reignite though, we can't stress enough that it's going to have to muster some interest from traders at a time of year when investors have everything else (ball games, graduations, vacations) on their minds.
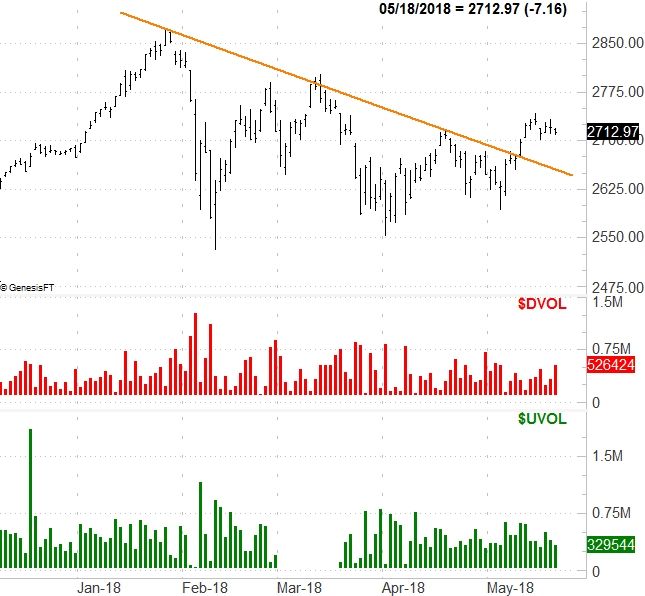
We've had this discussion many times before, but it merits repeating - and detailing - now. The amount of 'up' volume is waning again, having never developed all that much two weeks ago to begin with. Meanwhile, the amount of 'down' volume may not be soaring, but it's holding firm, and almost looks like it was ready to start growing again as of Friday's seemingly-benign trading session.
S&P 500 Daily Chart, with NYSE Up, Down Volume
Source: TradeNavigator
The most realistic expectation here? Unfortunately, the mixed messages underscore the calendar-based reality that stops are going to do little more than drift sideways for the foreseeable future, chopping around and dishing out plenty of headfakes along the way.