Weekly Market Outlook - Time to Play the Waiting Game
Following through just as scripted on the reversal bar from two Fridays ago, the market rallied quite nicely last week. When all was said and done, the S&P 500 gained 4.3% last week, following one of the most bearish weeks we've seen in years.
 And yet, the effort didn't get the market back above the most important hurdle the bulls wanted cleared. In fact, the buyers began to retreat as soon as push came to shove.
Maybe it was just a pause so traders wouldn't be overexposed to stocks in front of the three-day weekend. Or, maybe it's a hint that traders don't really believe this rally effort is going anywhere.
We'll examine the big technical ceiling below, as always, after running down last week's and this week's economic news.
Economic Data
Busy week last week, with most of the major economic news crammed into the last three trading days. Let's run through it in the most time-effective way possible, beginning with the big inflation report for January.
As it turns out, we're seeing plenty of it, and more than expected... though perhaps not as much as last week's headlines would imply. The overall inflation 'rate' now stands at 2.13%, and is only 1.8% on a core basis. Producers are seeing a little more, with their prices being up 3.1% last month, on an annualized basis.
Consumer and Inflation (Annualized) Charts
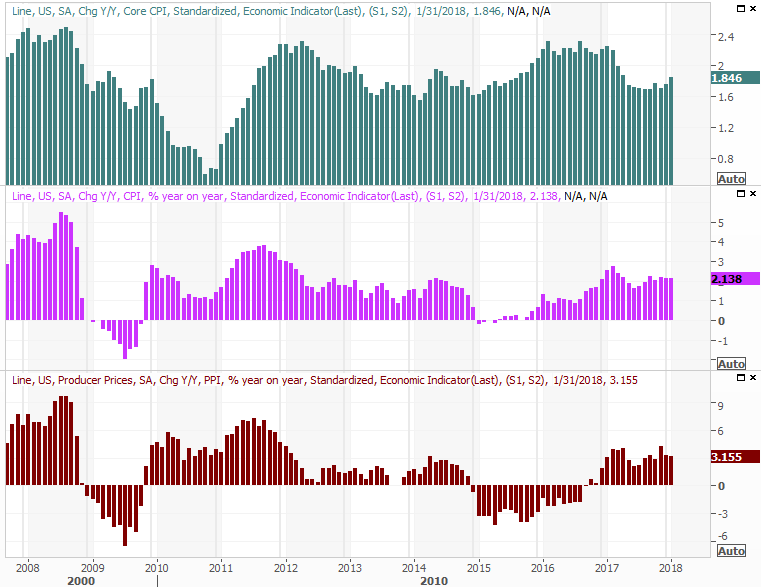
Source: Thomson Reuters Eikon
The chatter about the need for rate hikes sooner than previously anticipated was spurred by the surprisingly rapid increase in prices from December's levels, but that wasn't a terribly meaningful comparison. As you can see, inflation rates are actually stabilizing at sustainable and healthy levels.
The headlines regarding retail sales in January was similarly misleading. Yes, retail consumption was flat in January, but that was compared to December's spending levels after allowing for a seasonal adjustment (and adjustment that's not exactly perfect). Taking automobile sales into account, retail spending actually fell 0.3% last month.
Problem: Compared to January of 2017's retail spending, consumption was actually up about 3.6%. Moreover, inflation didn't do that heavy lifting. As the graphic below illustrates, spending was quite strong during the last three months of last year, setting the stage for a relatively tepid January retail sales report.
Retail Sales Growth (Annualized) Charts
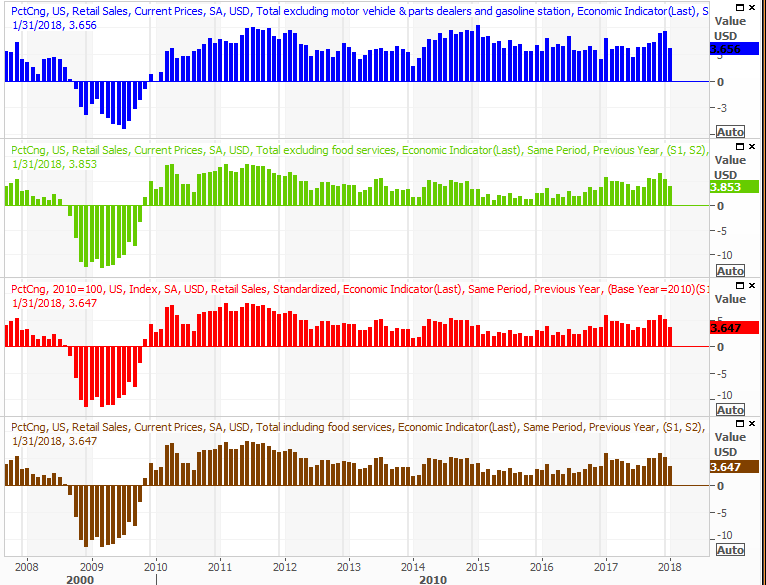
Source: Thomson Reuters Eikon
Perhaps more important than anything else we heard last week, January's capacity utilization and industrial production reports were both down slightly from December's levels.
Capacity Utilization and Industrial Productivity Charts
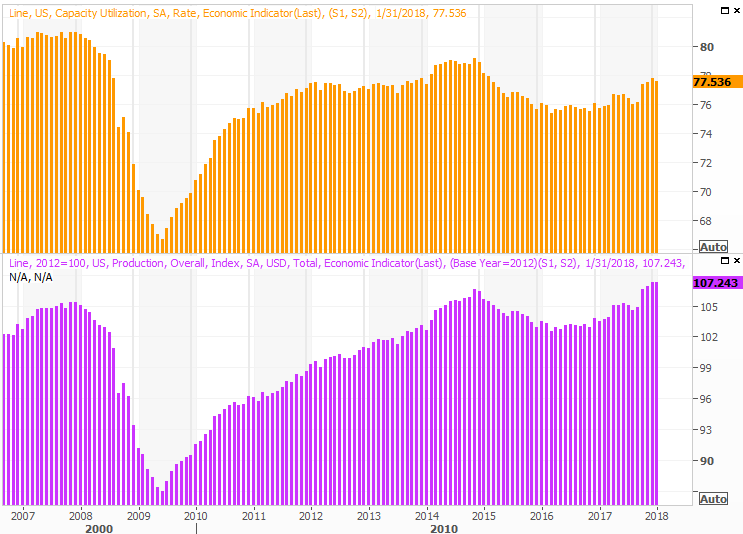
Source: Thomson Reuters Eikon
The lull isn't the end of the world; much of it may be attributable to seasonality and oddly bad weather that shut some businesses down temporarily. Another weak month, though, and we might have to reassess that defense.
These two data sets show an incredibly strong correlation with the broad market's long-term direction, and corporate earnings.
Finally, January's seasonally-adjusted housing starts and building permits perked up quite nicely at a time when the construction market needed a boost. Starts came in at a pace of 1.326 million, almost reaching a multi-year high, and permits did hit a multi-year high pace of 1.396 million.
Housing Starts and Building Permits Charts
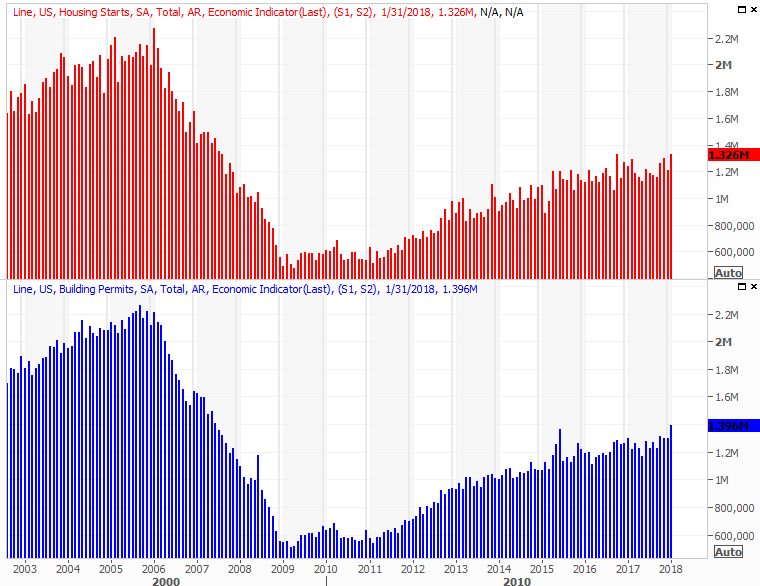
Source: Thomson Reuters Eikon
The rush of new-home interest may reflect an effort to purchase a house before interest rates edge higher later this year.
Everything else is on the grid.
Economic Calendar
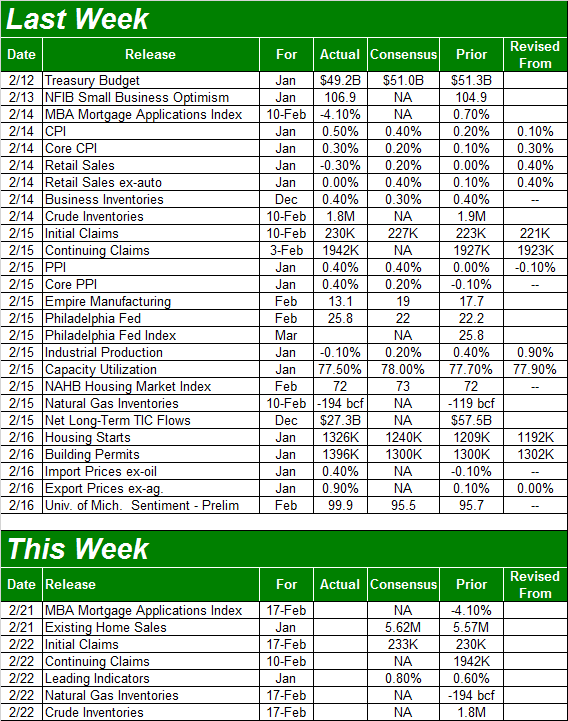
Source: Briefing.com
This week is going to be considerably less busy. In fact, there are only two items we're interested in - last month's sales of existing homes, and last week's crude oil inventories.
The home-sales report is only half the picture. The report on new homes sales won't be posted until next week. Still, we can see the bigger undertow on both fronts is growth, despite December's lull. You can also see that even with a stable level of inventory of new homes, it's not risen with new home sales. Meanwhile, inventories of existing homes are still at multi-year lows.
New and Existing Home Sales (Annualized) and Inventory Charts
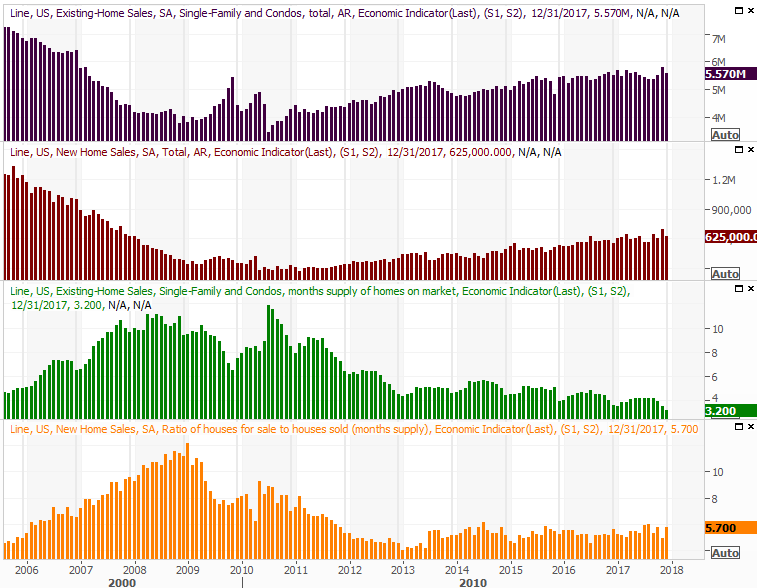
Source: Thomson Reuters Eikon
It's possible that home sales could be held back by the sheer lack of homes for sale. It will be interesting to see if last month's rapid growth in starts and permits allows for greater rates of purchase activity.
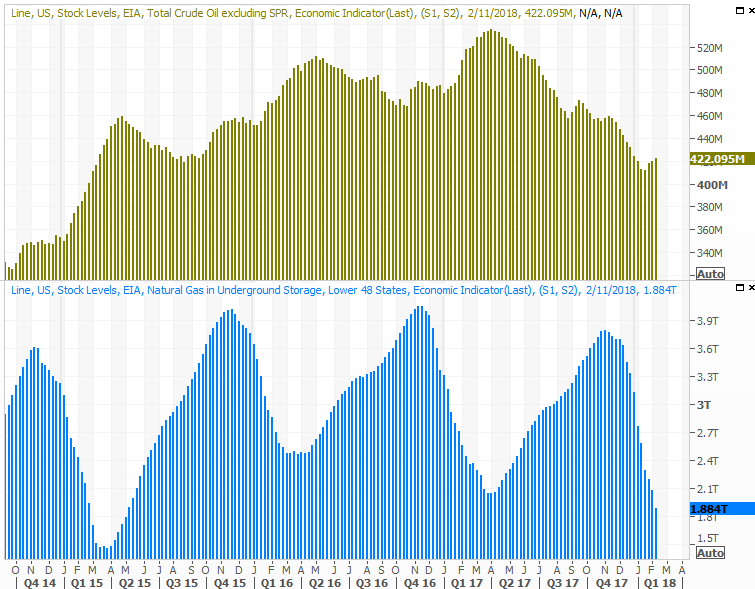
Finally, as we expected just a couple of weeks ago, crude oil inventory levels are building again. It's a slow build though, so don't assume we're headed back into a glut. We'll need something of a build headed into spring and summer, which are busy travel times and consumer more petroleum products.
Crude Oil and Natural Gas Inventory Charts
Source: Thomson Reuters Eikon
Meanwhile, though the burn-off of natural gas inventory levels is normal around this time of year, a surprisingly cold winter has burned off more than it usually might. Still, we've seen and survived lower stock levels, though this does suggest gas prices can remain firm.
Index Analysis
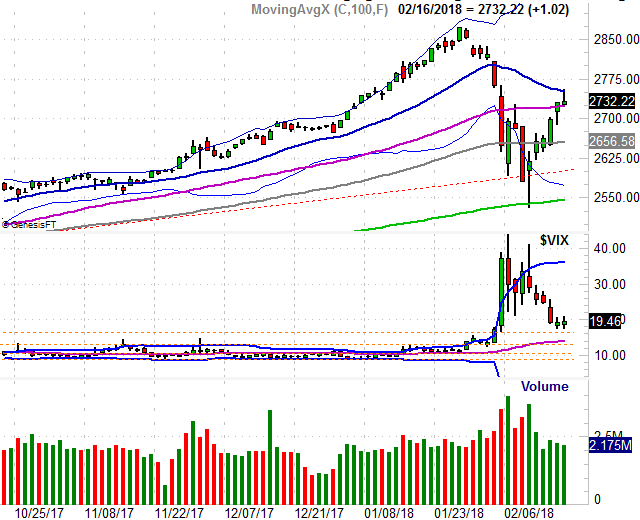
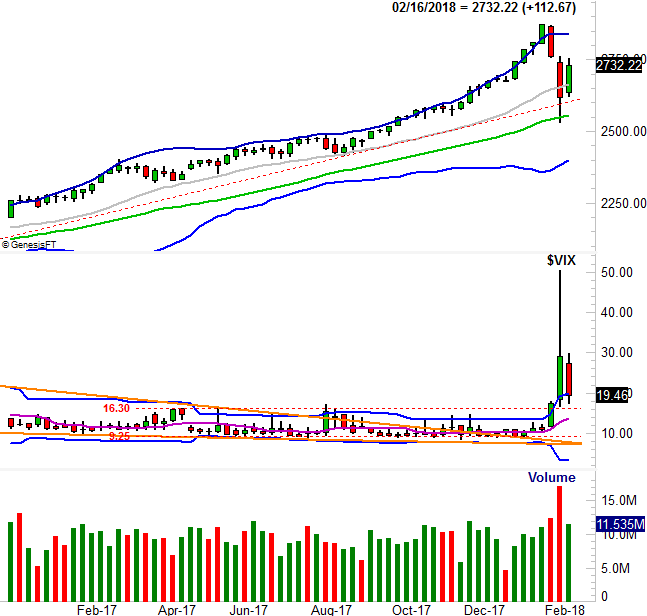
Without a look at the charts, last week's bullishness seems encouraging... just the kind of dead-cat bounce we would expect after the kind of drubbing stocks took two weeks ago. All it took was a brush of the 200-day moving average line (green) to kick-start the bullish reversal, but the 20-day moving average line (blue) stopped the rebound effort cold in its tracks. In fact, the buyers backed off and the sellers (though maybe they were profit takers) dug in just as soon as that technical ceiling was bumped.
S&P 500 Daily Chart, with VIX and Volume
Source: TradeNavigator
A reversal may have been in the cards all along. We won't really know until this week, and it could take several days for the market to figure out what direction it really wants to move in. The good news is, the lines in the sand - bearish and bullish - are well defined.
There's a decent bullish argument though, on the weekly chart of the S&P 500.
Take a look. Last week's low-to-high range is almost entirely contained inside the previous week's open to close range, with the former pointed in the opposite direction as the latter. This is an inside-day reversal (or an inside week reversal, in this case), showing a sharp change of heart. Generally speaking, inside-day and outside-day reversals tend to be long-lived reversals. In other words, we have to take last week's reversal - in this context - seriously. Also note that the VIX has room to keep moving lower, allowing stocks to keep climbing higher.
S&P 500 Weekly Chart, with VIX and Volume
Source: TradeNavigator
That's not an outright bullish call, as this isn't the ideal context for an inside-day reversal. It would take a much bigger/deeper pullback to create the capitulation we really need to see here. Though dramatic, the 11% selloff we suffered during the first half of February wasn't really enough to hit the market's 'reset' button.
And there's the rub. There's no great technical context here for a bullish argument. There's not a great bearish clue either, even though the bump into the 20-day moving average line suggest we could see a short-term pause here. More than anything, we're on hold here, waiting for traders' stress, anxiety and assumptions to dissipate.
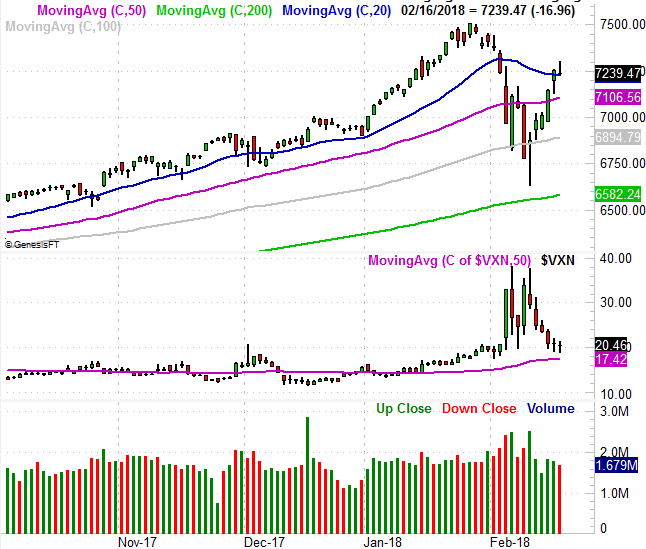
The daily chart of the NASDAQ Composite looks more or less the same, and doesn't tells us anything we didn't already know. Do take note, however, that for both the S&P 500 and the NASDAQ, the volume behind last week's rally was always sub-par. This bounce doesn't have a whole lot of believers supporting it.
NASDAQ Daily Chart, with VXN and Volume
Source: TradeNavigator
This week is going to be a test, and a coin toss. The undertow isn't securely bullish yet, though it could be soon. On the flipside, as rough as things were two weeks ago, stocks still aren't past the point of no return. That would be a move below the 200-day moving average lines. There's lots of room between here and there.