Weekly Market Outlook - The Thread Broke on Friday
It wasn't pretty, but it was enough. Stocks managed to hold their ground long enough through the first four days of last week to remain "in the hunt" for a renewal of the breakout effort. Then on Friday, the effort buckled. The indices all pulled below pivotal lines in the sand, ending the week on the wrong side of them. The bulls might get another chance to take a step back from the edge of the cliff, but the odds of a quick recovery just got a lot lower.
We'll take a look at the wound below, after running down last week's big economic news and previewing this week's announcements. Spoiler alert: It's all going to be about the jobs report due on Thursday, before the three-day holiday weekend gets started on Friday.
Economic Data Analysis
The week gave us several pieces of economic data to chew on. While none of it was terribly hard-hitting, a handful of these items are worth a closer look just to keep them in context as we continue to push our way through the impact of the coronavirus.
Case in point: Home sales. New home sales in May edged up to a pace of 676,000, annualized, while sales of existing homes slumped from April's cadence of 4.33 million to 3.91 million. Both figures are relatively tepid, though both figures remain crimped simply due to the difficulty of showing or looking at homes. Either way, the fact that meaningful levels of home sales are still happening at all is encouraging.
New Home Sales Charts
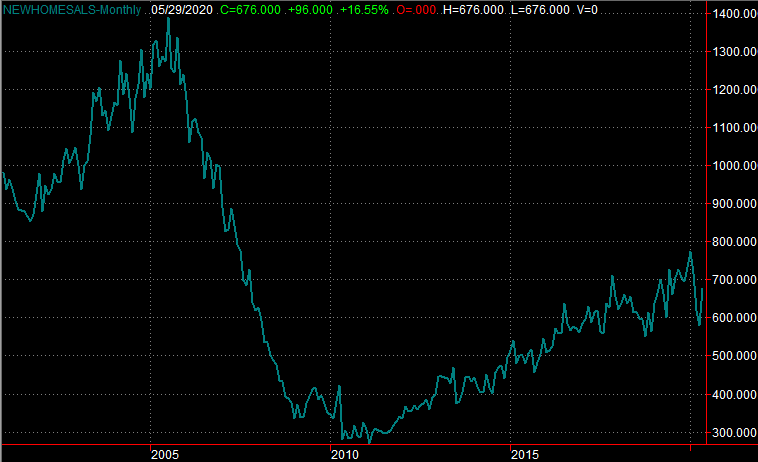
Source: Census Bureau, TradeStation
In the same vein, the FHFA Housing Price Index was up 0.2% from March to April, and while mortgage applications fell nearly 9% two weeks ago, that was down from an 8% advance the week before.
All in all that tide-resistant strength jibes with June's final look at consumer sentiment, as measured by the University of Michigan. The index rolled in at 78.1 for June, well up from May's last reading of 72.3.
Consumer Sentiment Charts
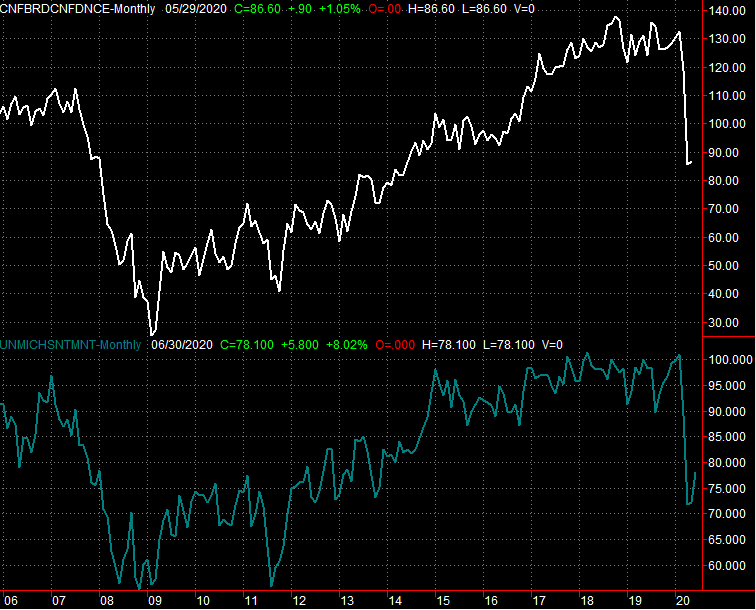
Source: Univ. of Michigan, Conference Board, TradeStation
We'll get the Conference Board's take on the matter this week, though it's expected to more or less move in the same direction... up from May's steep dip. That seems like a tough idea to buy into given the backdrop - another surge in coronavirus cases - but that premise is supported in other ways by other numbers. Although personal incomes fell 4.2% in May thanks to job losses and job-related hits to income, consumer spending surged in May as well, by 8.2%. People aren't exactly making a point of conserving cash.
One last thing - Q1's GDP did fall 5%, as was expected with the second estimate just a few weeks back. Everything else is on the grid.
Economic Calendar

Source: Briefing.com
This week will be a big one for economics news. Not only will he hear about sentiment from the Conference Board, but we'll also get both ISM measures for June and them June's jobs report on Friday. Auto sales for June will also start to flow this week. But, first things first.
Both are still projected to remain below the pivotal 50 level, but economists are calling for a surprisingly big improvement in the ISM data. The manufacturing version of the index, in fact, is expected to improve from May's 43.1 to 49.2 for June, thanks to the partial-but-ongoing re-opening of America.
ISM Index Charts

Source: Institute of Supply Management, TradeStation
The big Kahuna, of course, is Friday's payroll and unemployment figures. Expect anything, and don't be surprised to be surprised. Last month's jobs gain was a shock despite the environment. That being said, the pros are actually calling for more progress... another 3.5 million (net) new jobs, pushing the unemployment rate down from 13.3% to 12.6%.
Payroll Growth and Unemployment Rate Charts

Source: Department of Labor, TradeStation
Stock Market Index Analysis
The S&P 500 will serve as our proverbial guinea pig, though know the same basic premise applies similarly to all the major indices. And that premise is, the market just broke. It's not beyond saving just yet, but the bulls will need to immediately perform some convincing triage.
For the S&P 500, the damage is Friday's close below the 200-day moving average line (green) at 3021. That long-term moving average line looked like it would hold up as support on Wednesday and Thursday, but a little too much bad news on the COVID-19 front Friday finally tipped the scales in the other direction. Also notice there was a lot more volume than normal behind that day's selling.
S&P 500 Daily Chart, with VIX and Volume
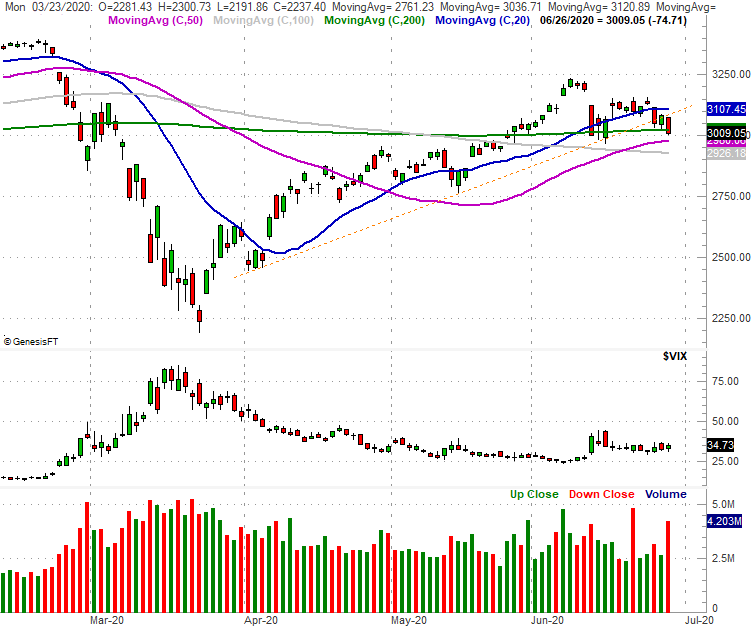
Source: TradeNavigator
You'll also notice the index fell under straight-line support (orange, dashed) that connects all the major lows since early April... another red flag.
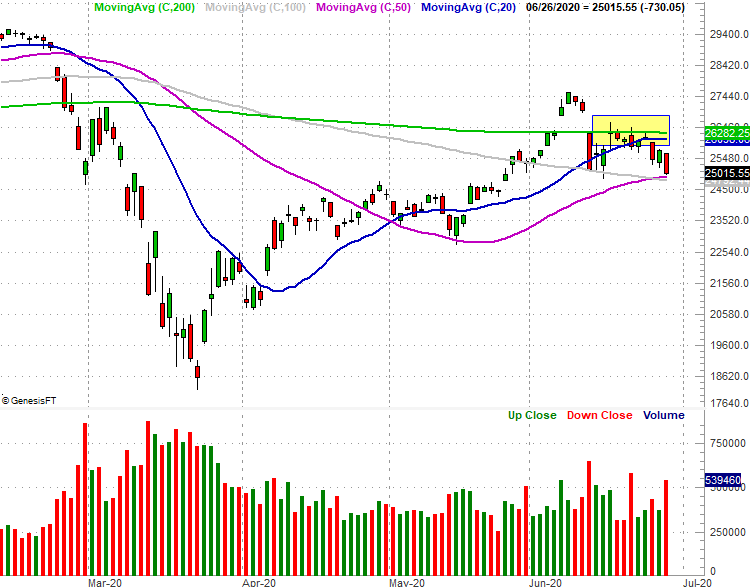
The Dow Jones Industrial Average didn't fall below its 200-day moving average line last week, but only because it wasn't able to even crawl back above it in the middle of this month. Rather, the 200-day moving average line appeared to act as technical resistance in mid-June (highlighted), pushing the Dow back to within striking distance of breaking under its 100-day (gray) and 50-day (purple) moving average lines.
Dow Jones Industrial Average Daily Chart, with Volume
Source: TradeNavigator
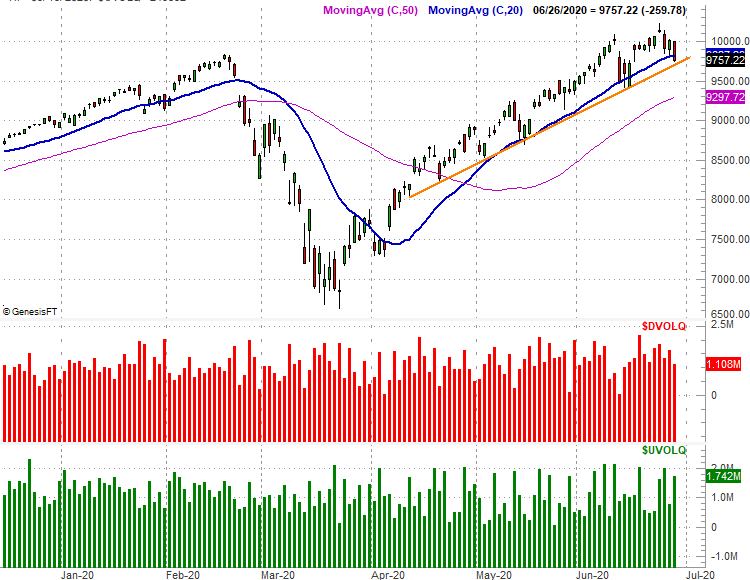
Even the mostly-bulletproof NASDAQ Composite stumbled into trouble last week, although not as much as its peers. Namely, it moved under its 20-day moving average (blue) on Friday. It didn't pull below straight line support that was established in mid-April though (orange), and curiously, there was more bullish volume for the composite on Friday than there was bearish volume, even though the index itself lost ground. That's a glimmer of hope for a quick recovery.
NASDAQ Composite Daily Chart, with Up and Down Volume
Source: TradeNavigator
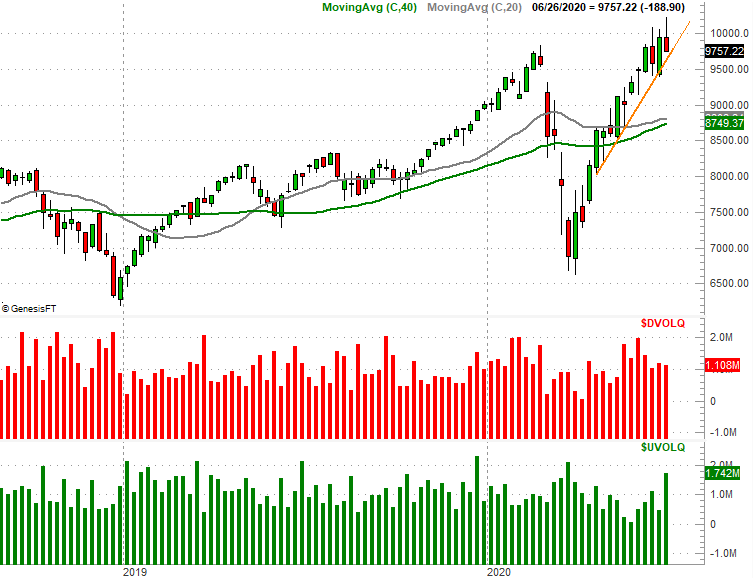
Except, that glimmer isn't quite as shiny when you take a step back and look at the weekly chart of the NASDAQ.
Take a look. The past 14 weeks have been stunning... almost as stunning as the plunge witnessed during the four week span before the beginning of the past 14 weeks; it's been a game of extremes. All told, the composite soared from a low of 6631 to a peak of 10,222. That's a 54% swing that still leaves the NASDAQ valued right around its pre-coronavirus peak. That suggests traders don't think the pandemic has hurt the underlying value of the NASDAQ's components at all. Maybe (in the end) they're somehow right.
NASDAQ Composite Weekly Chart, with Up and Down Volume
Source: TradeNavigator
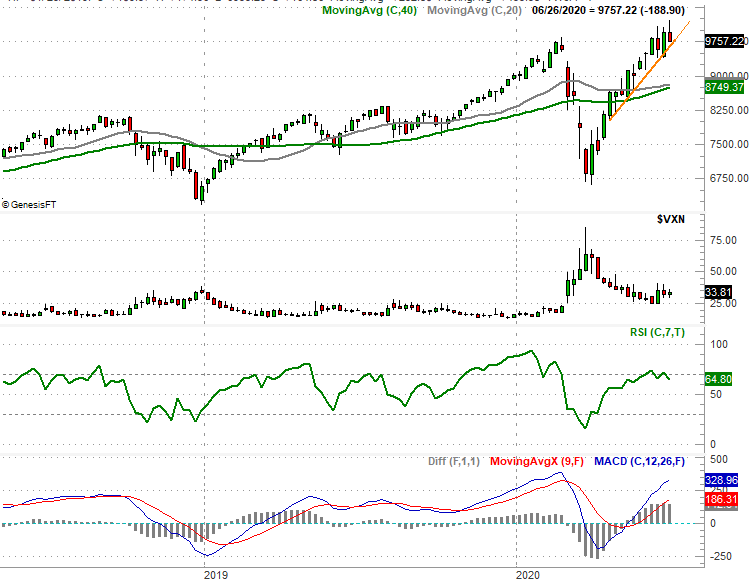
Still, that's a tough idea to swallow, particularly given how much profit-taking pressure is now built up... especially for the NASDAQ. As the chart of the composite below illustrates using its RSI (relative strength index) indicator, not only is the index into overbought territory, it's starting to work its way out of that condition by virtue of the RSI lines slide below 70. This is an early warning that the advance is losing stream.
NASDAQ Composite Weekly Chart, with RSI and MACD
Source: TradeNavigator
One red flag we don't have yet is a bearish MACD cross and the NASDAQ's break under a support line that's been in play since April. That's what will keep a keen eye out for this week, as well as the VXN's potential move about its recent highs around 40.