Weekly Market Outlook - The Market's Not Yet Beyond Saving, But It's Close

The previous week started out bullishly enough, with the S&P 500 mustering another record-high close on Monday. With the weight of all the recent gains increasingly bearing down though (not to mention the calendar - this is usually a lethargic time of year), it was just too much. Stocks logged their first weekly loss in the past four. Perhaps worse than that, Friday's weakness quietly pulled a couple of key indices well below key technical floors. The damage done isn't obvious to most, but significant.
We'll take a detailed look at this damage below. First, let's run down last week's and this week's economic data. There was a lot on last week's dance card, and overall, it was less than bullish. Fortunately this week's jam-packed schedule isn't jam-packed with a lot of market-moving data. Or, maybe the lack of economic news to latch onto will allow traders to continue dwelling on marketwide risks.
Economic Data Analysis
Busy week, with the highlight being Wednesday's decision from the Federal Reserve about interest rates following Tuesday's producer inflation reports. As was expected, the FOMC didn't alter its target Fed Funds rate from a range of 0.0% to 0.25% (0.13%, effectively). The FOMC is starting to move a little bit toward the hawkish end of the spectrum from its current place well onto the dovish side. As much consumer inflation as we saw last month - the annualized consumer inflation rate now stands 5.0% -- factories and assembly plants and packagers saw even more. Their annualized inflation of input costs is currently 6.6%... the highest it's ever been. Even on a core basis it's 4.8%. The Fed's changing rhetoric isn't merely meant to be coy or clever. Inflation could easily race out of control, even if the year-ago comparison prices are abnormally low due to the sudden onset of the pandemic.
Consumer and Producer Inflation Rate Charts
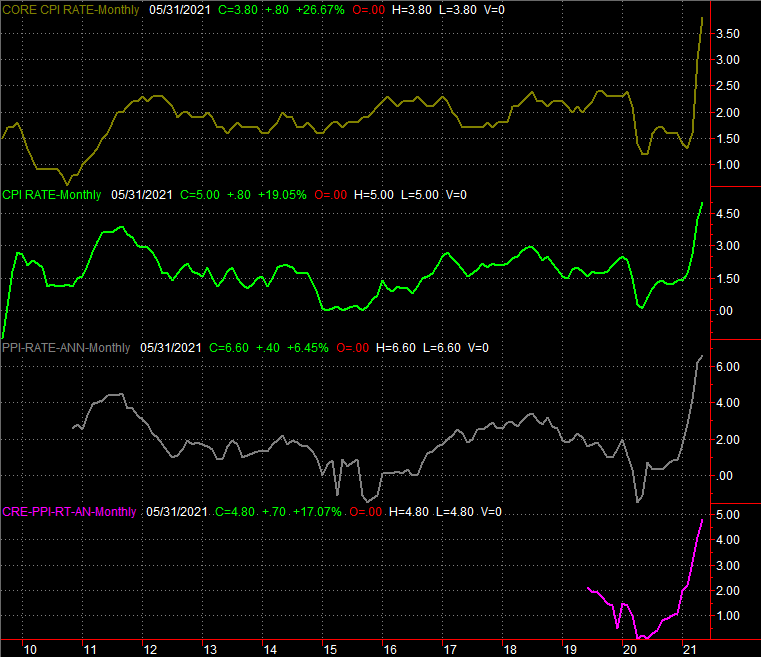
Source: Bureau of Labor Statistics, TradeStation
Regardless, the country's factories aren't slowing down in the fact of rising costs. In fact, they're still ramping up. Industrial production grew another 0.8% following April's 0.6% expansion, and the utilization of the nation's production capacity grew from 74.6% to 75.2%. The latter is at its highest level since COVID-19 made landfall in the U.S., and the former is back en route to its best levels since then. The directions here are more important than the absolute levels.
Capacity Utilization and Industrial Productivity Charts

Source: Federal Reserve, TradeStation
Factories may still be picking up steam, but consumers are holding off. Retail sales fell last month, by quite a bit. Granted, the comparison wasn't exactly fair. April's retail spending was up enormously, spurred by stimulus checks and the reopening of America now that vaccines are getting traction. Even so, the sudden slowdown is a bit alarming. We need to rev the engines here, so to speak.
Retail Sales Charts

Source: Census Bureau, TradeStation
Finally (and in the same vein), consumers are paring back their purchases of homes. High prices may have something to do with it, but regardless, a frenzied real estate market bumped into a headwind last month with building permits contracting from April's levels and housing starts only ticking a bit higher... and falling short of expectations. This the second month out of the past three that permits have pared back.
Housing Starts and Building Permits Charts

Source: Census Bureau, TradeStation
It's not a full-blown problem yet, but a couple more months like this and it could be.
Everything else is on the grid.
Economic Report Calendar

Source: Briefing.com
This week looks pretty busy, but it's not quite as chock-full as it seems on the surface. The only items of real interest are Tuesday's existing home sales report and Wednesday's new home sales figures. Not surprisingly, economists are predicting a modest contraction on both fronts. Again, high prices have become downright unaffordable for some, exacerbated by a sheer lack of supply in the shadow of soaring costs of building materials.
New and Existing Home Sales Charts
Source: National Association of Realtors and Census Bureau, TradeStation
Stock Market Index Analysis
We'll kick this week's analysis off with a detailed look at the daily chart of the S&P 500, as this is where the most troubling red flag is waving. For the first time in months, none of the index's most important technical support lines kept it propped up. Not only was Friday's close below the 50-day moving average line (purple), the pullback pulled the S&P 500 under straight-line support (purple, dashed) that connects all the major lows going back to October. [All the instances where these floors acted as support are highlighted in yellow.]
S&P 500 Daily Chart, with VIX and Volume

Source: TradeNavigator
It's not an insurmountable challenge. Friday's bearish gap left behind at the open beckons the market higher, and the S&P 500 is still above all of its longer-term moving average lines like the 100-day line (gray) and the 200-day line (green). The bigger-picture undertow is still bullish. Indeed, the NASDAQ Composite is still above all of its key moving average lines -- short-term and long-term -- seemingly unfazed by last week's selling.
NASDAQ Composite Daily Chart, with VXN

Source: TradeNavigator
Given that the composite is predominately made up of the market's most popular technology names, this resilience seemingly speaks volumes about the market's overall strength. Not only are investors not seeking out "safe" blue chip names, they're shunning them to continue buying the market's more aggressive offerings. The Dow Jones Industrial Average fell even more than the S&P 500 did last week, losing 3.4% of its value to close under its 20-day and 50-day moving average lines.
Dow Jones Industrial Average Daily Chart, with Volume
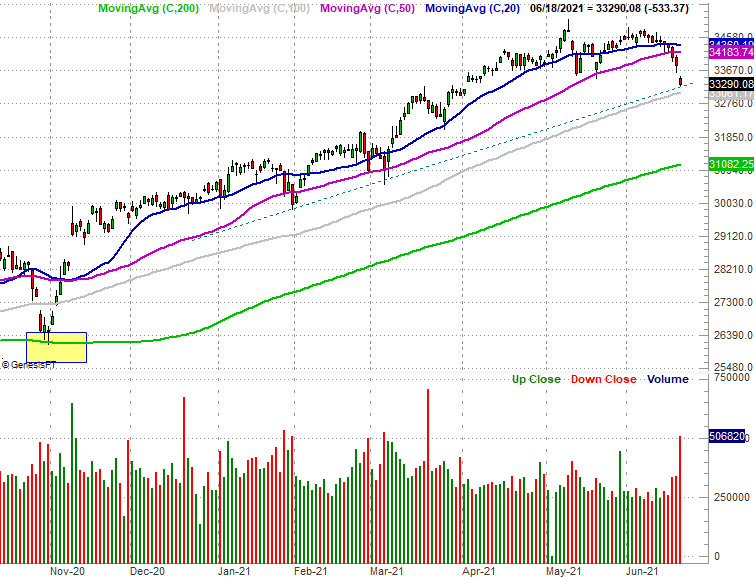
Source: TradeNavigator
The funny thing is, small cap stocks (as a whole, including the aggressive and risky ones that speculators love) also fell a lot last week. The Russell 2000 tumbled 4.2% over the course of the past five trading days, pulling under its 20-day and 50-day moving average lines as well.
Russell 2000 Daily Chart, with Volume
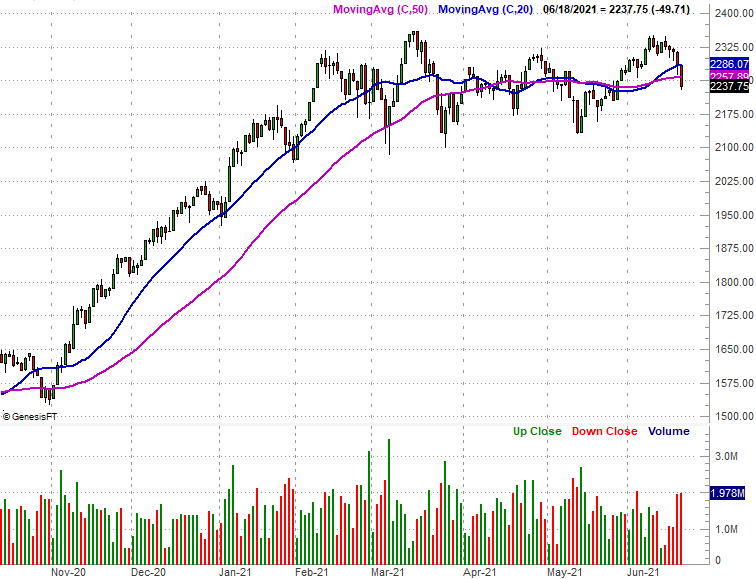
Source: TradeNavigator
In short, the NASDAQ is the only index that held up last week, and even then that strength was less than ideal. A closer inspection of its leaders and laggards reveals that only its very biggest and best-known names -- like the FANG stocks -- held their ground.
What's happening? Simply put, rather than the typical "flight to safety" that involves shedding technology and discretionary names and replacing them with reliable stocks like utilities and consumer staples, traders appear to be viewing companies like Alphabet, Amazon, and Apple as the safer names that will hold up should the market's budding weakness continue to gel. The rationale holds a fair amount of water, but these top tickers alone can't hold the market up forever. Most stocks are losing ground, and doing so at a time of year (and against a backdrop) where a correction is still the higher-odds outcome. There's just no reason yet to believe this is how things are panning out.
As for your marching orders this week though, sit tight for now. Friday's bearish open left behind several gaps that now need to be filled, and the prospects of a bounce were made even greater by the rest of the selling that took shape later in the session. There's a possibility we'll see a dead cat bounce that reignites the bigger uptrend. We don't want to make any judgment calls until we can see if such a bounce is built to last.
Mostly though, we're eyeing the volatility indices and the NASDAQ Composite's technical ceiling at 14,189, which was suspiciously tested but not cleared last week. The NASDAQ will need to clear that ceiling first before we can start making new bullish bets. In the meantime, notice the VIX and the VXN started to push up and off recent lows last week. They're both still miles from breaking their bigger-picture downtrends, however, framed by falling solid blue lines on their chart below.
S&P 500 Volatility Index and NASDAQ Volatility Index Charts

Source: TradeNavigator
Until these ceilings are hurdled, the bigger trend remains bullish even if the NASDAQ is currently on the wrong side of its horizontal ceiling.