Weekly Market Outlook - The Market Bounces on Cue, But Don't Read Too Much Into It

The seven-week losing streak was finally snapped... in spades. The S&P 500 bounced an impressive 6.6% last week, closing at its highest level seen since late April. This is what a reversal would look like at its inception.
Don't be too quick to jump to such a conclusion though. Last week's strength was almost too good to be true, and rooted in the sheer severity of the pullback suffered since the beginning of last month. And, being a prospective dead-cat bounce, the effort could soon fall apart and lead back into a pullback. One key level remains a make-or-break line in the sand.
We'll look at that technical floor in a moment. First, let's run through last week's biggest economic announcements and preview what's coming this week.
Economic Data Analysis
While there was quite a bit of economic news from last week to sift though, there was only one item worth charting. That's April's sales of news homes, following up the previous week's look at sales of existing homes. Although it's yet to hit prices, total purchase activity is clearly hitting a wall. New home sales fell to an annualized pace of 591,000, well short of the 750,000 that economists were looking for, and reaching the lowest level in a couple of years. In fact, that figure almost fell under the pace of 580,000 seen in April of 2020, when lockdowns swept across the nation. Adding insult to injury, March's original figure of 763,000 was dialed back to 709,000.
Home Sales Charts
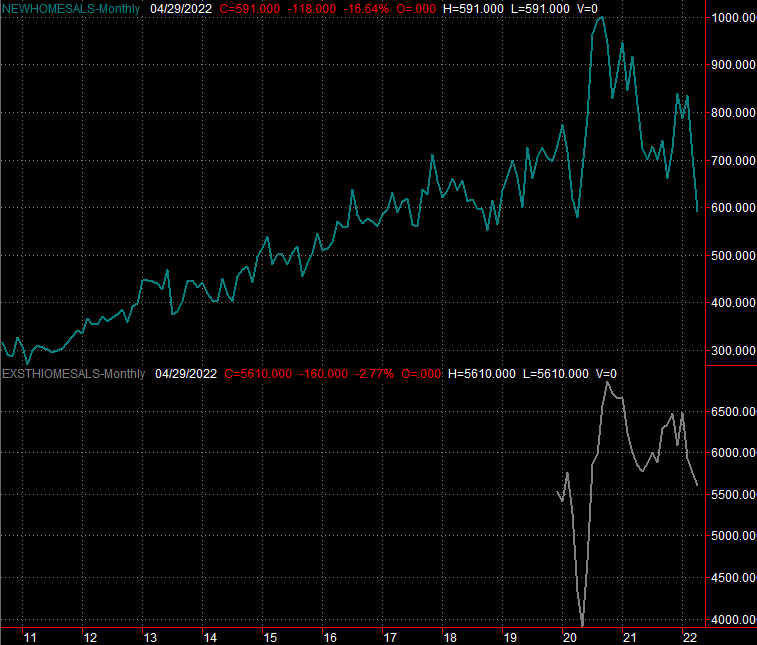
Source: National Association of Realtors, Census Bureau, TradeStation
Part of the issue may be limited inventory, or in this case, homebuilders not building enough new houses to keep up with actual demand. But, that's not the crux of the issue. Inventories actually ticked higher last month, to a
As the chart also shows us, sales of existing homes didn't fall by nearly as much last month. They did fall, however.
The only other item from last week really worth mentioning is the third and final assessment of May's University of Michigan Sentiment Index. It edged a little higher from the second guess, though at 58.4, that's still less than April's 65.2, and at the lowest level seen since 2011.
Consumer Sentiment Charts
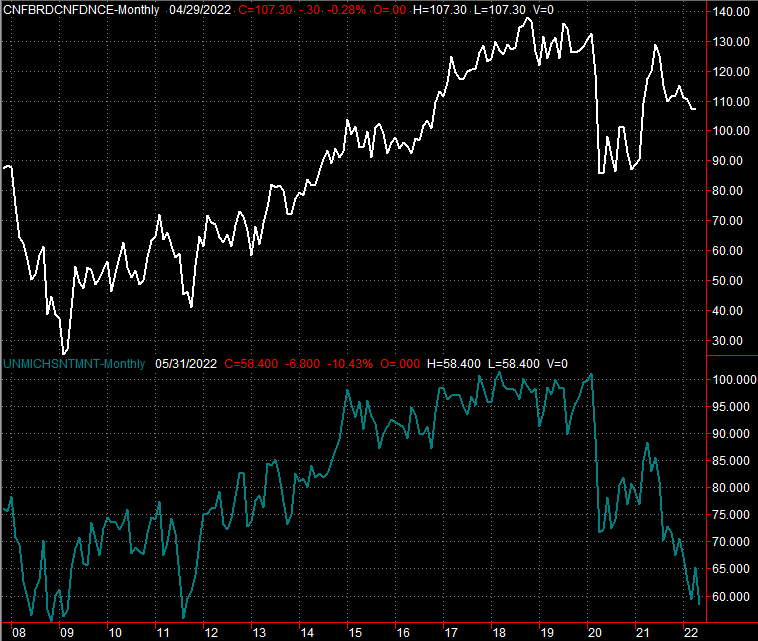
Source: University of Michigan, Conference Board, TradeStation
The Conference Board's report of consumer sentiment isn't due until this week, and although its different means of measurement means it's not cratering the same way the University of Michigan's sentiment index is, economists are still calling for a move to the lowest level seen in months.
Simply put, people are feeling pretty worried and stressed out. Or they were, anyway. Investors clearly had a change of heart for the better last week, although it remains to be seen how permanent that move is. (More on that in a moment.)
Everything else is on the grid.
Economic Calendar

Source: Briefing.com
The last piece of the real estate puzzle will be laid this week, on Tuesday, when we get the S&P Case-Shiller Home Price Index as well as the FHFA Housing Price Index. Both are only for March, before purchase activity and buying intent really started to crater. That's why economists expect more of the same outrageous price increases. This may be the last month we see this sort of pricing power though, if we still see it.
Housing Price Charts
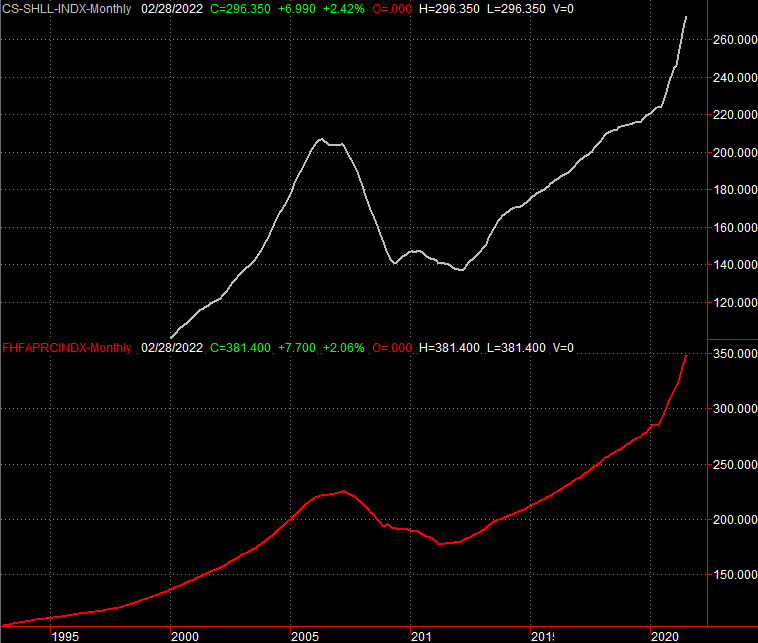
Source: Standard & Poor's, FHFA, TradeStation
On Wednesday we'll hear May's ISM Manufacturing Index update, followed by the ISM Services Index report on Friday. Economists believe both peeled back a bit for the month, although each remains well above the 50 level that delineates growth and contraction. Just note that both indices are in decline right now, unable to maintain the surge levels seen once the pandemic started to ease.
ISM Index Charts
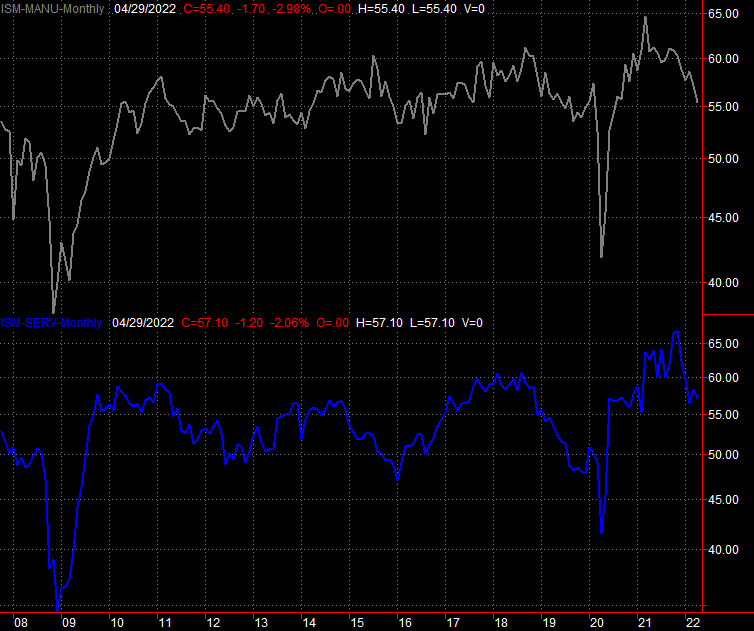
Source: Institute of Supply Management, TradeStation
This coming week's biggie, of course, is Friday's jobs report for May. Forecasters expect to see the next creation of 325,000 jobs, which should be just enough to push the unemployment rate down from 3.6% to 3.5%.
Payroll Growth and Unemployment Rate Charts

Source: Bureau of Labor Statistics, TradeStation
It almost goes without saying that any wide variance between expectations and the actual jobs figure has the potential to really move the market, for better or worse depending on which direction the missed target lies.
Stock Market Index Analysis
This week's analysis gets going with a look at the weekly chart of the S&P 500, just to illustrate how dramatic last week's gain was. The 6.6% bounce took a big bite out of the 14.2% pullback suffered over the course of the previous seven weeks.
S&P 500 Weekly Chart, with VIX and Volume
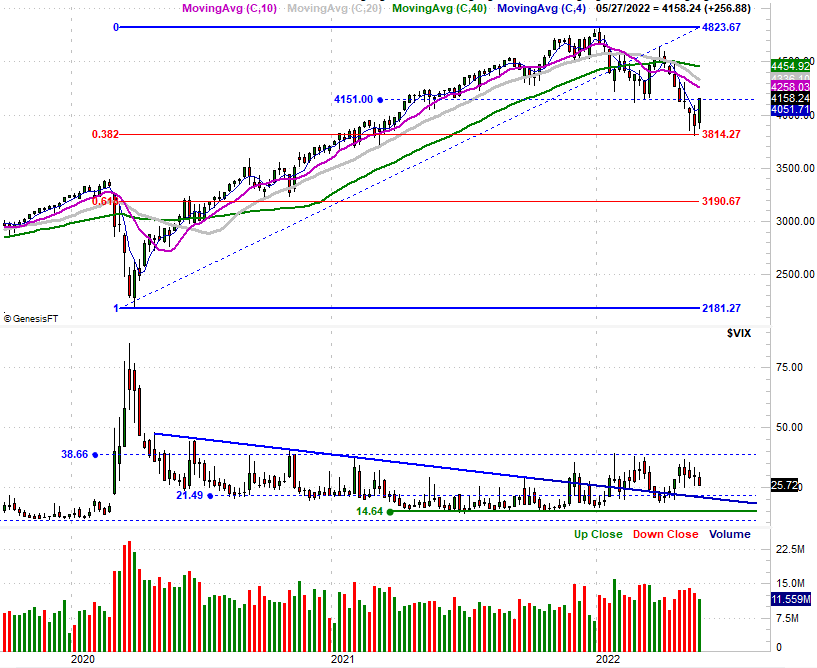
Source: TradeNavigator
That's not the only thing worth noting of the weekly chart, however. It's not even the most important thing either. More curious about this chart is where the big low ended up being made... at the 38.2% Fibonacci retracement line at 3814 (a 38.2% retracement of the early-2020 low and January's high). This is where you'd expect the bulls to make their stand.
Just don't read too much into the move -- nor count on being the beginning of something more -- for a couple of reasons.
One of those reasons is, last week may have been nothing more than a dead-cat bounce stemming from the sheer scope of the selloff seen since early April. It's tough to keep that much selling pressure up and uninterrupted for that long. Last week's pop may only be a quick release of a pressure valve, so to speak. That doesn't mean it's going anywhere. Like we said, the Fibonacci retracement line is where you'd expect the bulls to make their stand. That doesn't mean that stand will be successful, however.
Another reason we don't want to blindly bet on last week being the first weekly gain of a long series of them is the lack of volume behind the move.
There is one thing on the weekly chart working in the market's favor. That's the S&P 500's Volatility Index, or VIX, which has been slowly edging lower for four weeks now including last week. Although we'd rather see a sharp upward spike from the VIX to signal a market bottom, we don't always get them the way we want them.
Here's the daily chart of the S&P 500, for some detail.
S&P 500 Daily Chart, with VIX and Volume
Source: TradeNavigator
That's impressive to say the least, and to its credit, the index crossed back above its 20-day moving average line (blue) at 4036. That's something. The daily chart also shows is the VIX is easing into a new downtrend. Again though, the volume problem is clear, and even clearer on the daily chart. Not only was the bullish volume weak all week long, but falling the higher the index moved.
The daily chart of the NASDAQ Composite looks pretty similar, moving back above its 20-day moving average line after finding a floor at 11,069. Its volatility index is edging downward as well.
NASDAQ Composite Daily Chart, with VXN
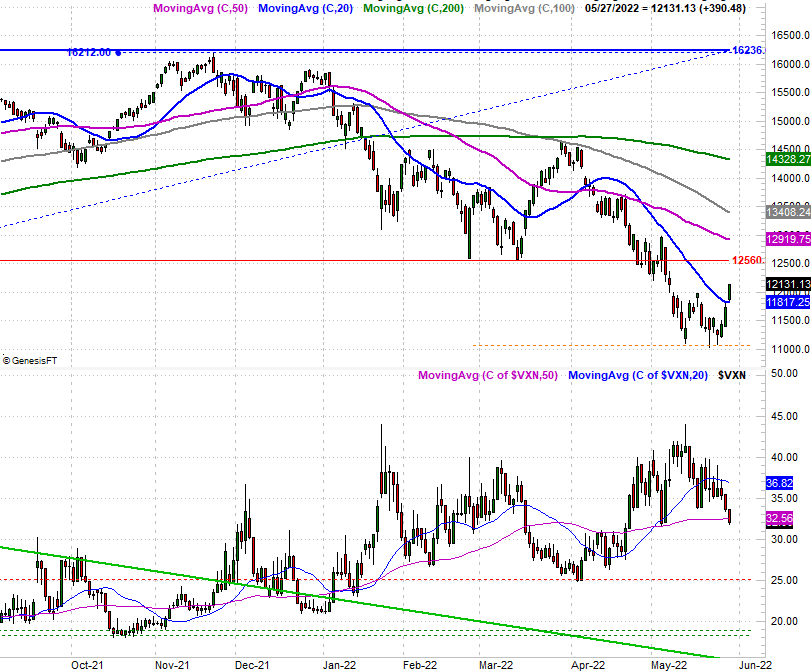
Source: TradeNavigator
This may be a scenario where, while you want to keep an eye on all the charts, you pay even closer attention to headlines, rhetoric, and the market's changing temperature. Last week was unusually bullish... so much so that there may be little room left for more immediate upside. That's the litmus test: How's this rally going to respond when truly tested? Our guess is we'll see a little profit-taking this week. it's not clear if that will create enough bearish momentum to completely pull the rug out from underneath the market again. Be patient.
Whatever's in the cards, the indices did us a huge favor last week. That favor is confirming where the most important technical floors are right now. That's last week's lows, which largely align with lows hit early on in the month.