Weekly Market Outlook - The Dead Cat Bounce Didn't Get Stocks Back Over the Hump
As expected, stocks bounced back hard from Monday's meltdown. As was feared, however, the rebound effort didn't actually get the market back above some key lines in the sand.
That could still happen, mind you. As is the case with breakdowns, rebounds can be more of a process than an event. A recovery could take two or three tries before it takes hold or finally buckles for good. In the meantime stocks are stuck in limbo. The good news is, the market's most important floors and ceiling from here are pretty well defined.
We'll take a look at those lines in some detail below, as always. First though, let's recap last week's most important economic news and preview what's on the schedule for this week.
Economic Data Analysis
Last week's big news of course came from the Federal Reserve's Open Market Committee. As expected, the FOMC opted not to raise interest rates -- by upping the Fed Funds Rate -- when it had a scheduled opportunity to do, but rate hikes are indeed on the radar. About half of the committee now anticipates a rate hike coming next year, accelerating the likely timeframe for the next hike coming in 2023. Most of this committee believes two additional increases are also in the cards for 2023. Bond-buying will also taper off next year.
All of it says the Federal Reserve's governors see (and are worried about) inflation.
Demand for homes is fading from last year's frenzy prompted by low interest rates. But, it's still rather brisk compared to long-term norms. The number of building permits issued last month grew from 1.63 million to 1.73 million, and the number of news homes started grew form 1.55 million to 1.62 million.
Building Permits and Housing Starts Charts
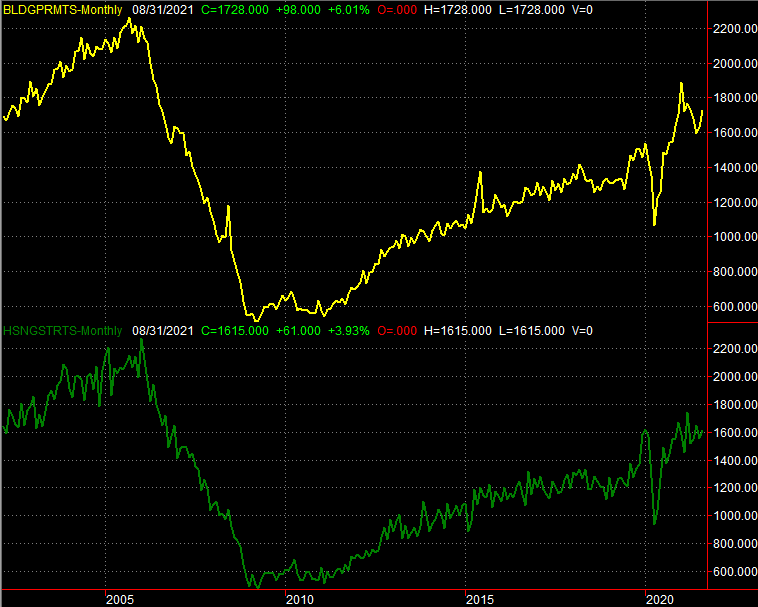
Source: Bureau of Labor Statistics, TradeStation
Those upticks rekindle a solid growth streak, but curiously, home sales aren't recovering nearly as well. Sales of new homes in fact only improved slightly from a multi-month low, reaching a pace of 740,000. And, sales of existing homes actually fell back toward multi-month lows in September, to 5.88 million. These tepid reading contrast a bit with home sales numbers, calling into question the true strength of the real estate market.
New and Existing Home Sales Charts
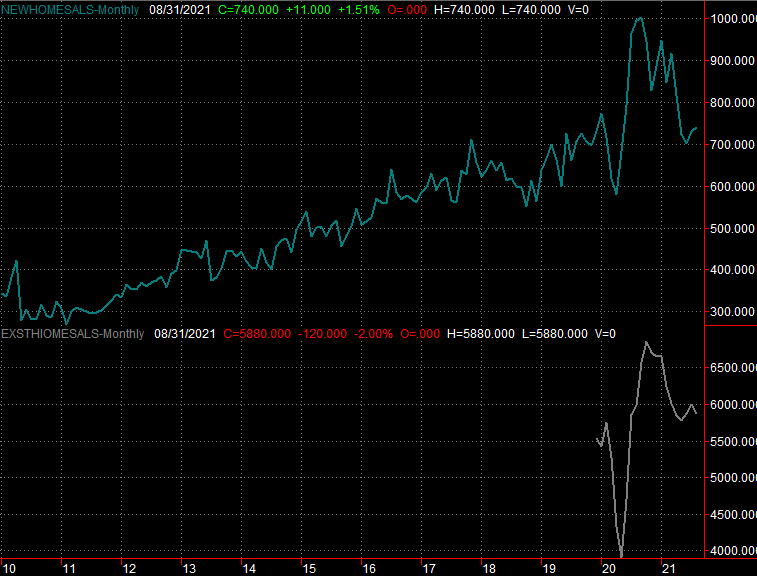
Source: Bureau of Labor Statistics, TradeStation
Everything else is on the grid.
Economic Calendar
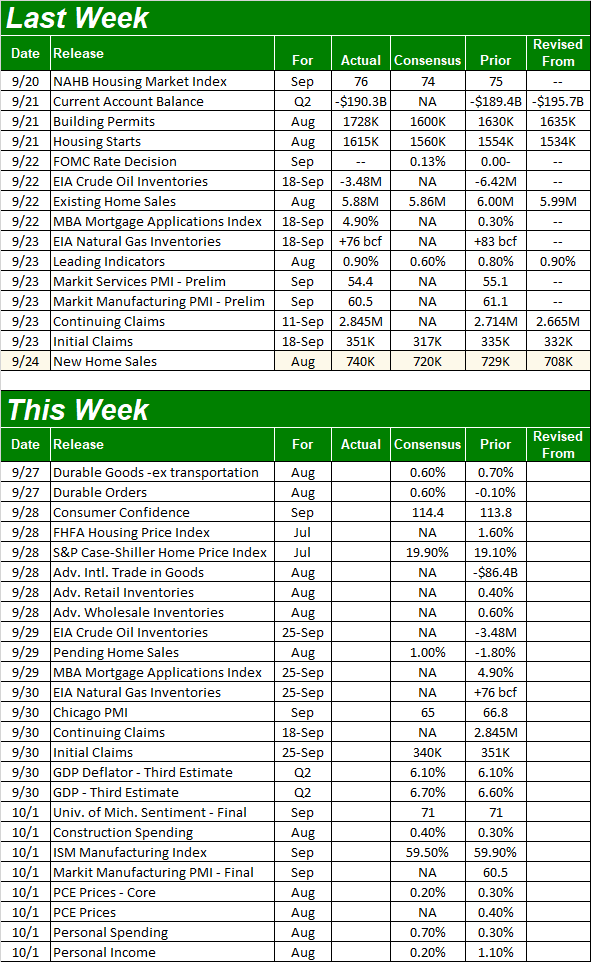
Source: Briefing.com
We'll round out the look at the real estate picture this week with home price data. The S&P Case-Shiller Home Price Index is due on Tuesday, along with the FHFA Housing Price Index. Both are projected to rise deeper into record territory.
Home Price Charts
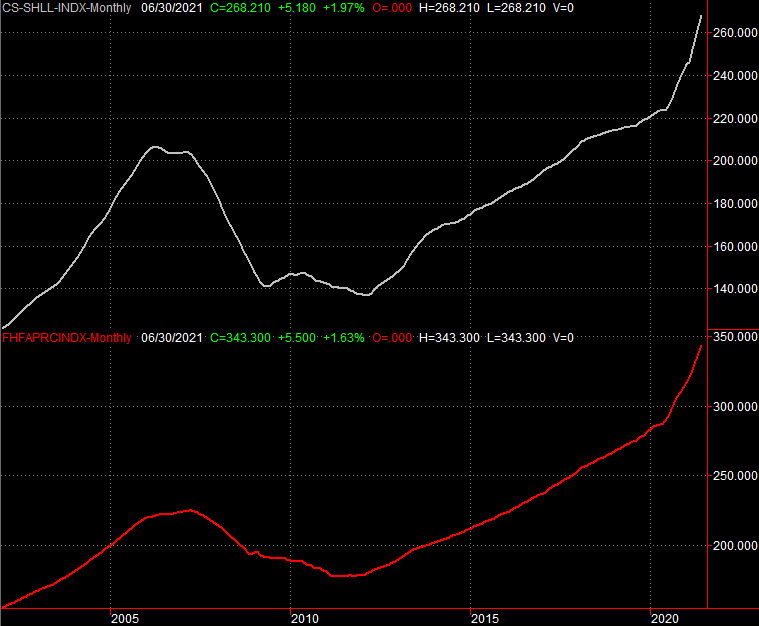
Source: Standard & Poor's, FHFA, TradeStation
Do bear in mind that the home-pricing reports reflect July's market and not August's; much has happened during the delay. Either way, home pricing is the one piece of the real estate picture that's remained rock-solid. If it starts to wane, that could be a signal that the market's "innards" are starting to weaken.
It's also going to be a big week for consumer sentiment date. The Conference Board releases its consumer confidence figure on Tuesday, while the third and final look at the University of Michigan Sentiment reading for September is coming on Friday. Both fell quite a bit last month, with the University of Michigan plunging to multi-year lows. Economists are calling for a slight improvement this time around, which is arguably not enough.
Consumer Sentiment Charts
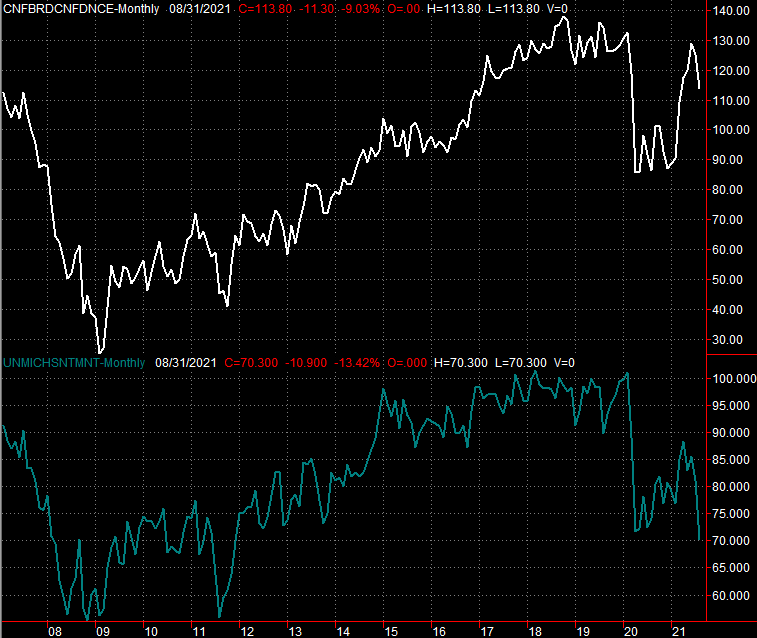
Source: University of Michigan, Conference Board, TradeStation
Finally, on Friday look for the ISM's Manufacturing Index; the services version of the index isn't coming until next week. Economists believe the number will ebb slightly, from 59.9 to 59.5. But, that's still above the critical 50 level, under which indicates contraction.
ISM Manufacturing and Services Index Charts
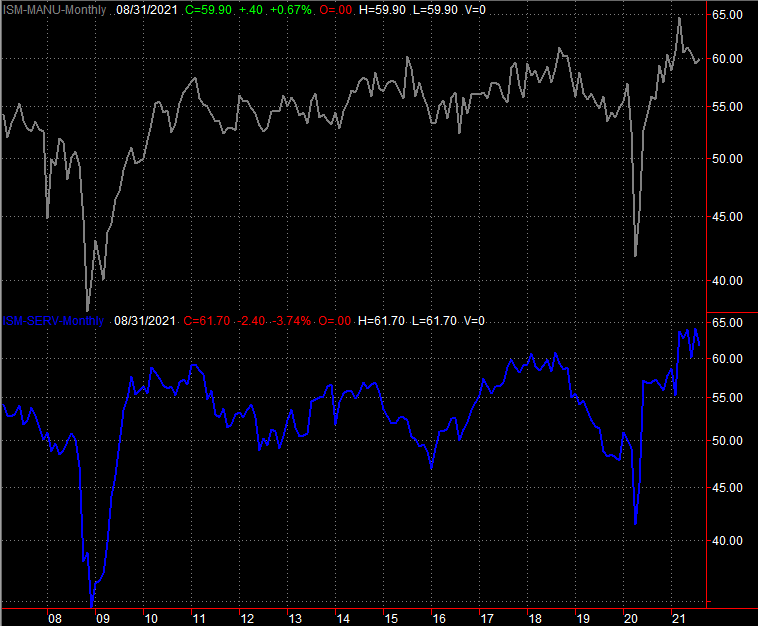
Source: Institute of Supply Management, TradeStation
Also note that we'll get the third and final estimate of Q2's GDP growth rate on Thursday, although forecasters don't expect a change from the second guess of 6.1%.
Stock Market Index Analysis
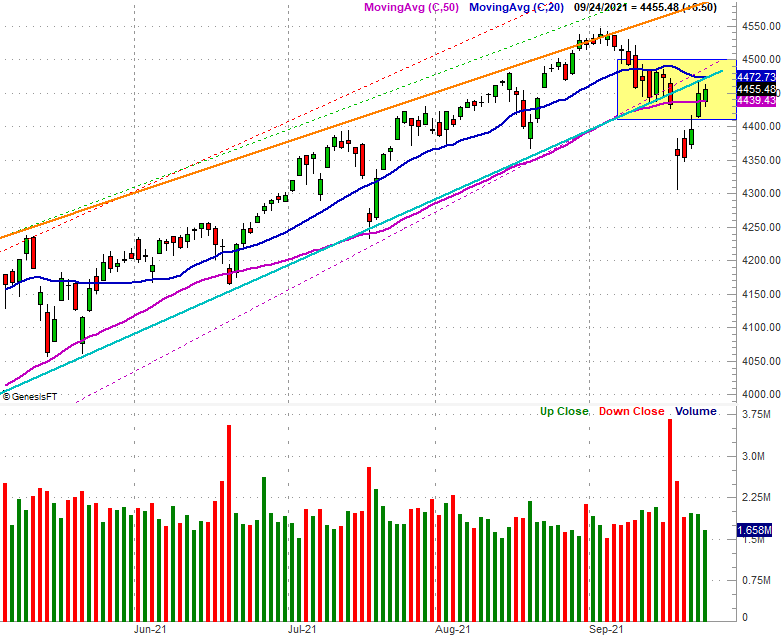
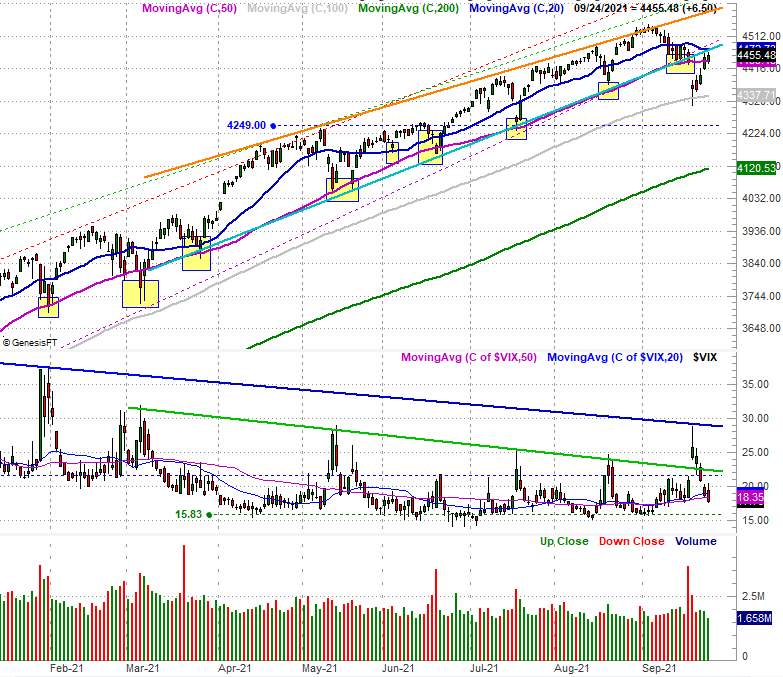
Once again we kick off this week's analysis with a zoomed-in look at the daily chart of the S&P 500. Monday's plunge (and gap) was harrowing, but as could have been expected, the market bounced back. Indeed, the S&P 500 even managed to move back above the 50-day moving average line (purple). The index didn't, however, push its way back above the 20-day moving average line (dark blue), nor did it crawl back above the long-term support line (light blue) that had been prodding it higher since early this year. Also notice the volume behind the bullish last three days of last week wasn't exactly strong.
S&P 500 Daily Chart, with Volume
Source: TradeNavigator
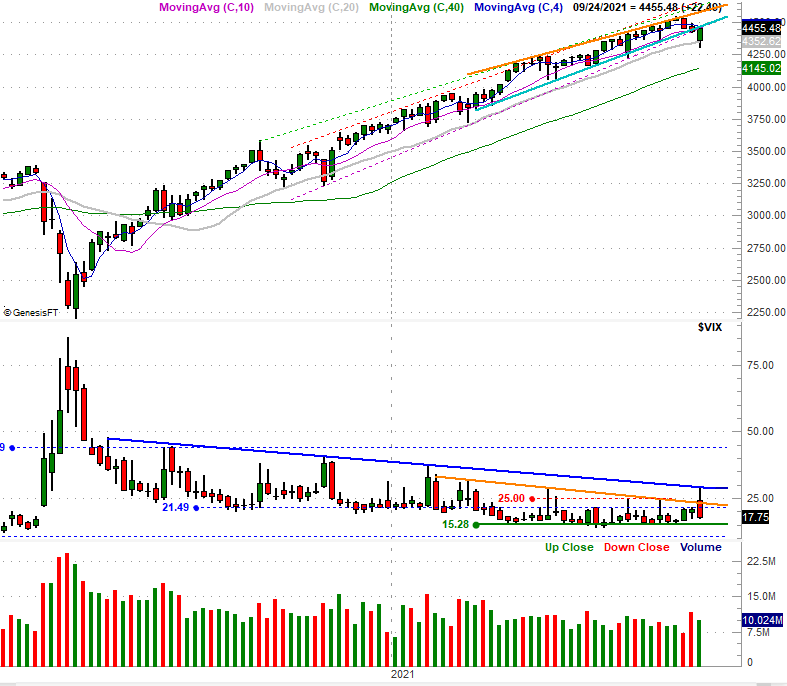
Here's the same daily chart, but from a distance, and with the volatility index (VIX) added. From this perspective we can see just how much of a game-changer the pullback suffered over the course of the past three weeks is. We can also see that the VIX is indeed behaving in step with the S&P 500 itself. The VIX reversed after hitting a key technical ceiling (dark blue) at the same time the S&P 500 brushed the 100-day moving average line (gray). Both are major lines in the sand; we could have expected reversals there.
S&P 500 Daily Chart, with VIX and Volume
Source: TradeNavigator
Still, the index hasn't yet bounced back to being on the bullish side of the fence.
Here's the weekly chart of the S&P 500 with the same lines in the sand plotted. There's nothing else to add to the discussion here. The only reason this bigger-picture view is so interesting is the perspective it adds to the matter. Last week's tumble clearly and truly shook things up for stocks, for the worst. We're in somewhat uncharted territory here now that the S&P 500 has been knocked out of a well-defined trading range. The VIX's encounter with its technical ceiling also becomes more important with this view; that resistance extends all the way back to June of last year.
S&P 500 Weekly Chart, with VIX and Volume
Source: TradeNavigator
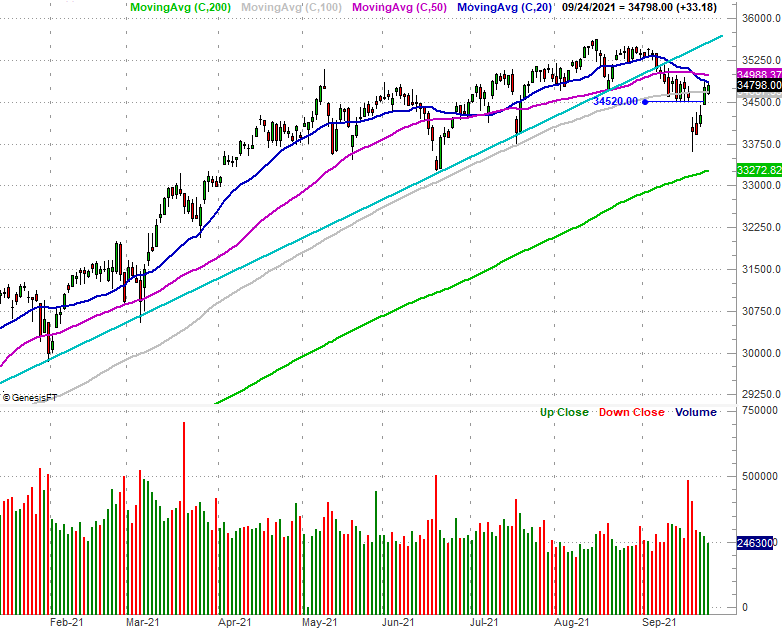
And the S&P 500 isn't the only index on the wrong side of the table here. The Dow Jones Industrial Average is also still below its 20-day moving average line (dark blue) even though it tested that resistance on Thursday and Friday. It's also worth mentioning the 20-day and 50-day moving average lines (blue and purple, respectively) are on the verge of breaking below the 100-day line (gray) at 34,713. The buying volume the last three days of last week -- the bullish days -- was also tepid.
Dow Jones Industrial Average Daily Chart, with Volume
Source: TradeNavigator
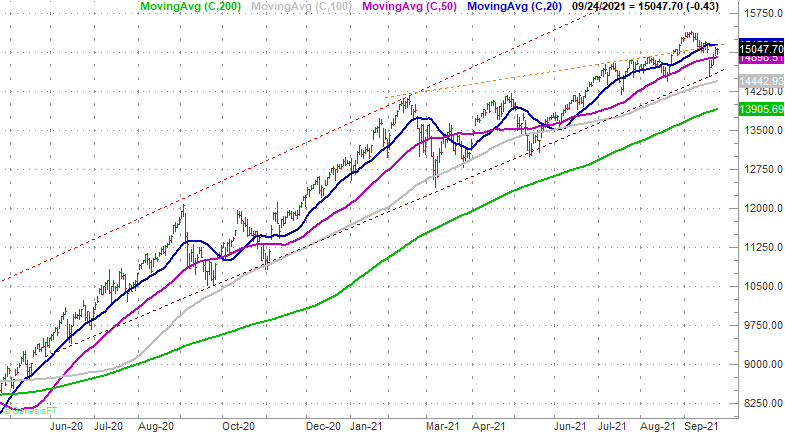
The NASDAQ Composite, however, is an exception to this theme. It somehow found support at a technical floor that's been in place and nudging the index upward since June of last year, with the last time support was found being last week's low. That bounce pushed the composite back above the 50-day moving average line, and though it didn't break back above the 20-day line, that feat is within reach. The momentum here is still bullish too, and that's key. See, the NASDAQ tends to lead the overall market, whether that's higher or lower. The NASDAQ remains in bullish mode despite all the recent turbulence.
NASDAQ Composite Daily Chart
Source: TradeNavigator
The right move to make here is... doing nothing, and just waiting.
Remember, we could have expected a bullish bounce after Monday's drubbing. We got it, and at least for the NASDAQ, no real damage was done. The potential for a major pullback is still clearly in place though, and somehow we seem due. This week is a big one as it will really force the recent buyers to make a major decision. That is, are they going keep buying enough to get stocks over tougher hurdles to clear. This bullish effort could still crumble and devolve back into a better-paced, more sustainable selloff.
The good news is, the make-or-break lines are clearer and firmer now than they were just a couple of weeks ago.