Weekly Market Outlook - The Bulls Sidestep Trouble, But It Ain't Over Yet
 After a couple of tough weeks (and a bad start to last week), the bulls changed their mind again. The S&P 500 managed to reverse back into a bullish mood again, and did so in pretty decisive fashion. Most of the indices even managed to cross back above pivotal moving average lines.
We have to respect the clues as they stand. We also have to respect the fact that the market found support in more than one place, and in all the right places. Still, in light of the lack of volume we saw last week behind the gain - maybe it was just the holiday - we have to be prepared for the possibility that things aren't quite as bullish as they seem in the surface.
We'll explain what that means below, after a run-down of last week's economic news and a preview of this week's economic reports.
Economic Data
Despite the trading week being cut short by a day and a half due to the 4th of July break, we didn't have any less economic news to sift through. We just had to push through it in less time. As always (and in the interest of time), we'll limit ourselves to the highlights.
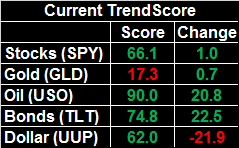
The party started Monday morning with the ISM Manufacturing Index, though that was followed on Thursday with the ISM Services Index. Both were up, and both were better than expected. At least from the perspective of corporate managers, things are humming.
ISM Index Charts
Source: Thomson Reuters
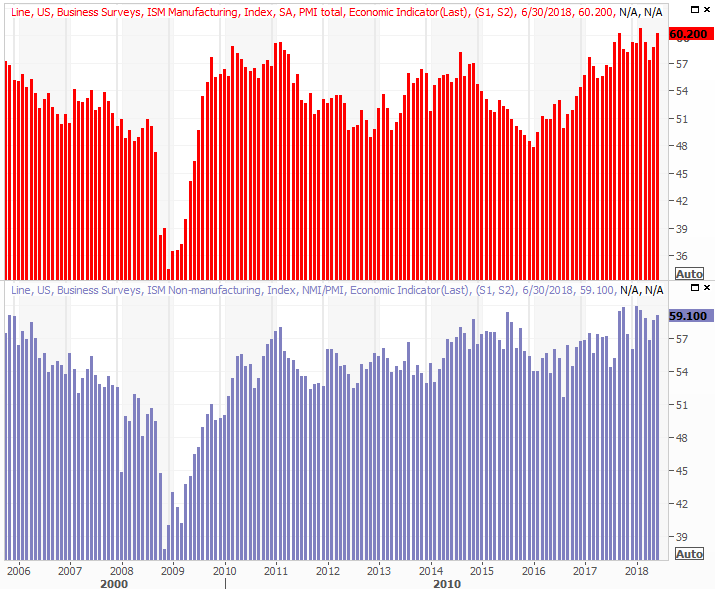
We also got an encouraging report from the carmakers... at least to the extent we're still getting firm numbers from the major manufacturers. After slumping for several months in a row, car sales and truck sales both ticked higher, pretty much in line with expectations.
Auto Sales Charts
Source: Thomson Reuters
We could use a couple more good months on the automobile sales front, but this is a healthy showing (and a good start).
Last week's biggie, of course, was June's jobs report. We took a detailed look at the website; the key data is enough for here and now to paint a picture. In short, though the unemployment rate ticked higher, from 3.8% to 4.0%, we managed to add 213,000 new jobs. The total number of people with a job has never been higher.
Unemployment Rate and Payroll Growth Charts
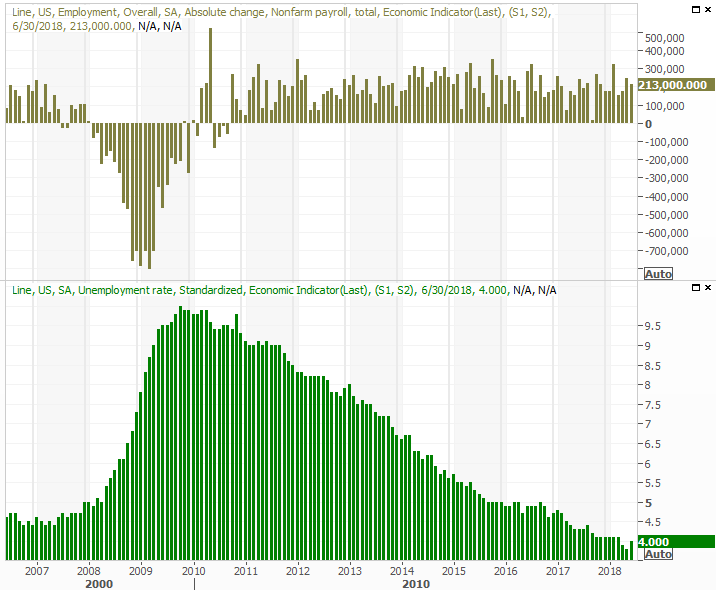
Source: Thomson Reuters
That's a good reading, though arguably still understates how healthy - without being overheated - the jobs market is. Read more at the site by clicking here: https://www.bigtrends.com/education/markets/the-june-jobs-report-was-a-goldilocks-event
Everything else is on the grid.
Economic Calendar
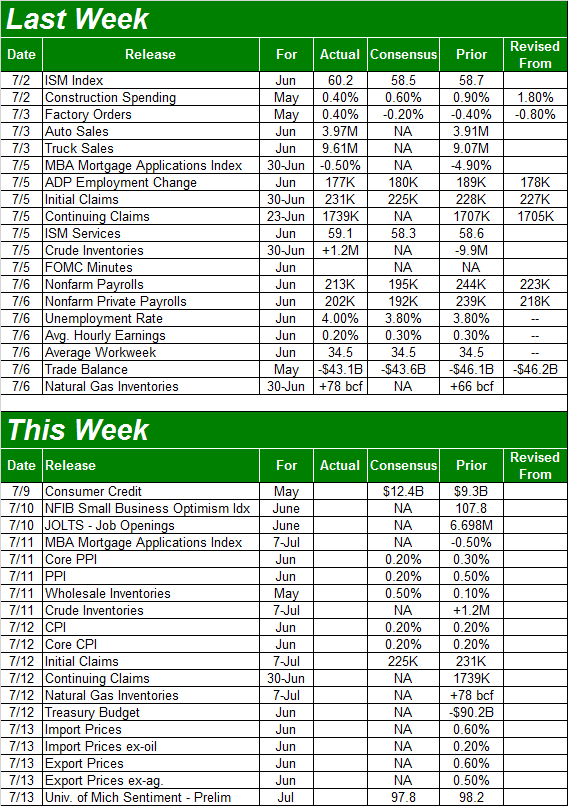
Source: Briefing.com
This week is going to be fairly busy, though not much of it is going to be terribly hard hitting.
The big Kahuna is going to be the look at June's inflation rate. It's still there, but economists think it will remain time. Consumer inflation is expected to hold steady at 0.2% month-to-month, and producer price growth is expected to peel back from 0.3% to 0.2%. And, given how muted wage growth was last month, it's not a stretch to believe inflation will remain in check. That leaves the Federal Reserve plenty of wiggle room, not forcing it to get too aggressive with interest rate hikes.
Consumer and Producer Inflation Charts
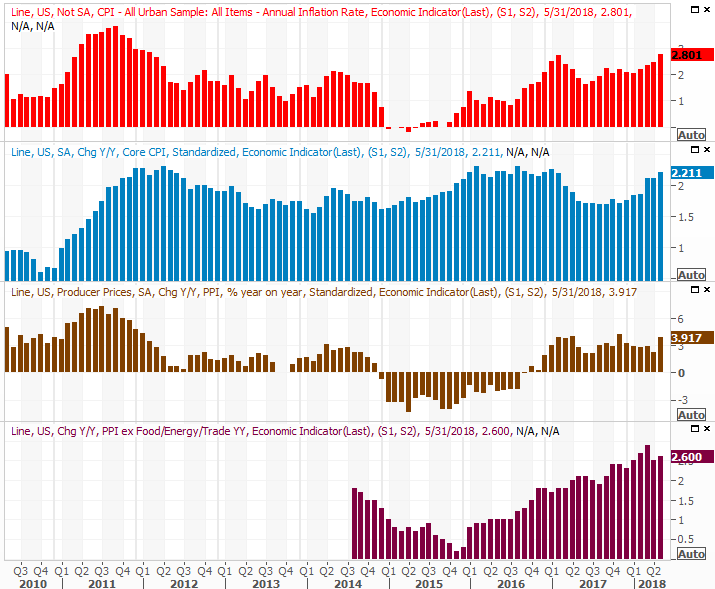
Source: Thomson Reuters
Finally, keep an eye out for Wednesday's crude oil stockpile report. Last week's levels came in even with the prior week's, but they're still trending lower. It's still a measure we want to keep close tabs on though, as we're not entirely convinced the industry still has enough discipline to keep a lid on production... production that could ultimately undercut the prices that have been so beneficial of late.
Crude Oil and Natural Gas Stockpile Charts
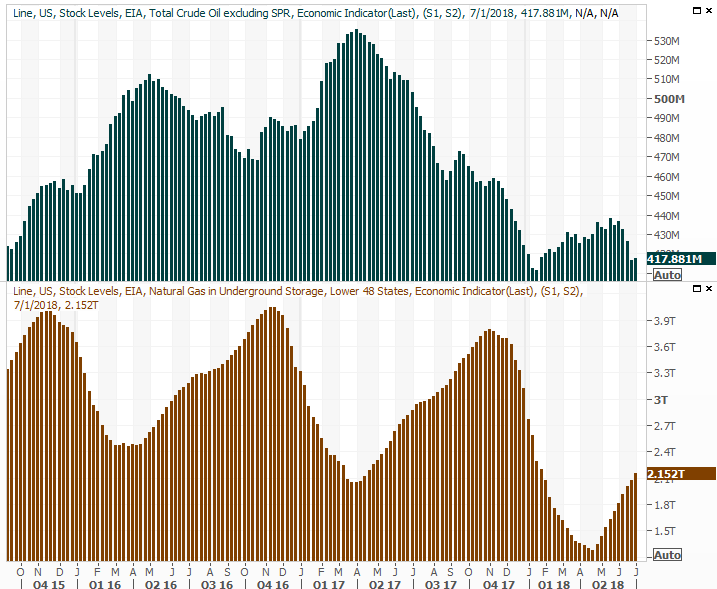
Source: Thomson Reuters
Just bear in mind that there's a lag time between crude extraction and crude storage. It's possible there's more oil already "in the system" that's not been tucked away for storage yet. It's just a multi-faceted scenario. This is only one aspect of it.
As it stands right now though, the picture for oil is bullish.
Index Analysis
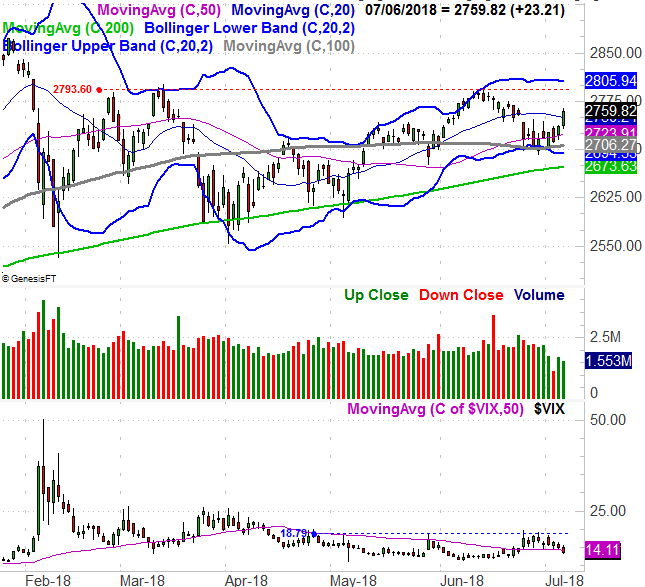
Whatever had been holding investors back was wiped away on Friday. The S&P 500 gained 23.21 points that day (0.85%), underscoring a very modest turnaround effort that had taken shape over the course the earlier part of the week.
It was chatter that the brewing trade wouldn't escalate that flipped the switch in investors' heads... an irony, considering many of the new tariffs President Trump had created went into effect that very day. China responded with some new ones of its own. But, "it could have been worse."
Helping the rebound effort, though, was clear support at two very important technical lines. Indeed, the bounce may have been going to materialize anyway, regardless of what happened on the tariff front.
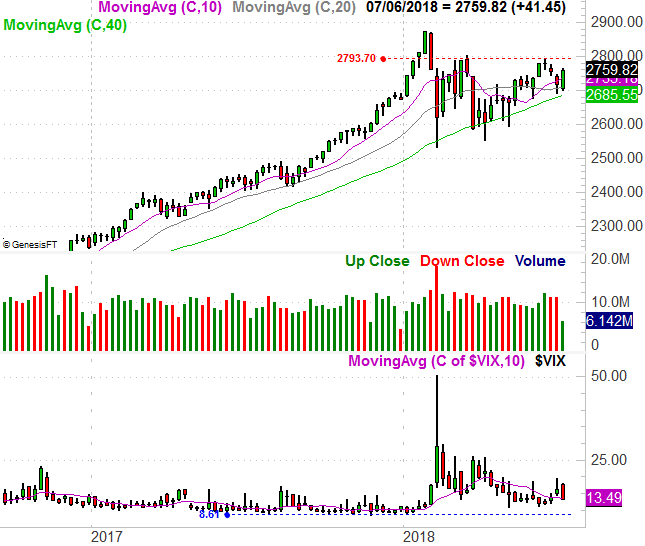
One of those technical lines is the 100-day moving average line, which is gray on our daily chart of the S&P 500 below. The other is the lower Bollinger band (thin, blue). Both have been floors of late, and if the bulls were going to muster a rally, this is arguably the best place to take that shot.
S&P 500 Daily Chart, with VIX and Volume
Source: TradeNavigator
Be careful though. There are a lot of things that are less than thrilling.
One of them is the fact that last week's bullishness unfurled on very weak (and increasingly weak) volume... meaning it wasn't necessarily a majority opinion. Yes, the holiday had a lot to do with that muted interest. Just for the record though, the 4th of July week is historically a good one no matter what. Last week's gains may have been rooted in little more than American euphoria.
There's also the not-so-small reality that even with the big gain on Friday, the S&P 500 has yet to move back above the technical ceiling at 2793. Until that happens, anything could still happen.
Nevertheless, the overall trend remains bullish, as is made clear by the weekly chart of the S&P 500.
S&P 500 Weekly Chart, with VIX and Volume
Source: TradeNavigator
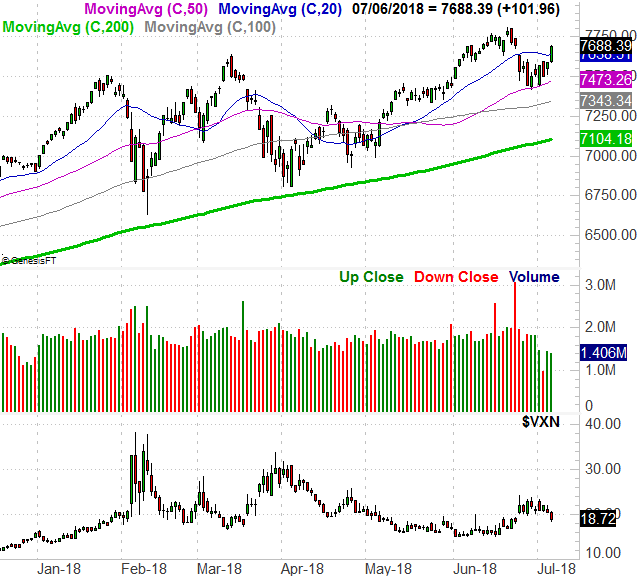
Underscoring this bullishness is a relatively bigger gain, and relatively more bullishness, from the NASDAQ Composite.
The NASDAQ leads the way, both up and down. If it's doing better than the S&P 500, it's because traders are in a bullish mood. They tend to act and behave accordingly. Ergo, in light of the fact that the tech-heavy NASDAQ is back within reach of record highs, there's good reason to think more of the same is in the cards.
NASDAQ Composite Daily Chart, with VXN and Volume
Source: TradeNavigator
If there was ever a reason to be suspicious of the NASDAQ's outsized strength though, this is it.
The words "this time is different" are stunningly dangerous. Rarely is anything, in the end, wildly different. There is an unusual scenario in play right now, however, that should give traders pause about how long the NASDAQ can continue blazing a trail. That is, of the stocks that are trading the most above their analysts targets, half of them are technology companies, and half of them are NASDAQ-listed stocks.
That's concerning for the overall market, but in that the NASDAQ names are the most alarmingly overvalued names in the group of stocks that have exceeded their target prices, it leaves the composite more vulnerable to a pullback than the broad market is.
Let's also not forget that it's now been years since the market's suffered a cathartic, soul-cleansing pullback that shakes off all the dead weight and sets the stage for a more normal, prolonged advance... not that we can count on that happening anytime soon.
Bottom line? We'll acknowledge the bulls have the edge here. We'll also remind you, however, that the S&P 500 is just two or three bad days from breaking under the pivotal 200-day line. Keep your head on a swivel.