Weekly Market Outlook - The Bulls Shut the Bears Up Pretty Quickly
 Things were a bit hairy and scary on Wednesday and then Thursday of last week. But, the overbought market clearly wasn't ready to roll over just yet. A pretty respectable jobs report for April inspired renewed buying, pushing Friday's close to its second-best daily close ever for the S&P 500.
One day doesn't make or break a trend, and the market is still ripe for some profit-taking. But, that's been the case for a while now. It hasn't mattered yet.
We'll weigh the bullish and bearish arguments below, as always. First, however, let's recap last week's trove of economic announcements and preview this week's news. There was plenty more besides employment numbers.
Economic Data Analysis
The week was loaded; we'll have to limit our look to the highlights.
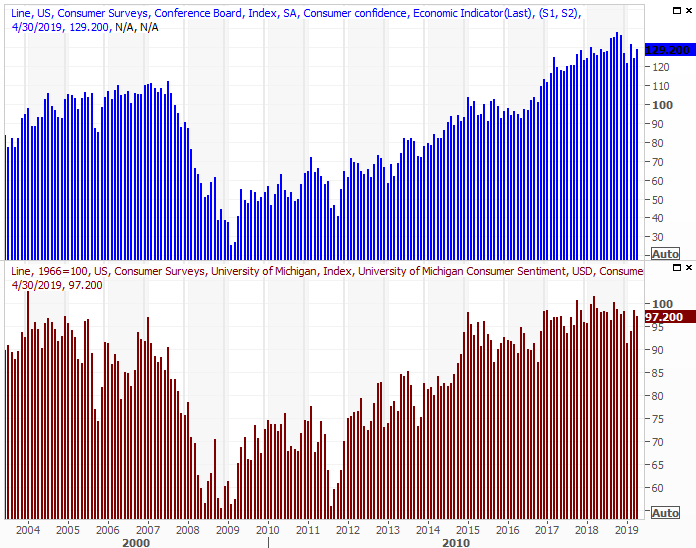
Consumer confidence is (still) solid, given Tuesday's look at April's consumer sentiment reading from the Conference Board. But, it's not as convincing as it was just a few months ago. The Conference Board said it was up last month, while the Michigan Sentiment Index fell just a bit. Both are more or less where they've been for months now though, which is a quiet concern in itself. The direction of the trend can mean a great deal.
Consumer Sentiment Charts
Source: Thomson Reuters
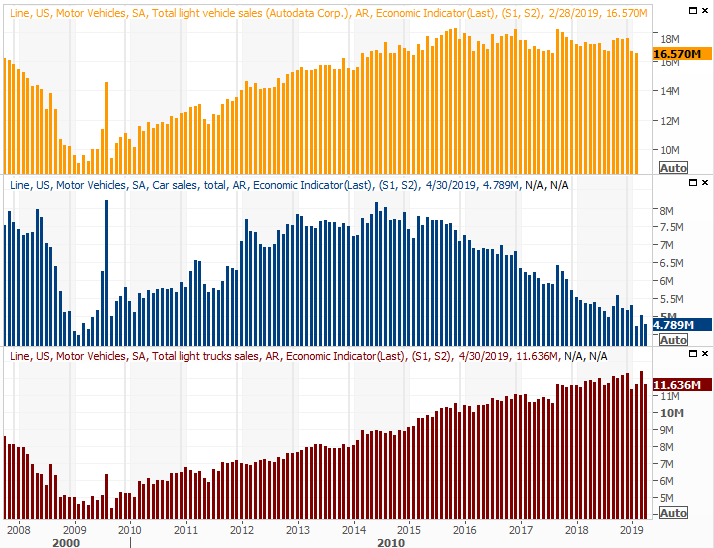
The really interesting stuff didn't start in earnest until Wednesday, with April's auto sales reports. Not surprisingly, the pace of purchases fell from March's figures, renewing a budding downtrend most carmakers can't afford to deal with right now.
Auto Sales Charts
Source: Thomson Reuters
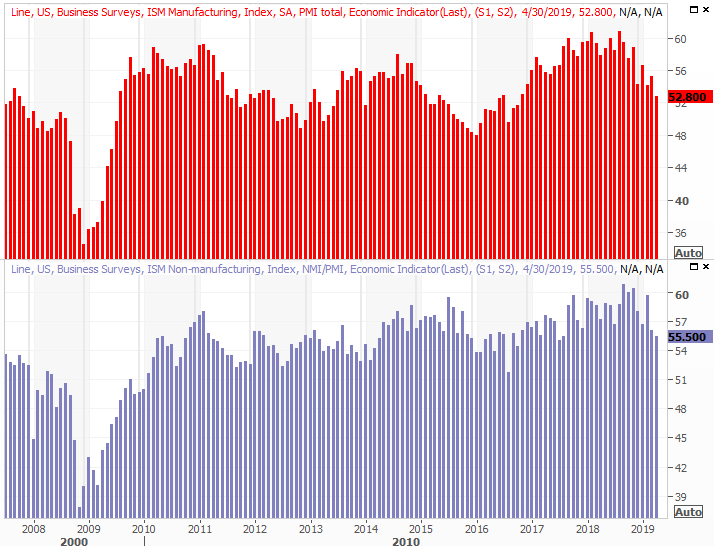
Also on Wednesday we heard the ISM Manufacturing Index report for April, which was rounded out on Friday by the ISM Services report. The manufacturing report fell, as did the services measure. Both are still above the key 50 level, but it's also impossible to deny that both ISM numbers are now in decided even if not dangerous downtrends.
ISM Manufacturing Services Index Charts
Source: Thomson Reuters
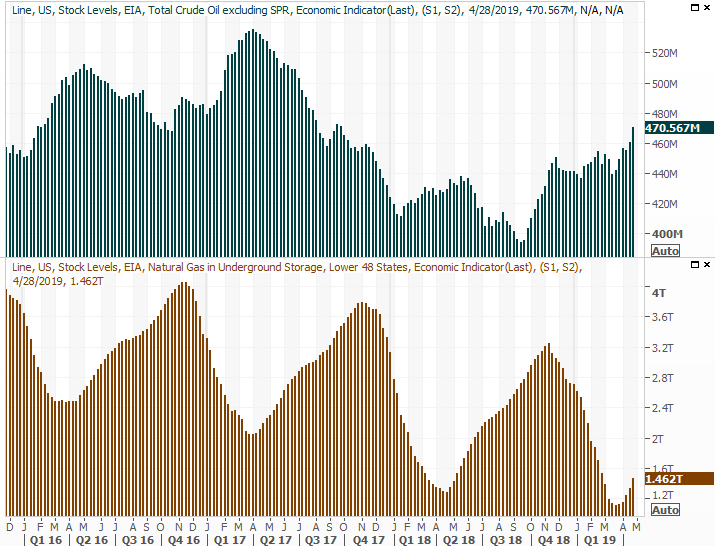
It wasn't something we previewed a week ago, not anticipating a noteworthy change. But, we saw a noteworthy surge in crude oil inventory levels last week. The nation's stockpile grew by 10 million barrels to a multi-month peak of 470.6 million barrels. The country's producers aren't exercising a great deal of restraint.
Crude Oil, Natural Gas Inventory Charts
Source: Thomson Reuters
This report is a key part of the reason crude prices fell last week.
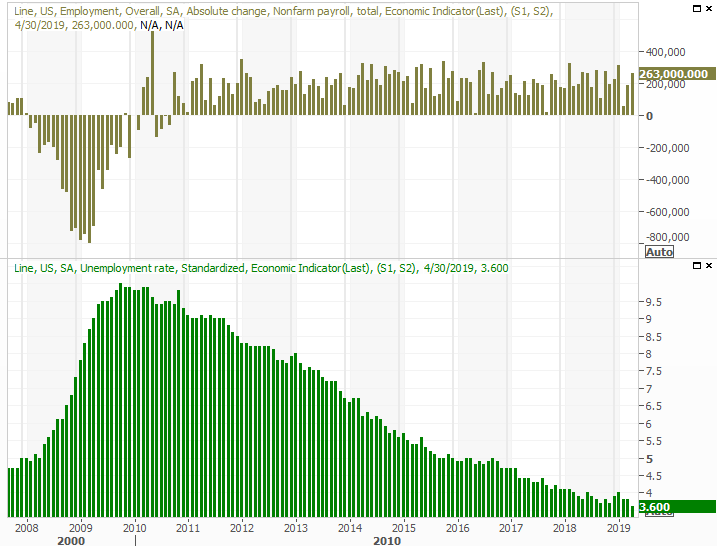
Finally, last week's big news came on Friday. April saw the addition of 263,000 new payrolls, driving the unemployment rate down to a 49-week low of 3.6%.
Payroll Growth, Unemployment Charts
Source: Thomson Reuters
We took a detailed look at the jobs picture at the website, concluding that despite a couple of questionable pieces of data, the employment report card was a very encouraging one. Read the whole analysis here: https://www.bigtrends.com/education/markets/april-jobs-report-doesnt-leave-much-to-complain-about
Everything else is on the grid.
Economic Calendar
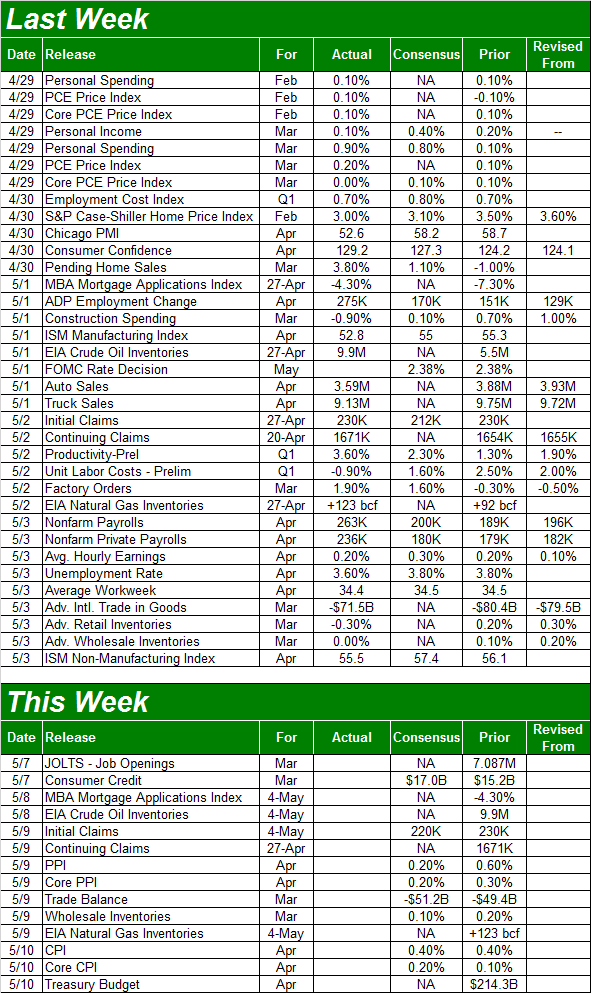
Source: Briefing.com
This week is going to be far less hectic. Aside from Wednesday's updated look at crude and gas inventories, the only information we're keenly interested in is Thursday's producer inflation report and Friday's consumer inflation figures. Both have been relatively tame thus far despite plenty of reason not to expect it. Analysts don't seem to foresee any great price increases for April either, giving the Fed more room and reason to hold off on a rate hike. If that remains the case, it could fan the bullish flames a little more.
Consumer, Producer Inflation Charts
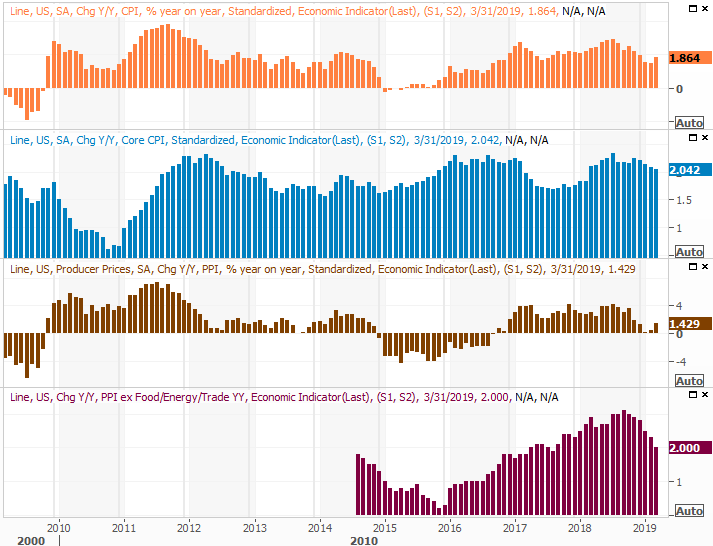
Source: Thomson Reuters
The current annualized consumer inflation rate currently stands at a palatable 1.86%.
Stock Market Index Analysis
It wasn't the best close ever for the S&P 500, but Friday's last trade of 2945.64 was the second-best ever for the index, coming up just a hair shy of Tuesday's record-high close of 2945.83.
The two days in between were a little bit scary though, hinting (again) that the overdue pullback may finally be taking shape. Stocks sidestepped that trouble thanks to an oddly good - though far from ideal - jobs report for April. It may be a bit soon to assume that small stumble was the only penance the S&P 500 has to pay here. We're now fully into the slow time of the year. May is a struggle, and June is loser as much as it's a winner.
It's not a coincidence this turbulence is all taking shape as we remet October's all-time peak levels. Also notice the 20-day moving average line, plotted in blue, may have played a supporting role in Friday's rebound effort. Also notice Friday's volume wasn't all that great. Even when only looking at Friday's bullish volume (not shown), it's not like the bulls were whole-hearted.
S&P 500 Daily Chart, with Volume
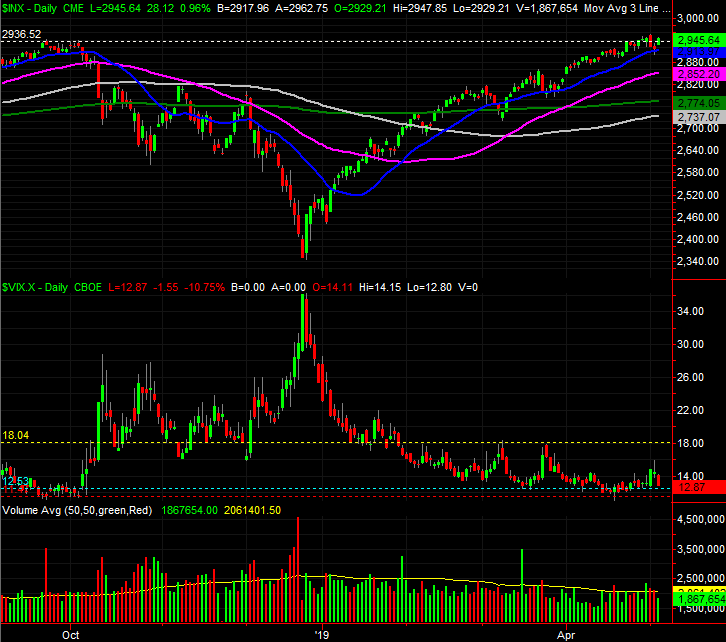
Source: TradeStation
Same deal for the daily chart of the NASDAQ Composite, though to its credit, it's broken at least somewhat convincingly above its October highs.
NASDAQ Composite Daily Chart, with Volume
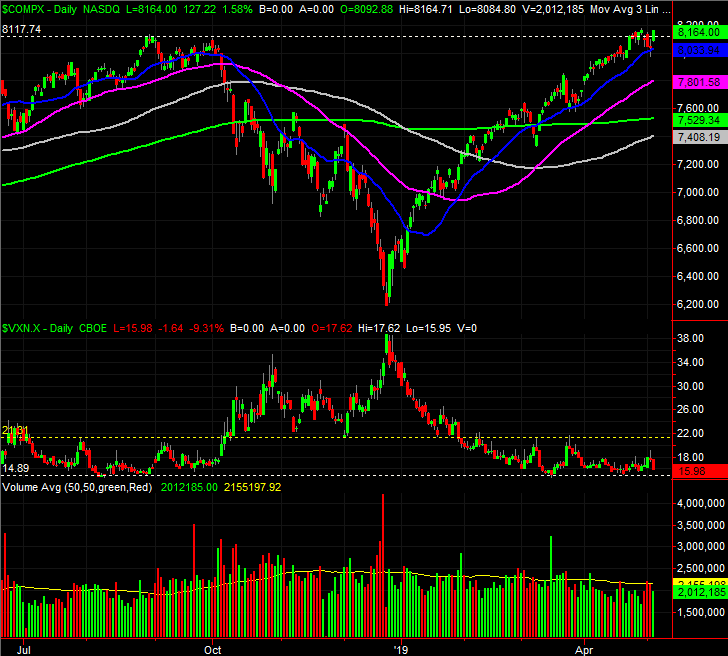
Source: TradeStation
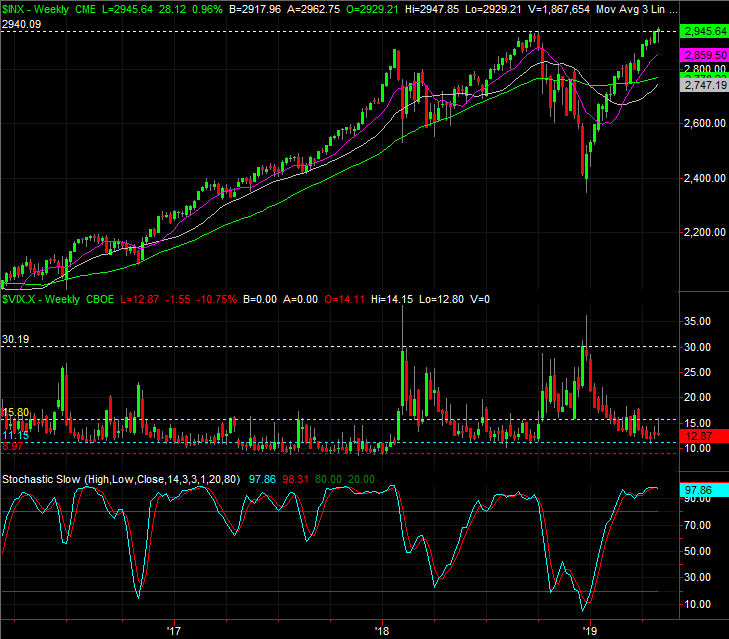
Zooming out to the weekly chart of the S&P 500 doesn't help much in terms of making a meaningful call. Nobody can deny the market is overbought. The question is, does it matter? The market was technically overbought for the better part of 2017, yet continued to rally. It's entirely possible the red-hot rally seen between January and April will only cool to a more moderated rally ahead... like the one seen in 2017.
S&P 500 Weekly Chart, with Volume
Source: TradeStation
There's a difference now, however. Right now, the S&P 500 is valued at a trailing P/E of 19.35. In 2017, it was hovering around 22.0. That's not to suggest stocks are cheap at 19.35 times earnings. But, clearly investors won't have a terribly significant valuation concern here.
There's also the reality of a huge backdrop of trouble being lifted. An unpopular tariff war may finally be annoying enough to bring China (back) to the table. The U.S. economy is doing surprisingly well despite the tariffs, with the initial look at Q1's GDP suggesting it grew at a 3.2% clip. Taxable corporate profits, while not growing, have remained steady since 2012. They could finally soar with just a little more wage growth and a little less international trade friction. Slightly higher commodity prices would also prove a boon for energy and agricultural businesses, who have otherwise been stymied. That inflation has been held off thus far, but somehow with the Fed remaining more dovish than hawkish, more meaningful inflation seems imminent.
The point is, never say never.
None of that really matters to traders in the short run. In the short run, traders are just trying to figure out if Friday rekindled the rally, or was just a short-lived stroke of luck. We can't assume it was only the latter.
The good news is, we still know the lines that could make or break the market. The S&P 500's 20-day line at 2914 is in play. Below that, the 50-day line (purple) and the 200-day moving average line (green) at 2852 and 2774, respectively, will also be in play. The VIX still matters too. The VIX could rise to the verified ceiling at 18.0 and still not have signaled a downtrend for stocks. Should the VIX finally break above 18.0 though, that's trouble. Such a catalyst would also coincide with the S&P 500 breaking below at least one of the aforementioned moving average lines.
None of it's happened yet though.
Make no mistake - this isn't a technically-driven environment right now. It's a sentiment-driven one. Headlines matter. Stocks are overbought and ripe for some profit-taking, but investors are collectively too afraid of missing out to let stocks slide very much.
This is a one-day-at-a-time situation.