Weekly Market Outlook - The Bulls Refuse to Give Up
The bears once again had a chance to tip the market over, and once again, they failed to do the job. Though things looked a little troubling on Friday -- with the market logging its biggest intraday loss in weeks -- by the time the closing bell rang most of the loss had been unwound, with stocks moving back within reach of new record highs.
 Still, the doubters showed some of their cards, revealing they're not entirely convinced this rally is as bulletproof as it's been acting.
The good news is, some of the indices have been kind enough to draw some clear lines in the sand. We'll look at those lines in detail in a moment, after reviewing last week's big economic news and previewing this week's economic reports.
Economic Data
A busy week this past week, so let's just dig in, beginning with the first piece of information -- October's new-home sales pace, which rounds out the recent roundup of real estate data.
The pace was outstanding, rising from an annual rate of 645,000 to 685,000. Paired with the previous week's existing-home sales report, we once again see the housing market heating up again. It could be even stronger were inventory levels not so limited.
New and Existing Home Sales Charts

Source: Thomson Reuters Eikon
In that same vein, we also got September's home price figures from Case-Shiller and the FHFA. Both indicated what we already expected... more progress in that regard. Both reached multi-year highs (again) for September.
Case-Shiller and FHFA Housing Price Index Charts
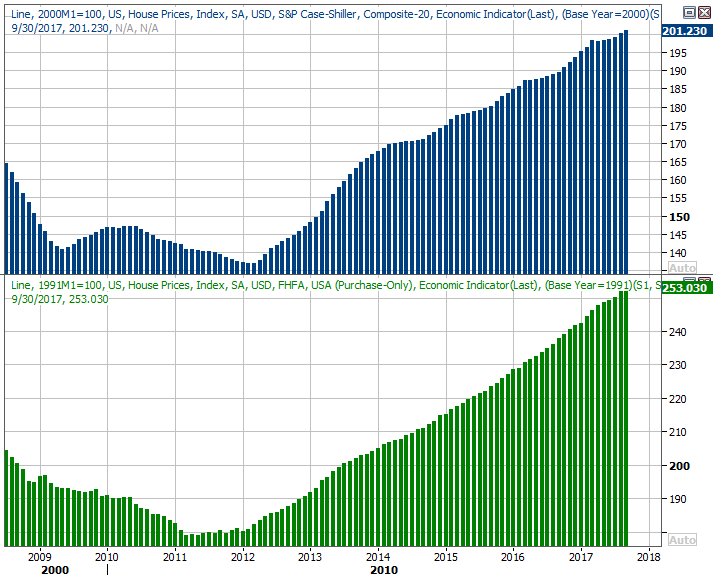
Source: Thomson Reuters Eikon
The third quarter's second (of three) GDP growth reports was also a pleasant surprise, rolling in at 3.3%. That's a big number, and though it could change with the third and final reading due later this month, it's not likely to change much, if at all.
In step with a rock-solid GDP growth report is soaring consumer confidence. The Conference Board reported last week that its measure of sentiment reached a 17-year high of 129.5, meaning people feel very good about the future, and jobs, and are willing to spend accordingly.
Consumer Sentiment Charts

Source: Thomson Reuters Eikon
The Michigan Sentiment Index didn't quite follow suit, but is still in the midst of a broad uptrend.
Finally, we got November's auto sales reports on Friday.
You may recall auto sales soared in September and October, mostly driven by the landfall of two hurricanes. September's surge was driven by sales of trucks in preparation for the two storms, while October's pop consisted of more than a few insurance-reimbursed vehicle replacements. That same event-driven demand is still in effect, though also continues to wane.
Automobile Sales Charts

Source: Thomson Reuters Eikon
Everything else is on the grid.
Economic Calendar
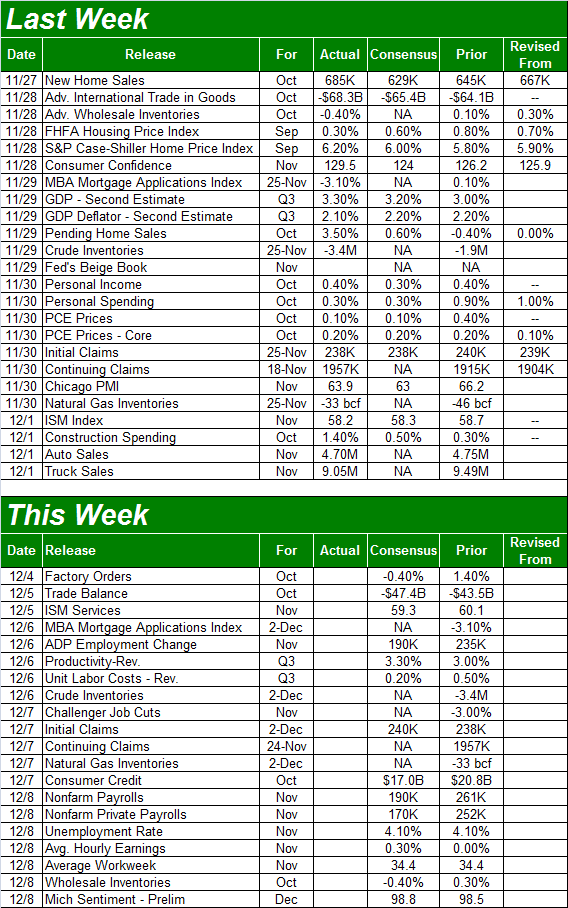
Source: Briefing.com
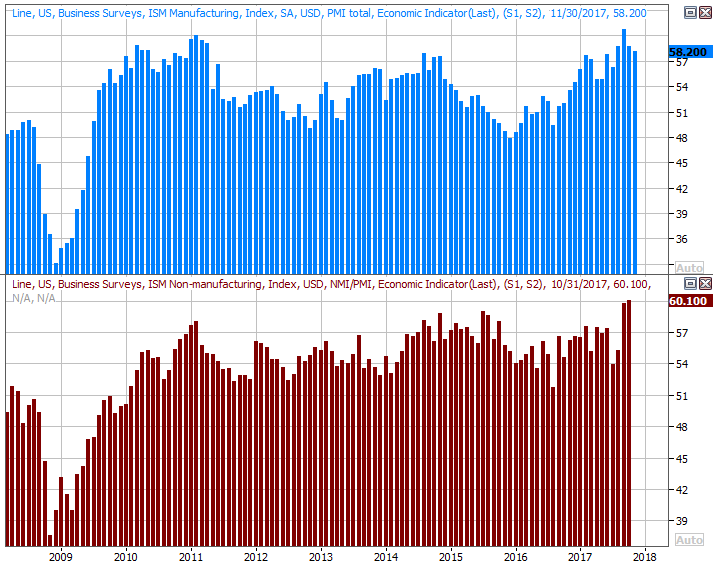
This week is going to be much easier. The only huge item we're getting is Friday's payroll report for November, though we'll first be getting last month's ISM Services number on Tuesday.
The ISM Manufacturing number for last month was actually posted last week, rolling in at 58.2 -- down just a hair from October's score, but still above the key 50 level. The pros are calling for an ISM Services score of
ISM Index Charts
Source: Thomson Reuters Eikon
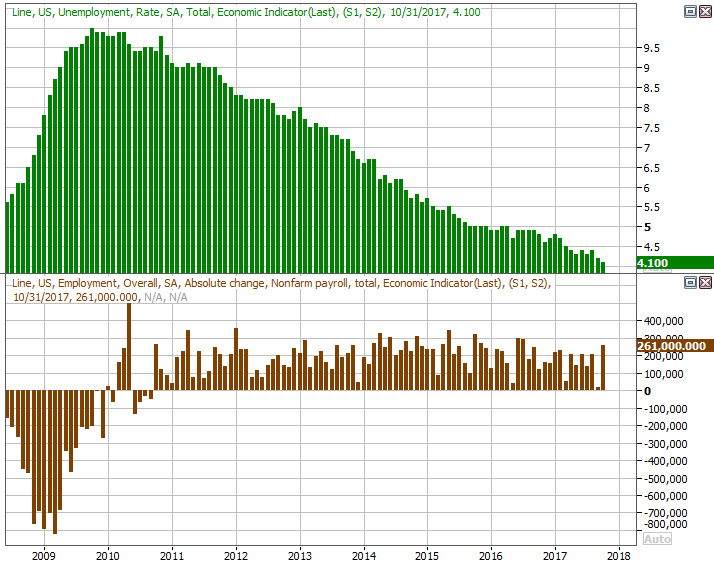
The big Kahuna, of course, is last month's employment report.
You may recall October's report was an especially good one, offsetting a poor September report that was the result of two back-to-back hurricanes. Still, the trend was a strengthening even before September's slowdown, and the pros think more good progress is in the cards.
Payroll Growth and Unemployment Rate Charts
Source: Thomson Reuters Eikon
Index Analysis
If you're confused about what's likely in the near-term future, you're not alone. There's a general sense that stocks are overbought and ripe for a wave of profit-taking, but nobody can deny this rally has been too persistent to assume it will end without a clearly decisive blow to get the ball rolling in a bearish direction. We don't have that yet, but we know what to look for.
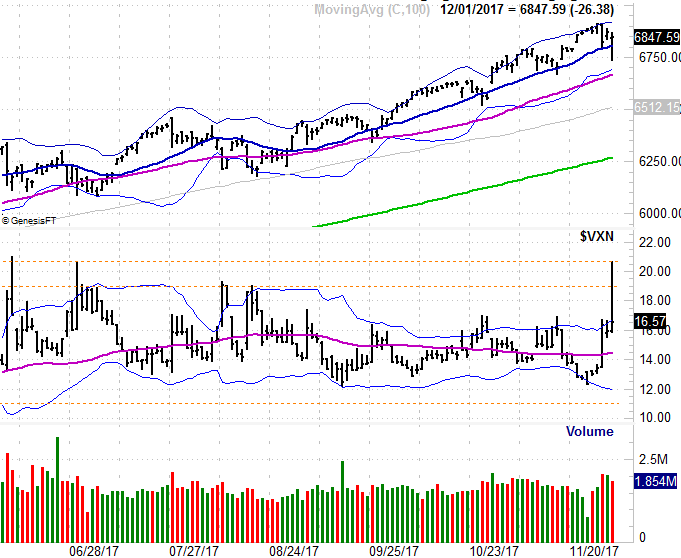
Usually we'd focus on the S&P 500 as our market barometer, but this week we're going to focus on the NASDAQ Composite, as it's closer to the brink. Well, actually, it's the NASDAQ Composite's volatility index, the VXN, that's most worth watching. Take a look. Though it peeled back from Friday's pop, the big pop in itself is telling in that it surpassed the August peaks and matched the June peaks for the VXN.
NASDAQ Daily Chart, with VXN and Volume
Source: TradeNavigator
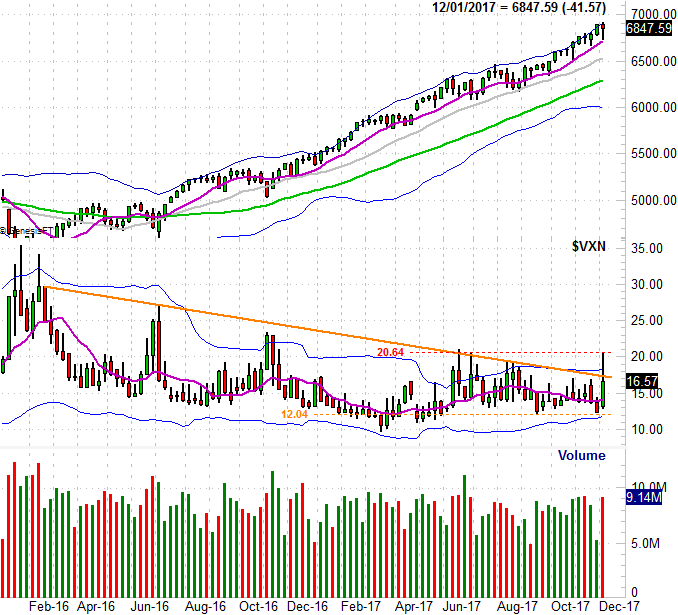
Even so, zooming out to a weekly chart of the NASDAQ Composite we can see the VXN has finally (even if only temporarily) broke above a resistance line that extends all the way back to early 2016. With the volatility index finally chipping away at its ceiling, we should at least entertain the possibility that investors' moods are changing -- at least with tech-heavy NASDAQ stocks.
NASDAQ Weekly Chart, with VXN and Volume
Source: TradeNavigator
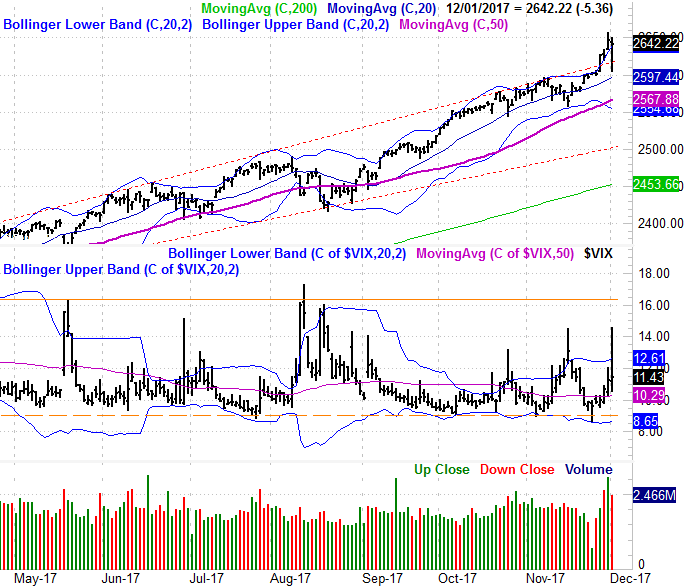
The S&P 500 chart looks similar, though not identical. The breakout thrust looks and is bullish, though in many regards the break above the long-standing resistance line looks and feels more like a blowoff top than a breakout effort.
S&P 500 Daily Chart, with VIX and Volume
Source: TradeNavigator
From a momentum perspective, the tide is clearly bullish. We have to assume the tide will continue carrying stocks in that direction until we see stocks dealt a decisive blow. We've just not seen it yet. When the S&P 500 finally breaks under its 50-day moving average line (purple) at 2567, then we can entertain the possibility. But really, the S&P 500 needs to break under its long-term support level at 2501 (red, dashed) before we can start assuming the worst. If and when that happens, the VIX should also be above its ceiling at 16.3.
Anything else, and there's no reason to assume any weakness is anything more than just a little bearish volatility within the confines of a longer-term uptrend.