Weekly Market Outlook - The Bulls Push Back, But Haven't Won the War Yet
 Not a bad week. While the S&P 500 only gained 1.2% for the five day stretch, remember, it started the week out on the brink of disaster thanks to an ugly selloff two Friday's ago.
It's a bit too soon to pop the corks on the champagne bottles, however. Stocks are still overbought from what turned out to be the biggest quarterly gain since 2009. And, traders have to remember that rollovers are a process more often than an event. Zooming out to a longer-term view it still looks like the uptrend is slowing and testing the waters of becoming a downtrend.
We'll take a look what's happening - and what's not happened yet - after a rundown of last week's economic news and a preview of this week's announcements.
Economic Data Analysis
It was a big week for real estate and construction data, though not exactly a great one.
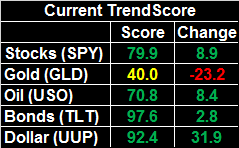
The party started on Tuesday with February's housing starts and building permits. Both were down, and both fell short of expectations. One off month doesn't make a trend, but starts and permits have been leveling off for months now. The market could have used a decisive win on this front last week.
Housing Starts, Building Permits Charts
Source: Thomson Reuters
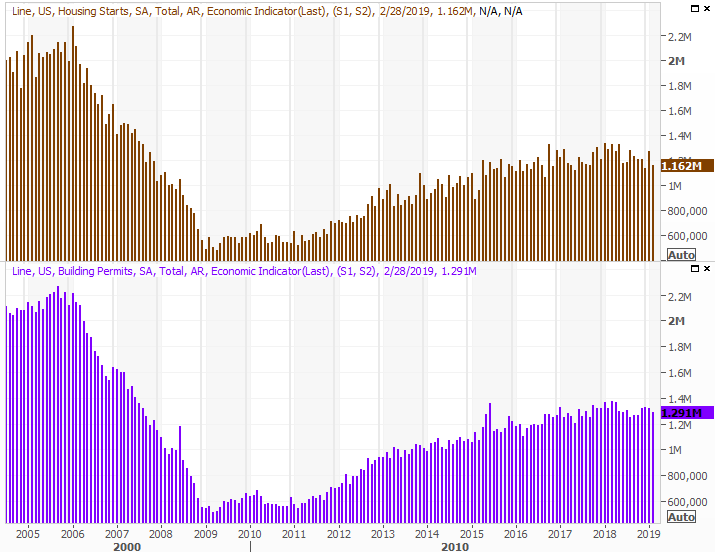
Meanwhile, home prices continue to rise, though the pace of that progress continues to slow. The FHFA Housing Price Index was only up 0.6% for the month of January, and the S&P Case-Shiller Home Price Index indicated home values only grew 3.6% year-over-year in January. The pace is slowing, though it may be slowing simply because home prices are already at record levels.
Home Price Index Charts
Source: Thomson Reuters
Also bear in mind that the above home price data is for January... not exactly the most compelling of months, with the government shutdown in full stride. February's data could suggest a market improvement, particularly given other related data unveiled last week...
... data like February's new home sales. We mentioned a week ago that sales of existing homes surged in February, but it could have been a fluke. That doesn't appear to be the case though. New-home sales surged to multi-month highs in February, reaching a pace of 667,000 units.
New, Existing Home Sales Charts
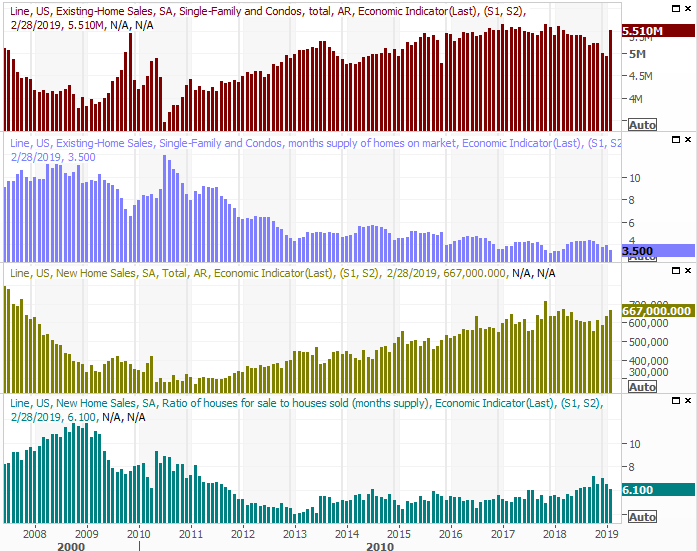
Source: Thomson Reuters
Just as encouraging as sales of homes is that inventory levels are being whittled down again. That should help keep home prices propped up, even if that growth rate has to slow down like it is.
There was other data besides real estate numbers posted last week, however. It was a big week for consumer sentiment, with the one and only report from the Conference Board being delivered on Tuesday, while the third and final sentiment measure from the University of Michigan coming on Friday. The former was down, the latter was up, but both are generally at above-average levels. Either way, we'd like to see another month or two of progress.
Consumer Sentiment Charts
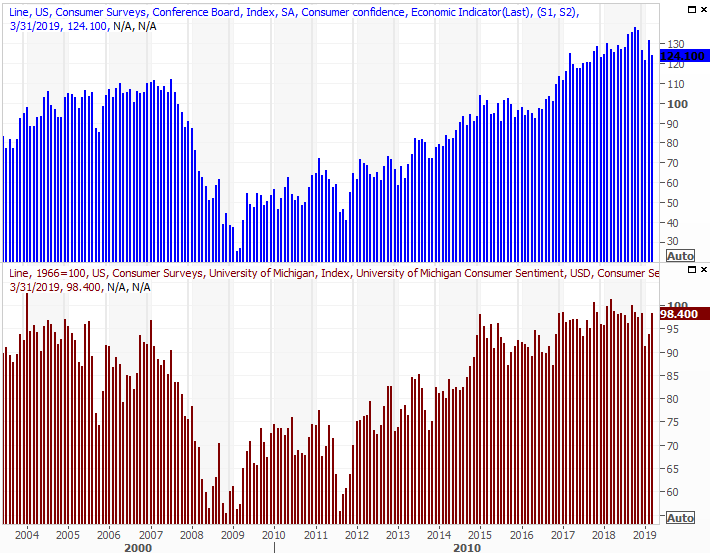
Source: Thomson Reuters
In the meantime, there's enough consumer confidence to keep the market out of deep trouble.
Finally, although we're not showing a chart of it, know that economists dialed back their estimates of Q4 GDP growth with their third and final look. It was at 2.6%, but after more number-crunching it's been scaled back to 2.2%. Not a great pace.
Everything else is on the grid.
Economic Calendar
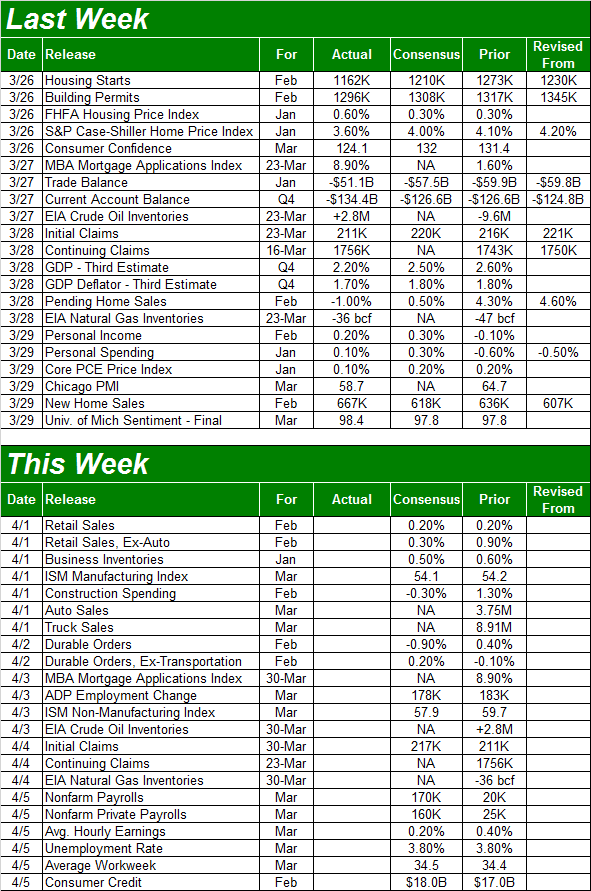
Source: Briefing.com
This week is going to be just as busy, kicking off with February's retail sales and ending with March's employment report.
You may recall January's retail spending reports were alarmingly bad, with the first decline in years being logged. The pace slowed so much, in fact, that some experts were questioning the accuracy of the data. That question will be largely answered on Monday. Economists are calling for modest but measurable gains in spending.
Retail Sales Growth Charts
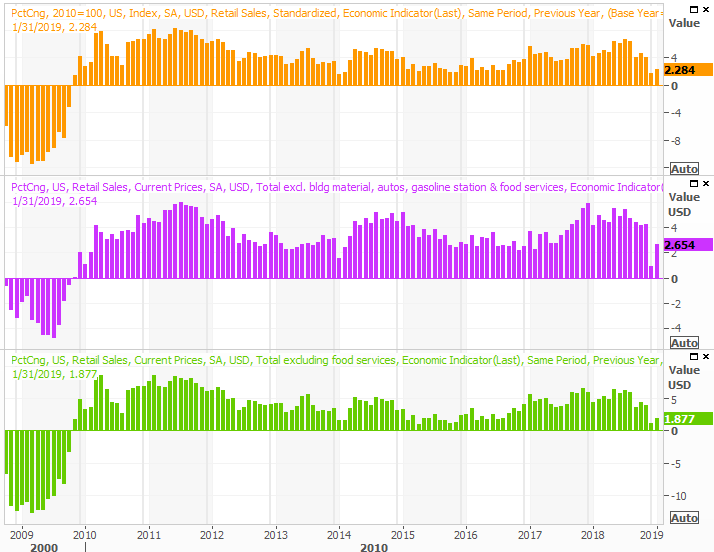
Source: Thomson Reuters
Reminder: The mostly-untouted year-over-year figure of retail sales growth probably means more than the month-to-month data does.
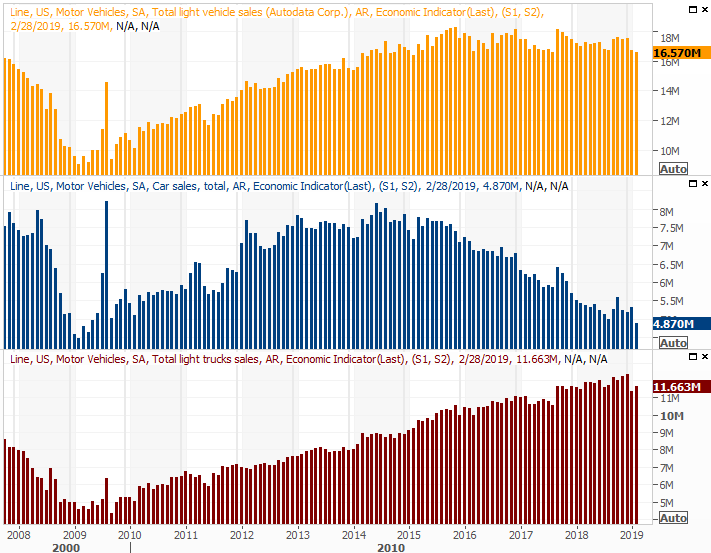
Also on Monday look for the major auto manufacturers to release their car sales figures for March. The final tallies won't be aggregated until the next day. Either way, the industry is still running into a brisk headwind.
Auto Sales Charts
Source: Thomson Reuters
We could really use a win here, though it's unlikely we'll get it.
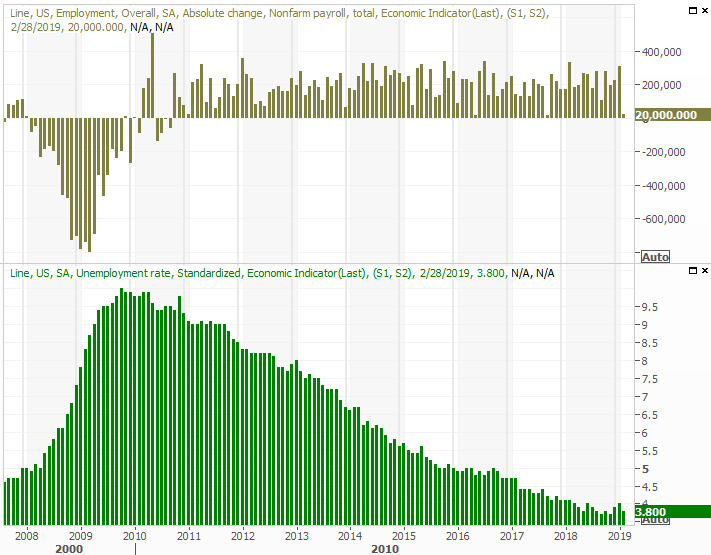
We're also going to get both ISM reports for March this week, but the big Kahuna is obviously going to be Friday's employment report. Economists believe the country added 170,000 new jobs last month, which isn't enough to move the dial on the unemployment rate of 3.8%, but only because that rate is about a structurally/functionally low as it can be. Meanwhile, strong wage growth confirms the employment picture is as strong as the superficial data suggests.
Unemployment Rate and Payroll Growth Charts
Source: Thomson Reuters
As always, we'll take a deeper look at the employment report at the website shortly after the DOL delivers its numbers.
Stock Market Index Analysis
The week ended on a high note, but didn't end things ideally. Stocks still need to go through a major jolt that hits the 'reset' button and clears the deck for a longer-lived rally. The potential for a pullback is still too great to ignore.
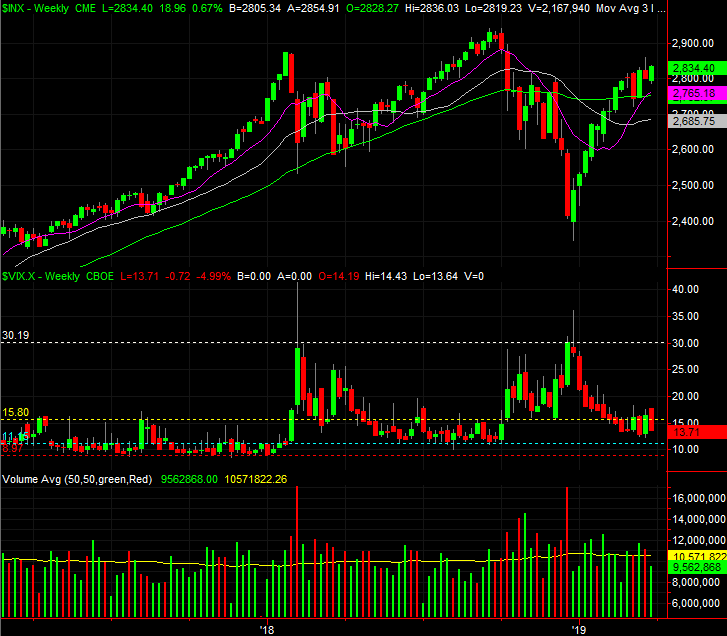
We'll start this week's look with a view of the weekly chart of the S&P 500, just for perspective. From this vantage point we can see the heroic rally over the course of the first quarter was too much, too fast. And, for all the work it took to overcome the 'peakish' action from two weeks ago, last week's bullish volume was pretty feeble.
S&P 500 Weekly Chart, with Volume
Source: TradeStation
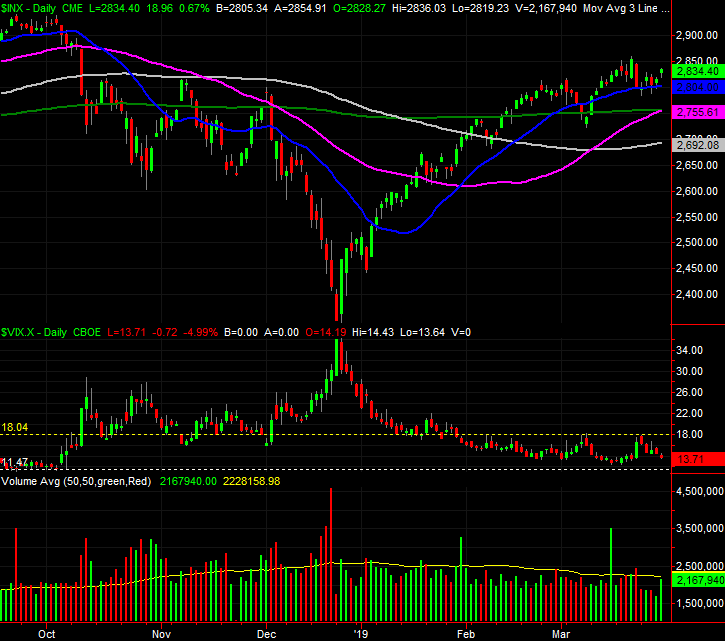
Zooming in to the daily chart doesn't bring us any more perspective, but it does provide more details about where the bulls will be most likely to make a stand should the bears sink their teeth in. The 20-day moving average line (blue) is apt to take a shot at acting as support. But, the biggie is the now-converged 50-day (purple) and 200-day (green) moving average lines at 2755. Not only does the cross of the former above the latter constitute a 'golden cross' that portends a new rally effort, the intersection of the two should make for a particularly formidable floor.
S&P 500 Daily Chart, with Volume
Source: TradeStation
Nevertheless, we have to respect the fact that the bulls once again made a stand they arguably shouldn't have been willing to make. The economy seems to be slowing down, and there's plenty of political turmoil to go around. Investors didn't really care.
So what's it going to take to really push the market over the edge? The VIX has been kind enough to at least make clear where its technical ceiling is. It's 18.0, where it peaked several times since early February. Until the VIX hurdles that resistance, the market will at least enjoy a tailwind. And, even if the VIX does hurdle the 18.0 mark, the S&P 500 won't really fall into dire straits until/unless it pulls under the 50/200-day moving average lines.
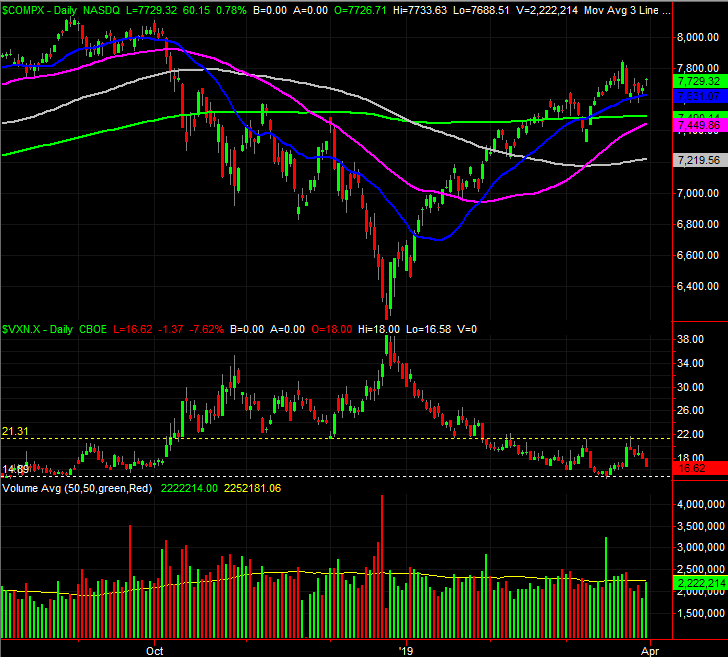
The daily chart of the NASDAQ Composite and the VXN tells the same basic story. That is, the momentum is still technically intact, but it's slowing down
NASDAQ Composite Daily Chart, with Volume
Source: TradeStation
The VXN's ceiling is (still) 21.30.
The average April gain for the S&P 500 is 1.6%, though the index is well ahead of schedule, so to speak, so far in 2019. On the other hand, a couple of small stumbles seen in February might provide enough room to keep the rally alive a little longer. Though it's still a little overextended from January and February, it's not wildly overbought.
Whatever the case, somehow it seems like it's the headlines that are going to continue poking and prodding the market.... much more so than usual.
On other fronts, crude oil continues to rally, partially stemming from political and sentiment reasons, and partly for raw supply/demand matters. Regardless of the underpinnings, there's still room for crude to keep rising... even if it's just a reaction rally. Oil pushed deep into the $70's late last year on not-dissimilar fundamentals.
Crude Oil Weekly Price Chart
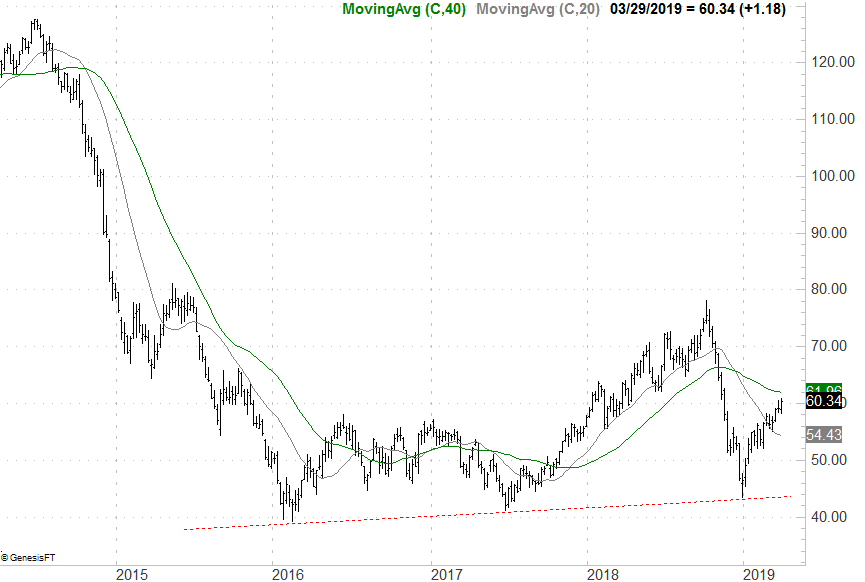
Source: TradeNavigator
The current value of $60.34 is well above the EIA's long-term price outlook which pegs oil in the upper $50's through 2020. The government's energy overseer, however, can and will update that outlook on a pretty regular basis. Don't take that forecast to heart.