Weekly Market Outlook – The Bulls. Just. Won’t. Go. Down.

Stocks ended up logging a win for the week, albeit a small one. Still, a small win is better than any loss.
Nevertheless, there’s no denying the weight of the recent gains is a problem. The market is struggling to continue moving higher here. Not even hope for an end to the conflict in the Middle East is getting the sort of traction it was getting just a few days ago. (It was already well priced in.)
That doesn’t necessarily mean a pullback is inevitable. It’s still more than likely. However, there’s little to no convincing evidence that a correction is imminent. We only know that the stage is set, just as we know exactly what we’re looking for.
We’ll discuss these details in a moment. Let’s first look at last week’s biggest economic news and preview what’s coming this week.
Economic Data Analysis
There wasn’t a lot of interest reported last week, but the real estate picture was rounded out on Thursday with the Census Bureau’s release of April’s housing starts and building permits. Starts fell, although not as much as feared. And, permits improved a little more than projected. In both cases though, the overall numbers remain pretty poor.
Housing Starts, Building Permits Charts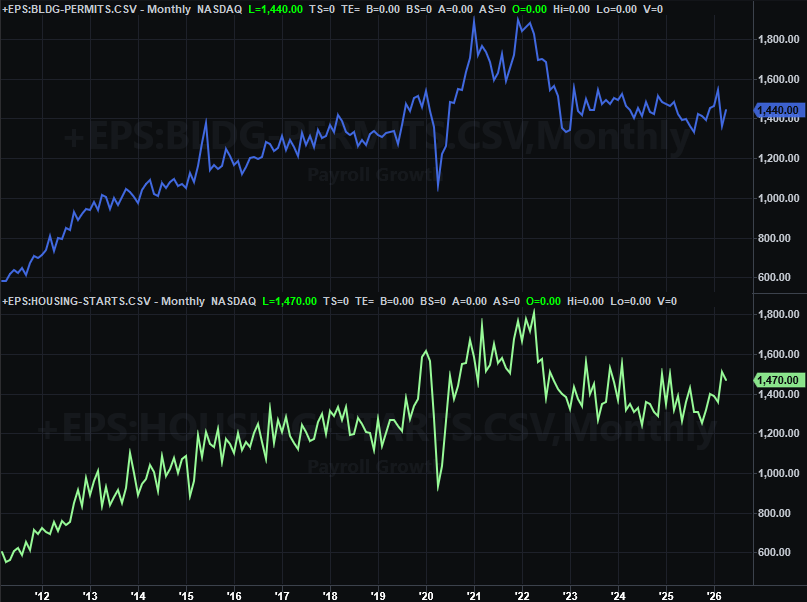
Source: Census Bureau, TradeStation
The third and final look at the University of Michigan’s consumer sentiment reading for the month was released on Friday. Although not yet updated on our chart below, it fell to a multi-year low of 44.8.
Consumer Sentiment Charts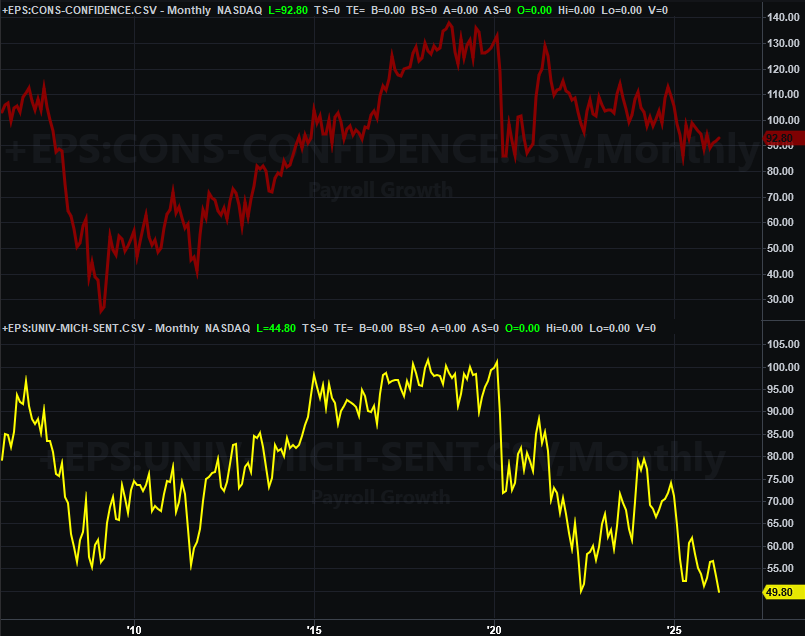
Source: University of Michigan, Conference Board, TradeStation
The Conference Board’s consumer confidence score for May will be released on Tuesday of this week. Economists are looking for a modest pullback from April’s level.
Everything else is on the grid.
Economic Data Report Calendar
Source: Briefing.com, TradeStation
After Monday’s Memorial Daty shutdown, the party starts back on Tuesday with last month’s home pricing data from the FHFA as well as Standard & Poor’s. After months of seemingly unlikely improvement, the weight of overpriced homes finally seems to be undermining prices. This could be en pivotal update.
Home Price Charts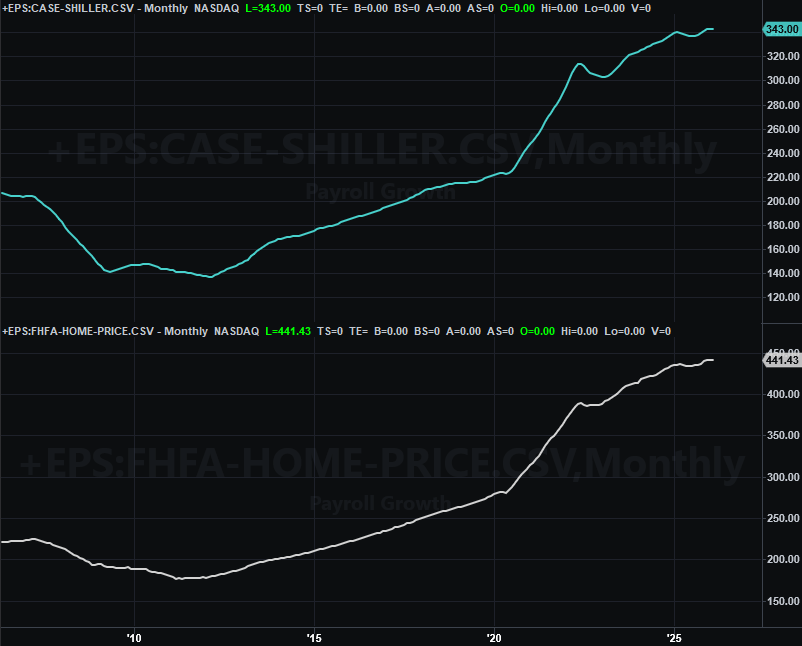
Source: Standard & Poor’s, FHFA, TradeStation
In this vein, on Thursday, look for last month’s update on sales of new homes from the Census Bureau, catching us up on all the postponed reports. You may recall existing homes sales didn’t budge in April. It seems unlikely that new home sales will either (although clearly this number can be volatile). Both figures remain low, underscoring how weak the business is right now.
New, Existing Home Sales Charts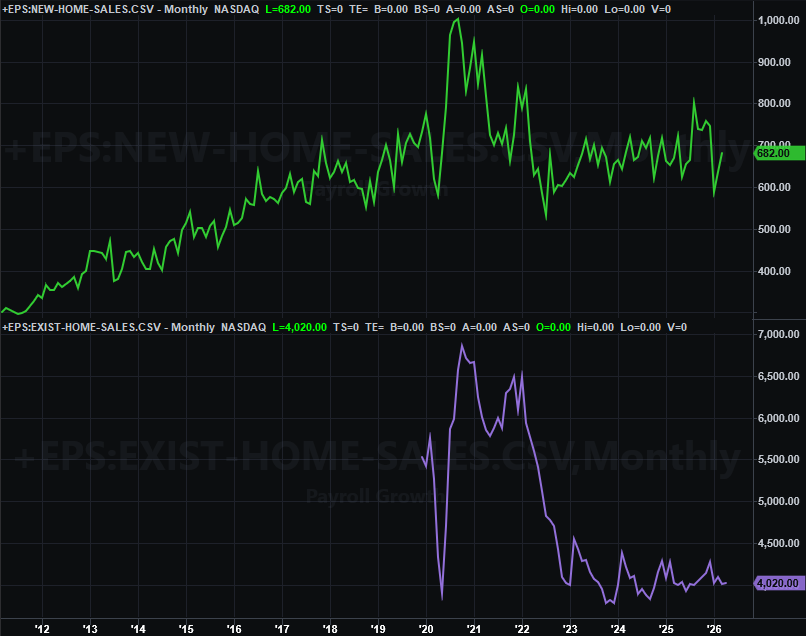
Source: Census Bureau, National Assn. of Realtors, TradeStation
The only other item of interest this week is Friday’s look at consumer income and consumer spending for April. Although we’re not charting it here, this is noteworthy news all the same because it’s one of the big determinants the Federal Reserve uses to make interest rate decisions. As it stands right now, things are expected to cool a bit from March’s red-hot growth levels, but they’ll still be pretty hot.
Stock Market Index Analysis
Things are getting a little bit frustrating just because they’re getting so unusual. The market “should have” started a correction by now. Although the potential end to the military conflict in Iran has obvious bullish implication, bear in mind the market’s 18% rally just since late March and stocks’ already-high valuations before now already reflect the positive impact of such news. We’re also not entering a time of year that’s just slow for stocks. Yet, the bulls keep swinging, and making a little progress when they do.
All the same, it’s difficult to remain bullish here. It’s much easier to ease into the bearish camp.
Chief among the non-bullish concerns right now is the continued lack of volume on the way up, as highlighted on the daily chart of the S&P 500 below. The same daily chart also shows just how far the index has come in less than two months, and how high it’s flying without a new immediately below. It’s also worth mentioning the doji-esque shape of Friday’s bar hints at a pivot out of a rally and into a pullback (although heading into a three-day weekend might have also been a reason a few folks were filing out late Friday).
S&P 500 Daily Chart, with Volume and VIX 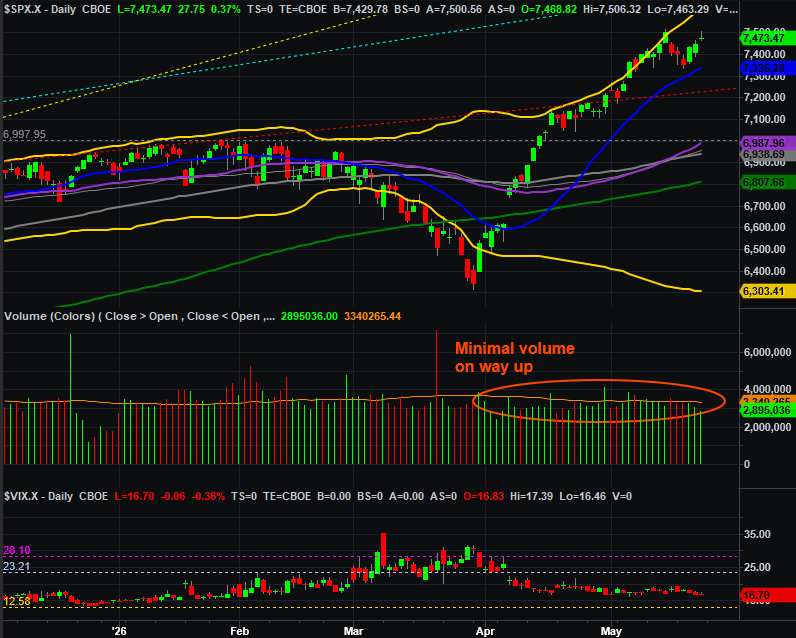
Source: TradeNavigator
The problem for the bears here is just that while there’s certainly plenty of room and potential for a pullback, it’s clearly not happening yet. At the very least it would take a break under the 20-day moving average line (blue, currently at 7,336) to get that ball rolling. Of course, given how little technical support there is immediately below that level, if-and-when that ball gets rolling there’s little to stop it.
The daily chart of the NASDAQ Composite looks similar, although not identical. We added the same Bollinger band to this chart as we plotted on the S&P 500’s to the same effect. The bigger detail to watch here, however, is still the 20-day moving average line (blue) at 25,805. As likely as a correction seems here, nothing is really bearish until it fails as a floor.
NASDAQ Composite Daily Chart, with Volume and VXN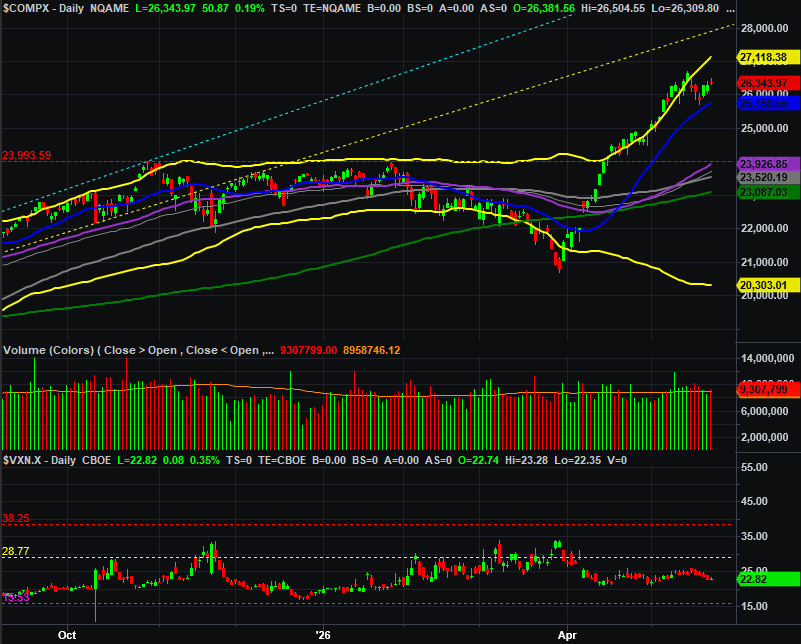
Source: TradeNavigator
Here’s the weekly chart of the NASDAQ… for what it’s worth. It does remind us of one interesting thing though. That’s the fact that the bigger-picture advance is stalling now that the index is bumping into a technical ceiling (orange, dashed) that extends all the way back to late-2022, when that bear market finally ended. This is the right place for the bears to draw a line in the sand.
NASDAQ Composite Weekly Chart, with MACD and VXN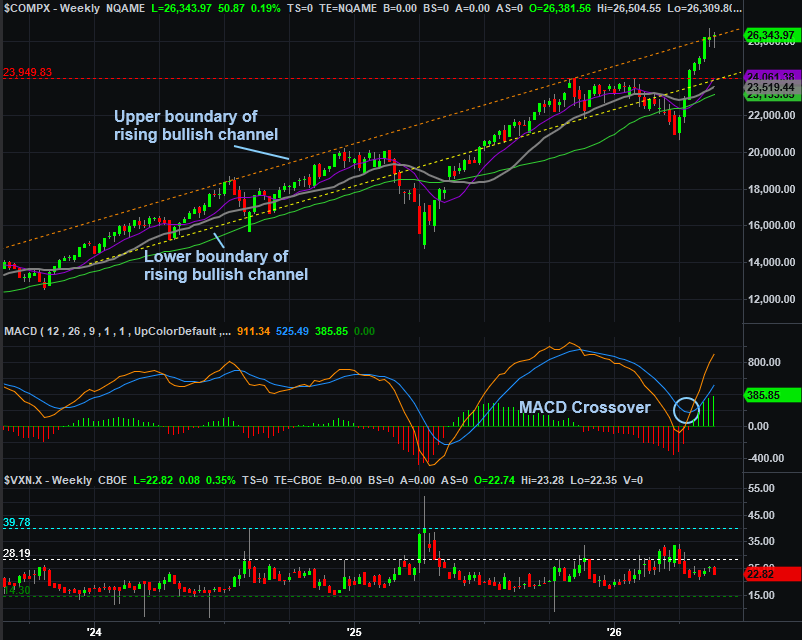
Source: TradeNavigator
Again though, potential doesn’t matter. The market actually needs to show clear signs that it’s unraveling to trade it as such. We don’t have that yet. Until we have it, we have to lean bullishly.
Just don’t dig in too deep. There’s still no denying the path of least resistance from here is downward.