Weekly Market Outlook - The Bulls Come From Behind Again
Despite the wobbly start to the week, as has been the case for months now, the bulls found a reason/excise to rekindle the rally. Though it was only a small gain logged last week, it was a gain nonetheless.
 Handicapping the market, ergo, has become an almost-pointless exercise. Conventional thought and normal application of technical analysis tools don't really apply anymore. The only thing worth doing from this point is talking about when the momentum will finally break, and what sort of psychological catalyst will finally pull the plug on it.
Still, we'll do our best to apply logic to an illogical market, right after we look at last week's and this week's economic news.
Economic Data
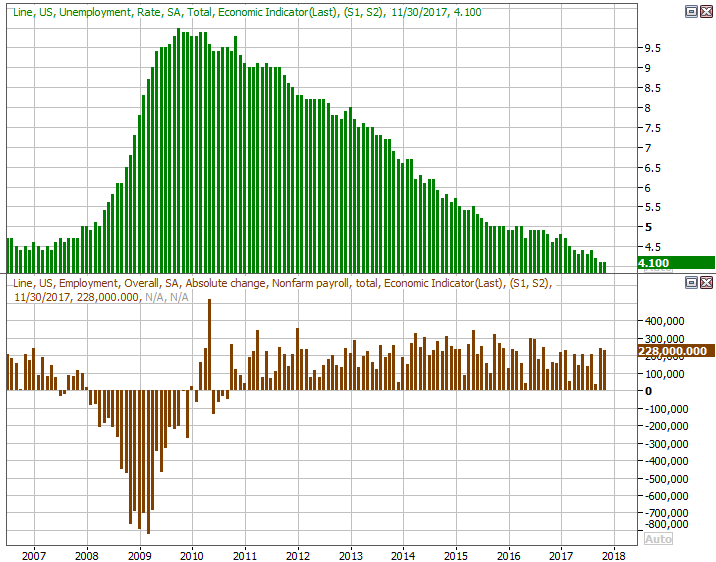
It was the last thing we heard last week, though it's going to be the first thing we look at this week simply because it was also the most important news from last week. That is, November's jobs report. We added 228,000 new jobs last month, keeping the unemployment rate at 4.1%.
Payroll Growth and Unemployment Rate Charts
Source: Thomson Reuters Eikon
The net growth in jobs was tepid, and obviously we (generally) want to see an ever-falling unemployment rate. At 4.1% though, it's already about as low as we can reasonably expect. And, while 228,000 new payrolls isn't huge, bear in mind that pretty much anyone who wants a job has a job. There's not a lot of room for net progress here. The key sign of growth/strength going forward is wage growth.
We talked more about that very matter at the website. Just go here for that discussion: https://www.bigtrends.com/education/markets/november-jobs-report-points-to-a-new-norm-in-labor-force-participation-rate
The only other item of real interest from last week was the update on crude oil inventories. They fell by 5.6 million barrels, extending the renewed downtrend that got going again several weeks ago. That report reversed a fairly strong dip in oil prices on Wednesday; the bigger oil rally is still in motion.
Crude Oil, Natural Gas Inventory Charts
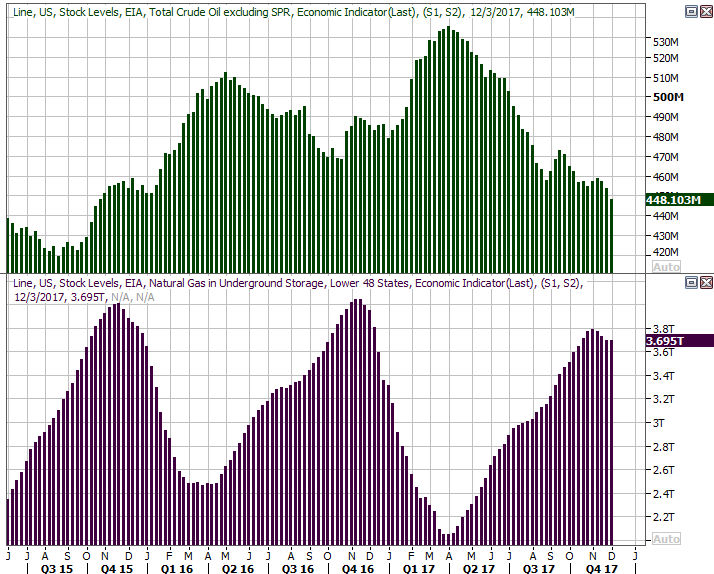
Source: Thomson Reuters Eikon
Also note that the ISM Services Index fell from 60.1 to 57.4, though is still above the key 50 level. The ISM Manufacturing Index, which was updated two weeks ago, was 58.2, down just a hair from October's level.
Everything else is on the grid.
Economic Calendar
Source: Briefing.com
This week is jam-packed, so let's just focus on the highlights most likely to move the market in a big way.
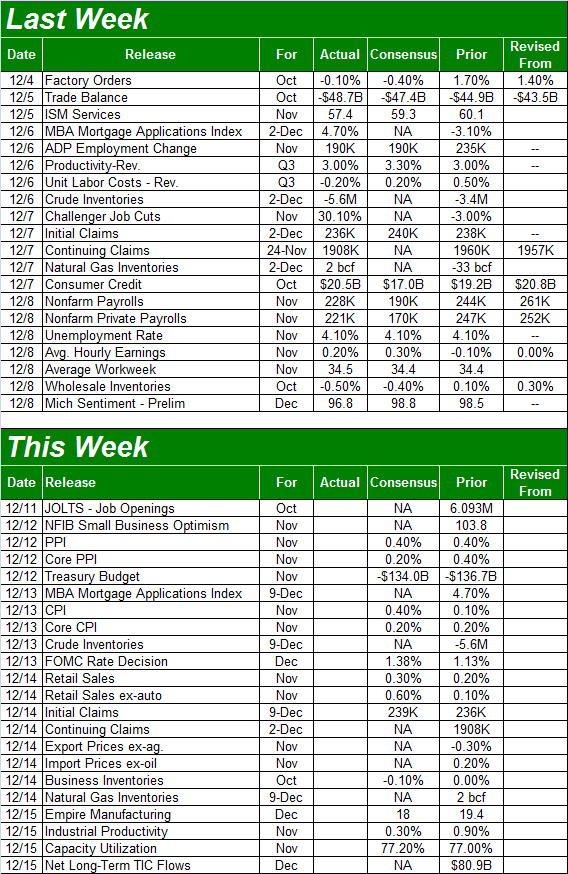
The party starts early on with Tuesday's producer inflation report, and Wednesday's consumer inflation report. This will be the last look at inflation before the Federal Reserve has a chance to share their decision about interest rates on Wednesday afternoon. As of the latest look, the market is pricing in a 90% chance of a quarter-point hike. Indeed, those odds may still not be high enough to reflect the projected increase in prices on all fronts.
Producer, Consumer Inflation (Annualized) Charts
Source: Thomson Reuters Eikon
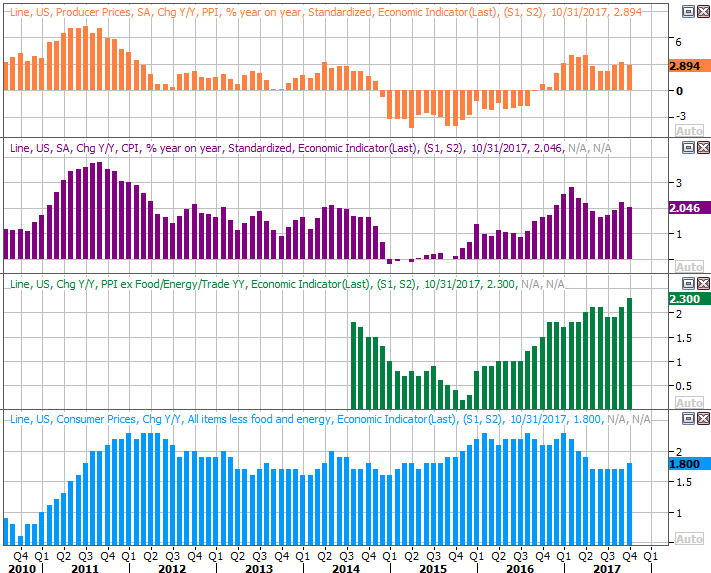
Look for last month's retail sales figures on Thursday, which of course serve as a barometer for consumerism. The pros are looking for a fairly solid improvement here too, maintaining an impressive growth streak.
Retail Sales Growth (Annualized) Charts
Source: Thomson Reuters Eikon
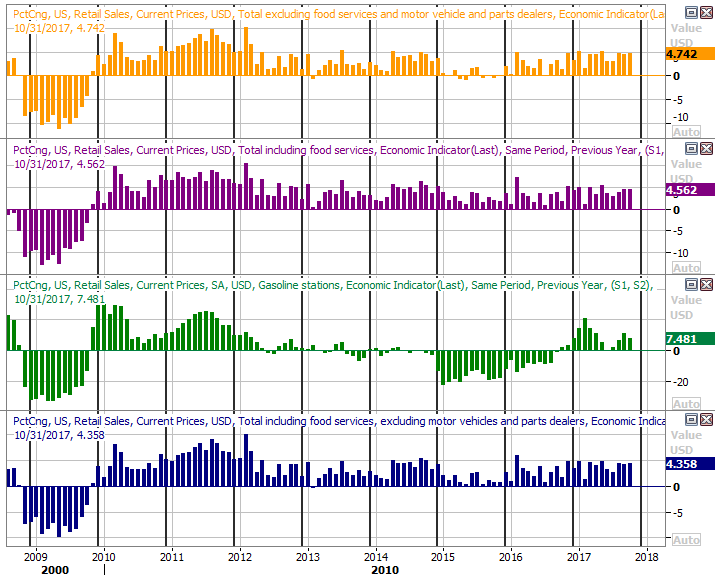
Finally, keep your eyes peeled on Friday for last month's industrial productivity and capacity utilization figures from the Fed.
We've mentioned this before but it bears repeating now... this data shows as incredibly high correlation with the broad market's direction. It doesn't stave off short-term ebbs and flows, but it does coincided quite nicely with bull and bear markets. And, as you can see, both measures are strong and trending higher again, and economists are calling for more progress on Friday. That's why we're still long-term bulls, even as we anticipate a short-term pullback sooner or later.
Industrial Productivity and Capacity Utilization Charts
Source: Thomson Reuters Eikon
Index Analysis
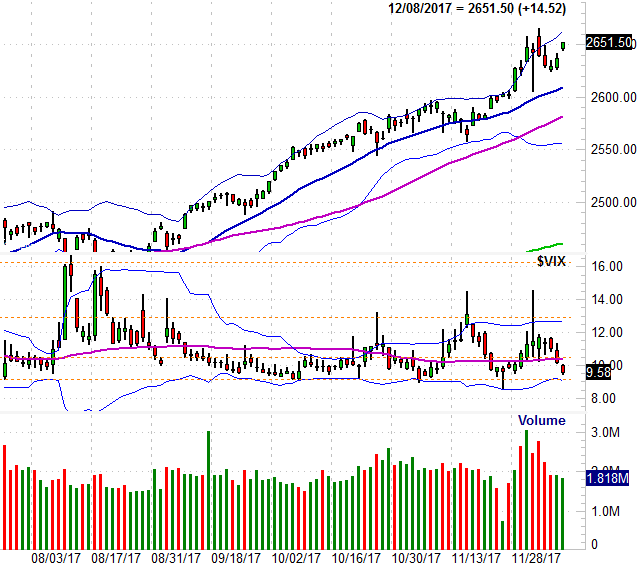
The daily chart of the S&P 500 immediately below may not "say it all," but it sure says a lot. Stocks did anything but hit the ground running, but once again found a good reason to end the week on a bullish foot. Encouraging news on the tax reform front (and a subsiding of other political news) was the prod.
S&P 500 Daily Chart, with VIX and Volume
Source: TradeNavigator
It's hardly the ideal renewal of an uptrend though. Outside of the fact that we've now gone far too long without a decent-sized correction, the VIX is back at levels that are too low for our own good. And, though the index was making forward progress Thursday and Friday, the volume for both of those days was anything but encouraging. The bulls may be able to squeeze a little more life out of this current bullish wave, but not a lot... particularly with the upper 20-day Bollinger band ready to put a lid on the effort.
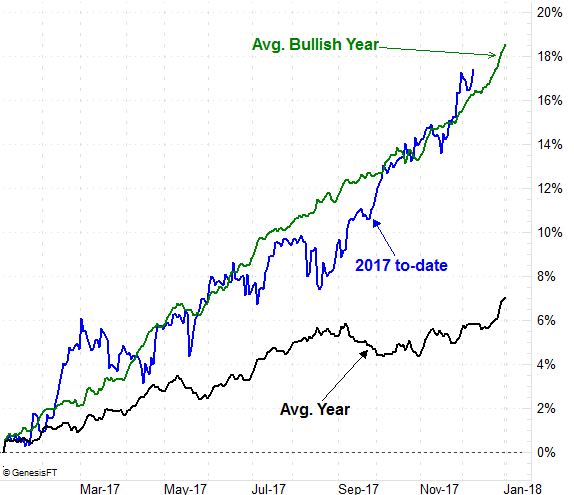
Thing is -- and this has been something of a headache for a while now -- the S&P 500's path this year so far hasn't been unusual or atypical. It's slightly ahead of the usual progress for a bullish year, though not leaps and bounds so. As such, any lull may be minimal.
S&P 500 Performance YTD, vs. Avg. Year and Avg. Bullish Year
Source: TradeNavigator
It's an annoying conundrum to be sure. We have to assume the momentum will remain in place until we have clear evidence it won't. But, we also have to acknowledge valuations -- and how old this uninterrupted rally has become -- is dangerous.
We'll side with the momentum for the time being, knowing that (logical or not), the year usually ends strong for stocks. In fact, we can't even worry about a pullback getting out of control until the S&P 500 breaks below its 50-day moving average line (purple), currently at 2581, and the NASDAQ's Volatility Index (VXN) breaks above 18, and really, above its ceiling at 20.6 (red, dashed). Take a look.
NASDAQ Composite Chart, with VXN and Volume
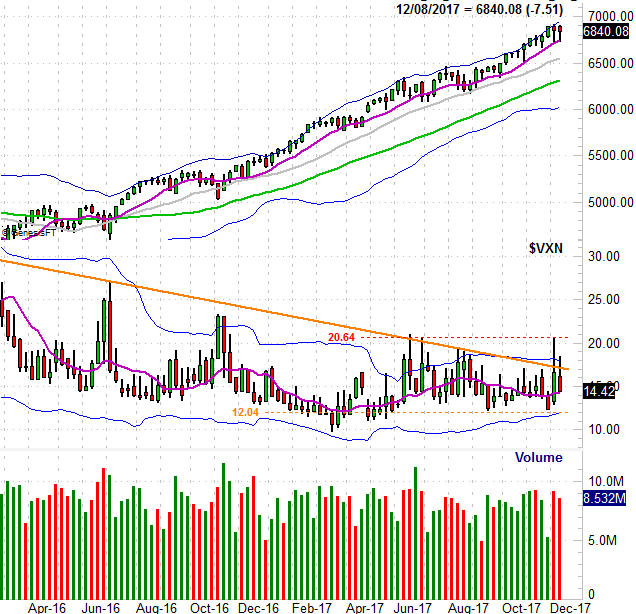
Source: TradeNavigator
Just bear in mind that the stage is set for a small dip sooner than later. Just keep such a stumble in perspective. Don't confuse it for a bear market just yet, because that's not what it will be.