Weekly Market Outlook - The Bulls Break Through, But There's More Work to Do
In the early part of last week's shortened trading action (the market was closed on Monday) it looked as if stocks might roll over again. Then Friday happened, rekindling the rebound effort at the last possible moment.
 Will the reversal get traction this time around, after failing to do so a week ago? Maybe. The S&P 500 cleared a major hurdle on Friday it has been unable to clear just a few days prior. That's a start.
We'll look at the pending pivot in a moment, right after we quick review of last week's economic news and a preview of this week's economic data.
Economic Data
It was a very quiet week last week in terms of economic announcements. But, the couple of items we did get are very much worth a look... just because they require some 'splainin'.
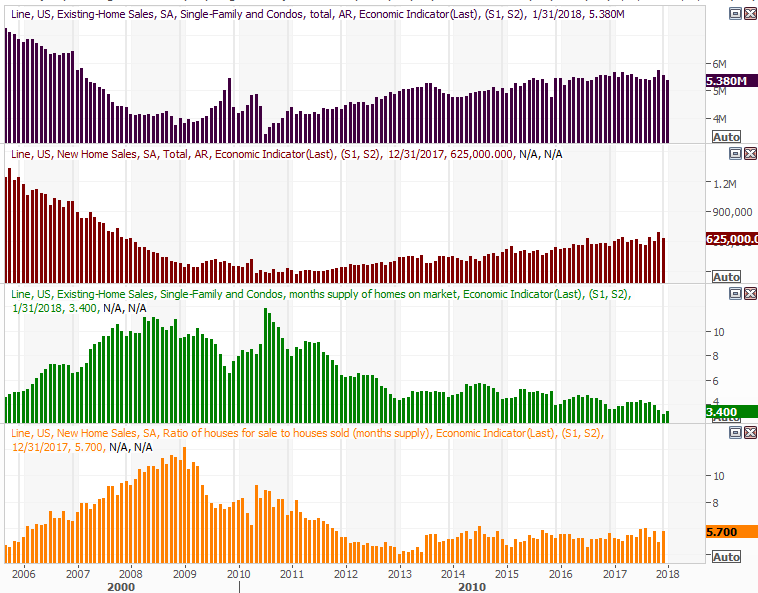
First and foremost, last month's pace of new-home sales fell to 5.38 million, falling short of the expected 5.62 million. This news created more media hysteria than it should have, with headlines suggesting limited inventory of homes for sale was the problem. Thin inventories are a problem, to be clear, but it's not a new problem. Likewise, January's existing-home sales slowdown wasn't quite as catastrophic as implied, and even may be even less so if new-home sales roll in higher than anticipated for January. And, as the graphic shows, there's more inventory of new-homes than existing homes.
New and Existing Home Sales (Annualized) and Inventory Charts
Source: Thomson Reuters Eikon
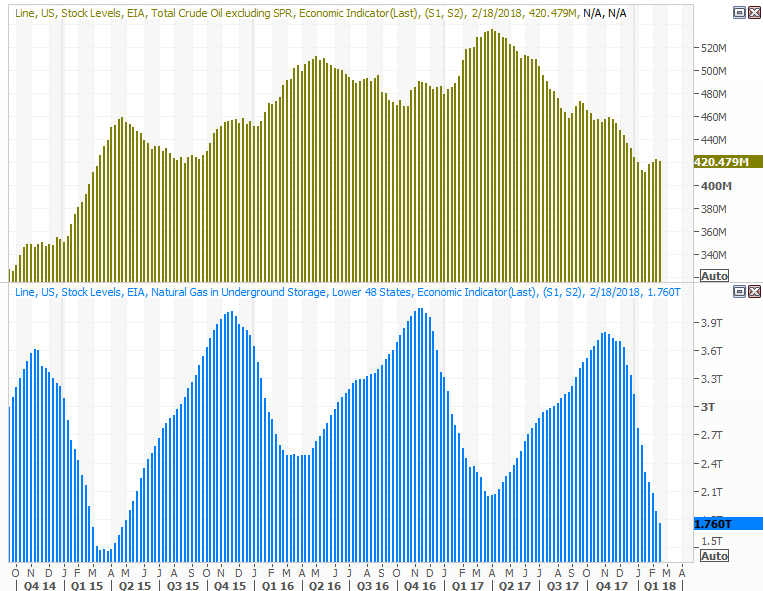
The other update was on the crude oil front - a look at the prior week's inventory levels.
You'll recall we'd seen a few weeks of modest increases, ending a long and rather rapid decline in crude stockpiles that accompanied a rally in crude prices. Now those inventories are leveling off, and are (for the time being anyway) acting like we won't see any more extreme swings. That's neither good nor bad for crude prices themselves, except perhaps in the sense we now no longer have reason to jump to extreme conclusions whenever we see even the slightest of movement here.
Crude Oil and Natural Gas Inventory Charts
Source: Thomson Reuters Eikon
Everything else is on the grid.
Economic Calendar
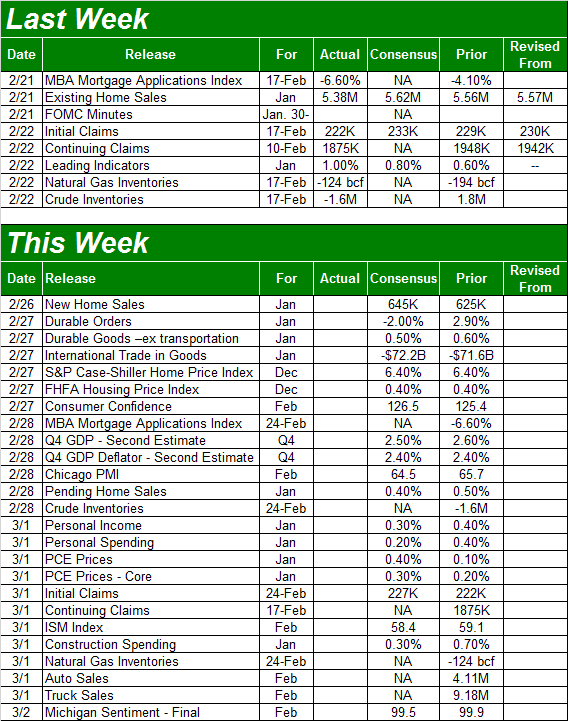
Source: Briefing.com
As was noted, we'll get the new-home sales report early this week; economists are calling for a pace of 650,000, up from last month's 625,000. That report could redeem or break the market's opinion in housing demand.
This is also going to be a big week for getting a read on consumer sentiment. The Conference Board's measure of consumer confidence will be posted on Tuesday, and the final reading on February's Michigan Sentiment Index is coming on Friday. Despite the early-February scare for stocks, economists believe people still feel quite optimistic about the foreseeable future.
Consumer Sentiment Charts
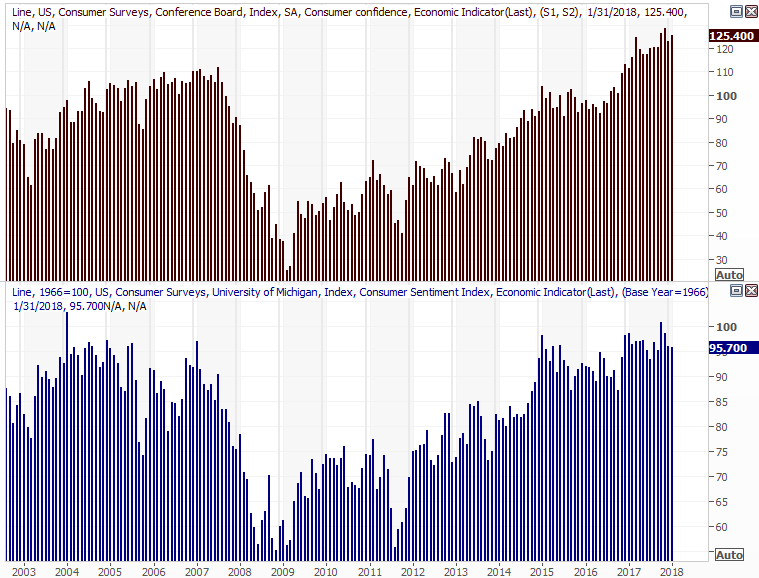
Source: Thomson Reuters Eikon
On Wednesday we'll hear the second (of three) estimates for the fourth quarter's GDP growth rate. The experts are expecting a slight decline from the prior guess of 2.6% growth, but the outlook of 2.5% is still healthy.
On Thursday look for the ISM Manufacturing Index score for February; we'll wait to show you the chart until the ISM Services Index score is posted next week.
Last but not least, brace for February's auto sales reports on Friday. Though a couple of hurricanes caused a spike in purchases late last year, that surge has been dwindling ever since, renewing a downtrend following 2016's "peak auto." Analysts are expecting sales levels better than January's to be fair, but January is a tough month for car dealers. On a year-over-year basis, Edmunds is calling for a decline of 4.1%.
Auto Sales Charts
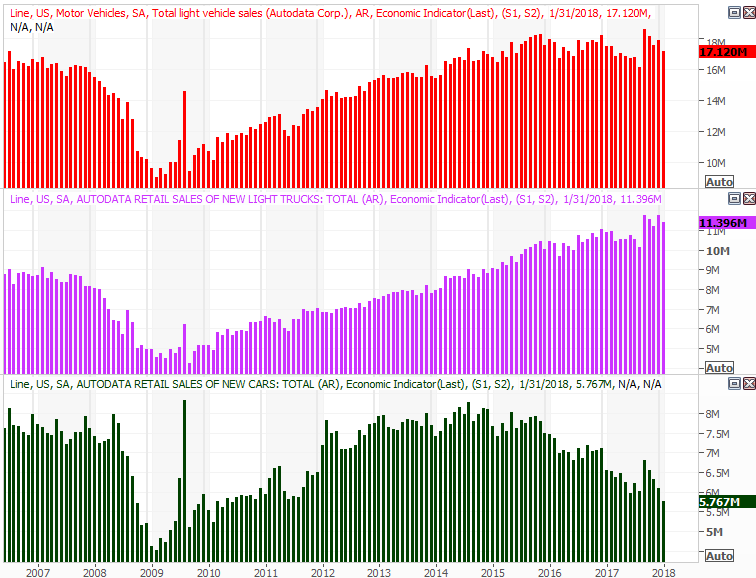
Source: Thomson Reuters Eikon
Index Analysis
Let's start this week's look with a view of the weekly chart of the S&P 500, just because it will all make more sense with a bigger-picture perspective. Take a look. Following through on the prior week's reversal effort, the index managed to tack on a decent gain in just four trading days. The VIX also continued to edge lower, and still has room to keep sinking. It all bodes bullishly for stocks.
S&P 500 Weekly Chart, with VIX and Volume
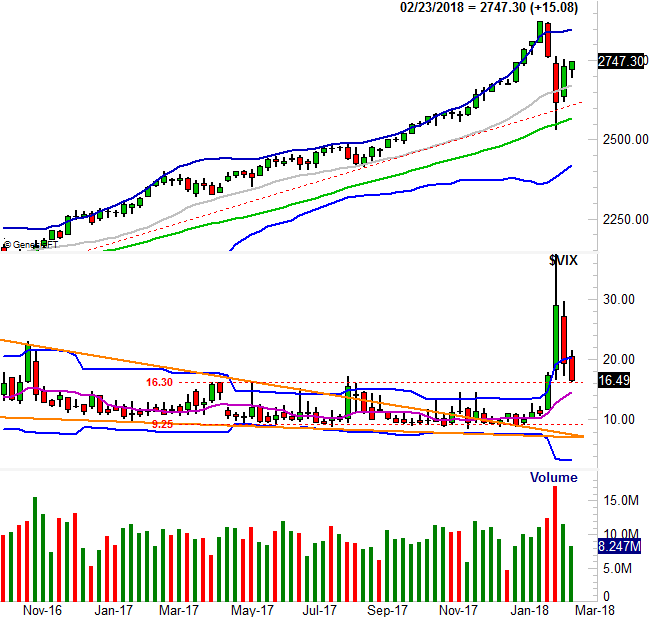
Source: TradeNavigator
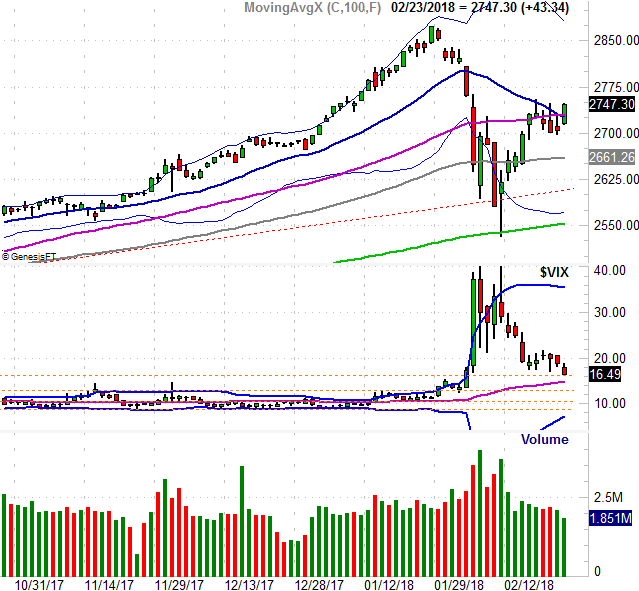
The daily chart of the S&P 500 adds a lot of detail to last week's bullish effort. Though the rally effort slowed down a bit when the 20-day moving average line (blue) was re-encountered earlier in the week, but the bulls finally punched through on Friday... clearing the 20-day and 50-day (purple) moving averages.
S&P 500 Daily Chart, with VIX and Volume
Source: TradeNavigator
The daily chart of the NASDAQ Composite more or less tells the same story.
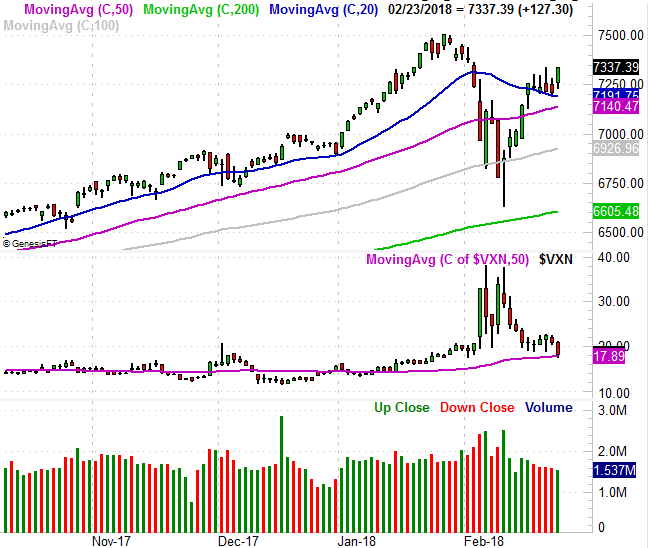
NASDAQ Daily Chart, with VXN and Volume
Source: TradeNavigator
All in all the bullish case is pretty solid. It's not perfect though. Notice anything missing from the recent rebound effort, and from Friday's bullishness in particular? The volume behind the rebound move has been minimal, and shrinking.
We've mentioned it before but it bears repeating now... rallies (and pullbacks) need strong volume and increasing volume to last. Otherwise, it's just a sign that people believe in the move less and less the longer it lasts. We've even drilled down into the data, separating the market's "up" volume from its "down" volume on a daily basis. That's what you see in the middle and the bottom of the chart below, respectively, for the NYSE's stocks (versus the S&P 500). The blue lines plotted on the daily volume data mark the underlying trend for each.
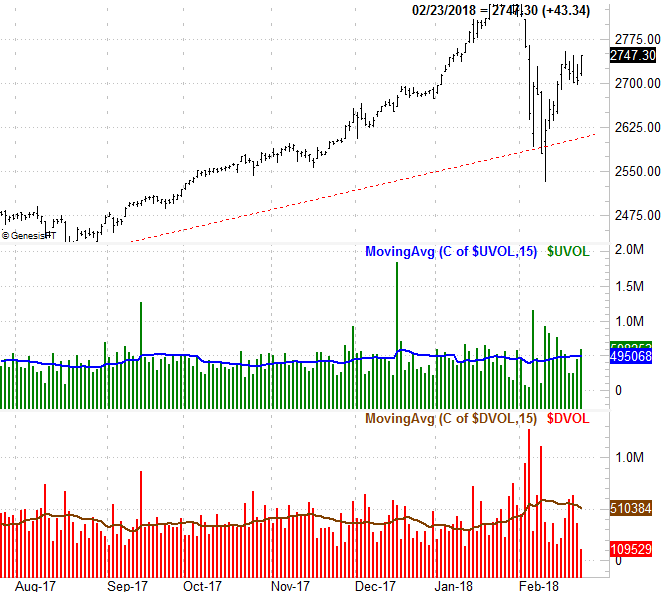
S&P 500 with NYSE Up and Down Volume
Source: TradeNavigator
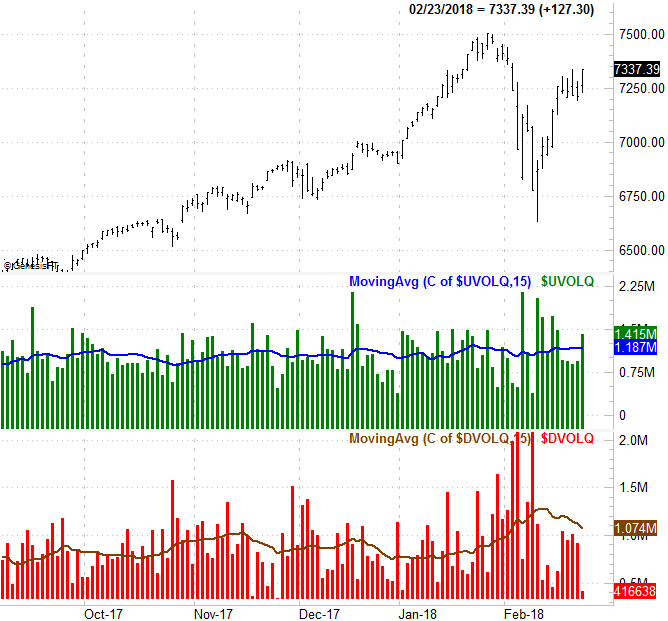
The NYSE's "up" volume hasn't been completely lacking of late, and made of the bulk of Friday's total volume. This dynamic hasn't been decidedly bullish since the rebound move started three weeks ago though. Ditto for the NASDAQ's volume, though for the NASDAQ we're seeing a little more bullishness on this front.
NASDAQ Composite with NASDAQ Up and Down Volume
Source: TradeNavigator
We have to give credence to the momentum, even if it's tepid bullishness. We'll also just say, though, that this still isn't a market you can turn your back on.
The ideal situation (for the bulls) is actually a modest lull back to the 20-day moving average ling -- give or take -- and then a renewal of the bullishness. That will confirm the rally is for real, by giving the bears a chance to pull the rug out from underneath it. If the market just continues to drift higher, the advance could still be easily tipped over.
You should also know that March is usually a bullish month for the market, and that bullishness tends to start taking shape near the end of February. And, it's not like the market is too overbought year-to-date to dish out the usual March bullishness. As we ended last week, that's the direction things are pointed.
Again though, you can't take your eyes off the market for a day in this tense environment.