Weekly Market Outlook - The Bulls Are (Still) Unstoppable

The bears just squandered their best chance to halt this rally in its tracks. Stocks fought their way to record highs early last week, and after wobbling for a bit in the middle of the week, rekindled long-standing bullishness to end last week on the highest of high notes... at another record high.
When will the music stop? Good question. This advance has lasted far longer than most traders have reasonably expected. Yet, we're now moving into an incredibly bullish time of year. It wouldn't be impossible for stocks to continue their charge here. Nevertheless, it wouldn't be a bad idea to continue keeping tabs on the market's most important technical floors; most of them rose this past week.
We'll look at all of it in some detail below, as we always do. First though, let's also do what we always do - look at last week's major economic announcements and preview what's on the calendar for this week.
Economic Data Analysis
We rounded out the real estate picture early last week, with a look at last month's new home sales and an update of home prices. Both were strong. New home sales ramped up to a pace of 800,000 units, mirroring the comparable increase in sales of existing homes last month.
New and Existing Home Sales Charts

Source: National Board of Realtors, Census Bureau, TradeStation
And, these homes sold at firm prices. Both the Case-Shiller index and the FHFA Home Price Index continued their tear into record-high territory, although the recent rally has reached alarmingly red-hot levels.
Home Price Charts
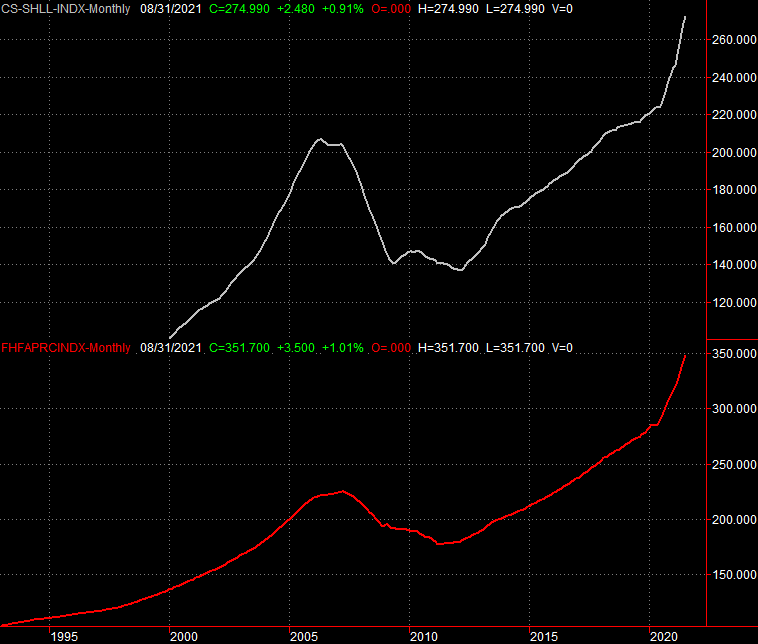
Source: Standard & Poor's, FHFA, TradeStation
Not that it matters (much), but both home price reports were as-of August and NOT for September. Regardless, this is bigger-picture data. One month isn't a game-changer either way.
While we're not charting it, note that the first look at Q3's GDP growth rate says it fell back from Q2's 6.7% to only 2.0%, falling short of expectations of 2.4%. Making any forecast in this environment is tricky, as we've never really had to guess as to what things should look like moving out of a pandemic-driven slowdown. But, this is not an encouraging figure. It can be revised upward next month, but revisions are rarely big.
Finally, last week we got our first and only look at the Conference Board's consumer confidence figure, and the third and final look at October's consumer sentiment score from the University of Michigan. The former moved upward, defying expectations for a slight decline. The University of Michigan's reading fell a bit from September's final score, however, to remain within sight of multi-year lows hit just a few weeks ago.
Consumer Sentiment Charts
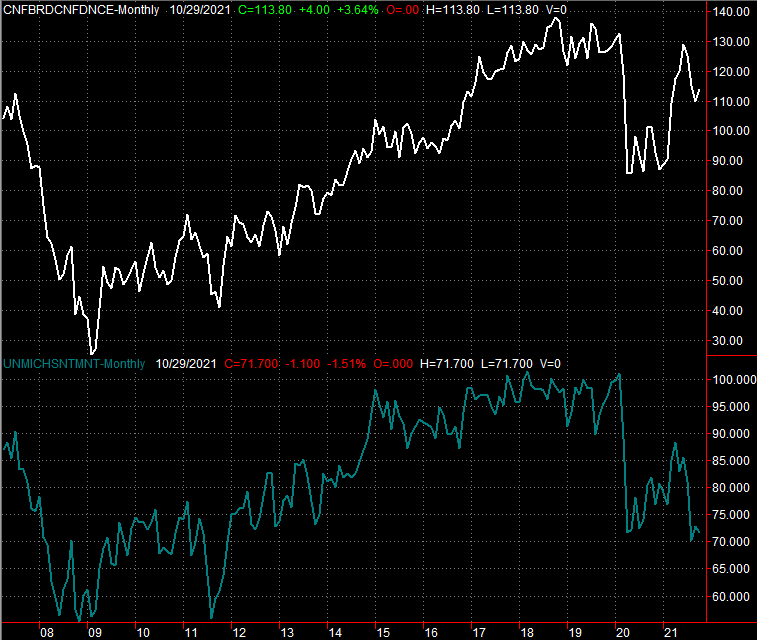
Source: University of Michigan, Conference Board, TradeStation
Simply put, there's no firm conclusion we can draw about how consumers feel right now.
Everything else is on the grid.
Economic Calendar
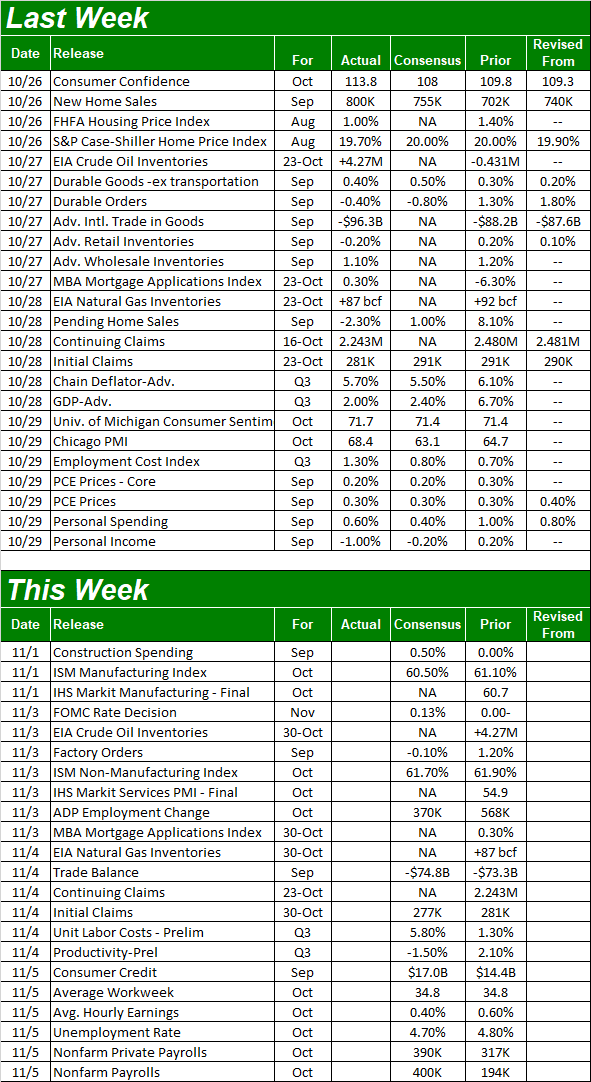
Source: Briefing.com
This week's pretty jam-packed too, ending with a jobs report that could make-or-break things for an already-fragile market. But, firs things first. Things will get busy right off the bat with Monday's ISM Manufacturing Index update, to be followed on Wednesday with the ISM Services Index report. Both of the figures are and should remain above the pivotal 50 level by a country mile. Manufacturing activity should fall slightly from September's reading, though services activity should edge a little higher.
ISM Manufacturing and Service Index Charts
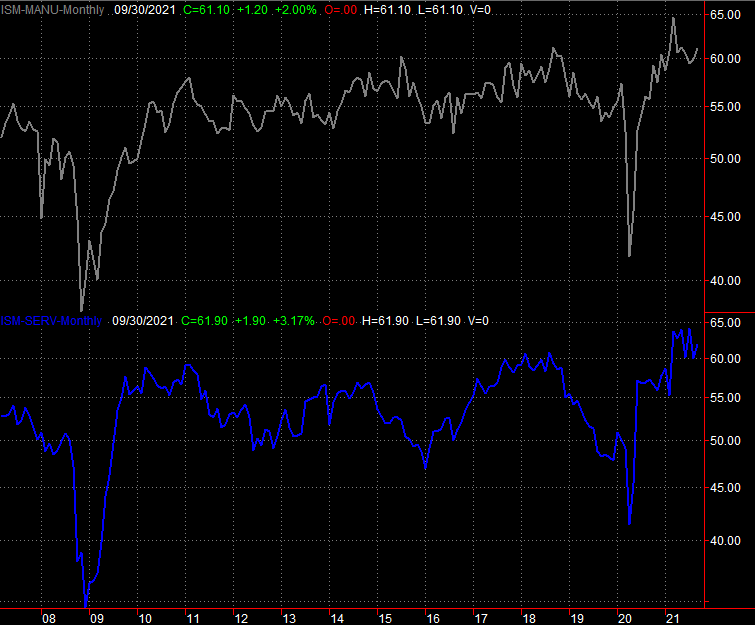
Source: Institute of Supply Management, TradeStation
That won't be Wednesday's biggest news, however. Rather, the FOMC is slated to make a call on interest rates that day. Don't look for a change... at least not yet. The futures market says there's a 100% chance the target Fed Funds Rate will remain between 0.0% and 0.25%, with the first plausible increase not coming until the middle part of next year. The language accompanying the decision, however, is sure to be scoured and scrutinized by traders looking for some sort of edge.
Then, buckle up for Friday's employment update from the Department of Labor. Forecasters are calling for the addition of 400,000 new jobs, accelerating September's tepid increase of 197,000. That should be enough to drive the unemployment rate down just a bit from 4.8% to 4.7%. Any shortcoming on this front, however, could be interpreted as disastrous.
Unemployment Rate and Payroll Growth Charts

Source: Institute of Department of Labor, TradeStation
Stock Market Index Analysis
The market overcame a headwind that started blowing in the middle of last week. But, it shrugged it off quickly enough. The S&P 500 managed to reach an all-time record high on Thursday to close at a record-high close, and then do the same thing again on Friday. Take a look.
S&P 500 Daily Chart, with VIX and Volume
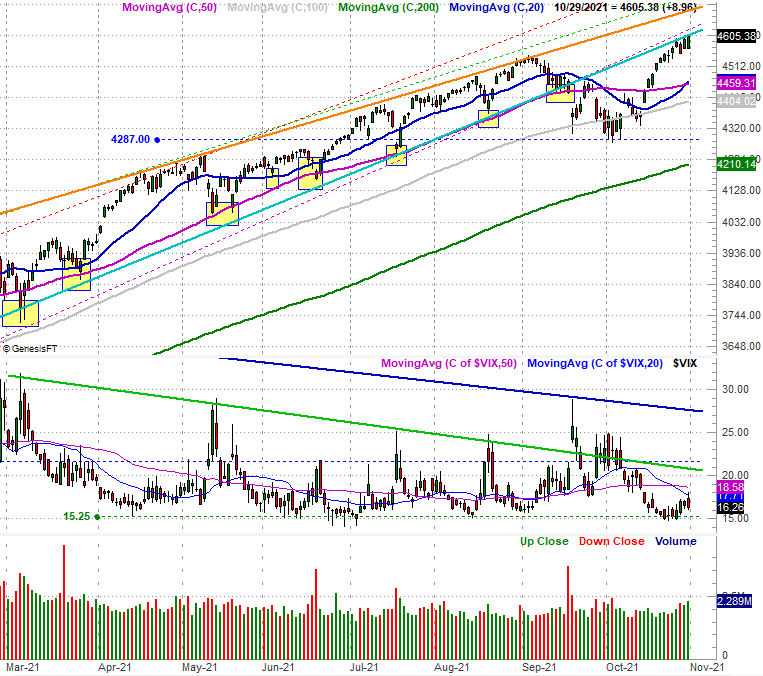
Source: TradeNavigator
Ditto for the NASDAQ Composite.
NASDAQ Composite Daily Chart, with VXN
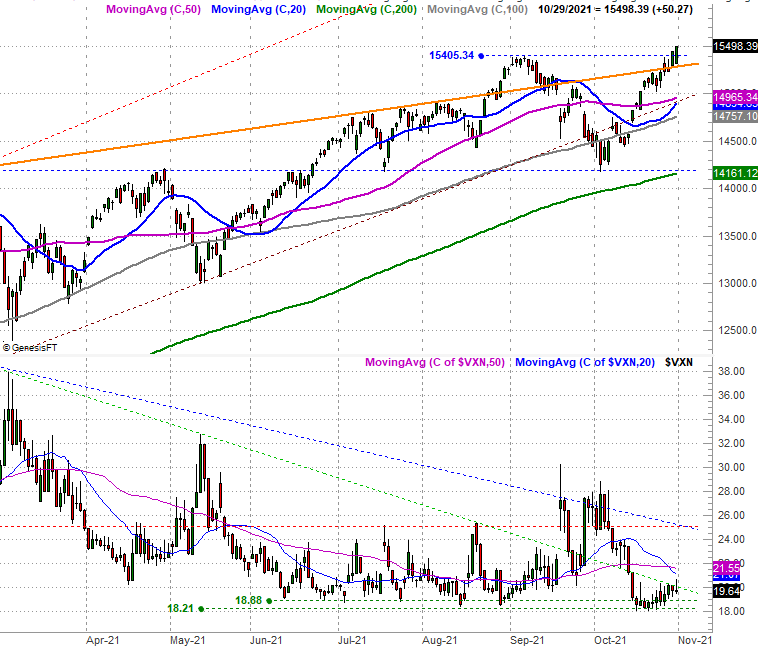
Source: TradeNavigator
Not everything is quite what it seems to be on the surface though. Namely, this rally isn't nearly as well supported -- or as well-balanced -- as it seems on the surface. There's not a great deal of participation in this bullishness as it seems on the surface, and there's only one type of stock actually making meaningful forward progress.
We've talked about this before, and for the most part it's not mattered... at least not yet. The unlikely rally continues to find a way to keep chugging along. An awareness of all the risks of riding the momentum train, however, is never a bad idea. Ergo, take a look at the S&P 500 in comparison to the NYSE's breadth (advancers versus decliners) and the NYSE's depth (up volume versus down volume) on the chart below. The number of stocks making daily forward progress ($ADV) isn't growing. In fact, it's started to ebb the last few days, while daily decliners ($DECL) are starting to grow. The same goes for the NYSE's total bullish volume ($UVOL) and its bearish volume ($DVOL).
S&P 500 Daily Chart, with NYSE Up/Down Volume and Advancers/Decliners

Source: TradeNavigator
How is that even possible? The explanation lies in another chart... a performance comparison of the market's styles and market caps. In other words, large caps versus small caps, and style versus value, in all of the possible stratifications. As the image below clearly depicts, since the mid-May low large cap growth stocks like Apple, Microsoft, and Alphabet are the only names to log real gains. Value stocks of all sizes, in fact, have lost ground. The gains that large cap growth stocks, in fact, have been so lopsided that this group alone has been strong enough to lift the entire market.
Market Cap, Style Grouping Performance (since 5/12)
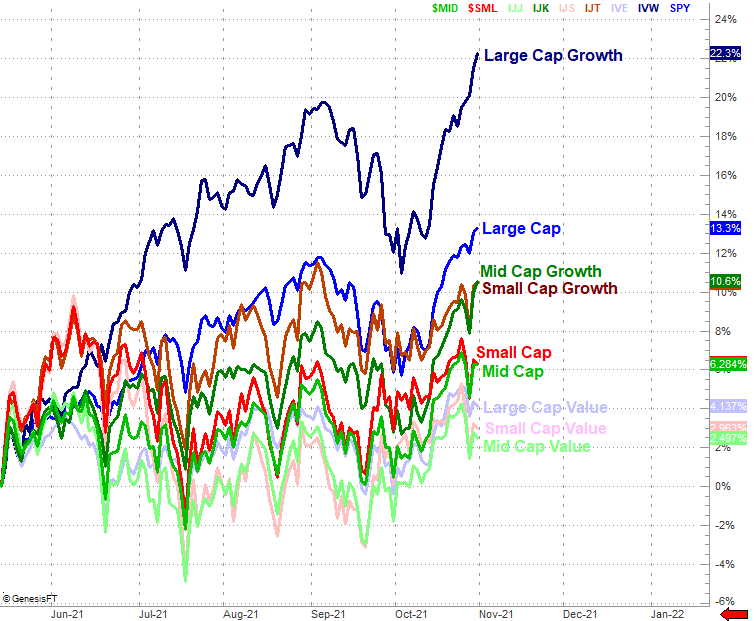
Source: TradeNavigator
Even so, the growth-stock-rich (and large-cap-led) NASDAQ Composite itself isn't even seeing terribly bullish breadth and depth. As the chart below shows us, the NASDAQ's advancers remain fairly anemic, and only slightly better than its decliners. Meanwhile, although the NASDAQ's bearish volume has fallen below trend for the past week, the NASDAQ's bullish volume has only been about half the bearish volume of late... and continues to dwindle.
NASDAQ Daily Chart, with NYSE Up/Down Volume and Advancers/Decliners
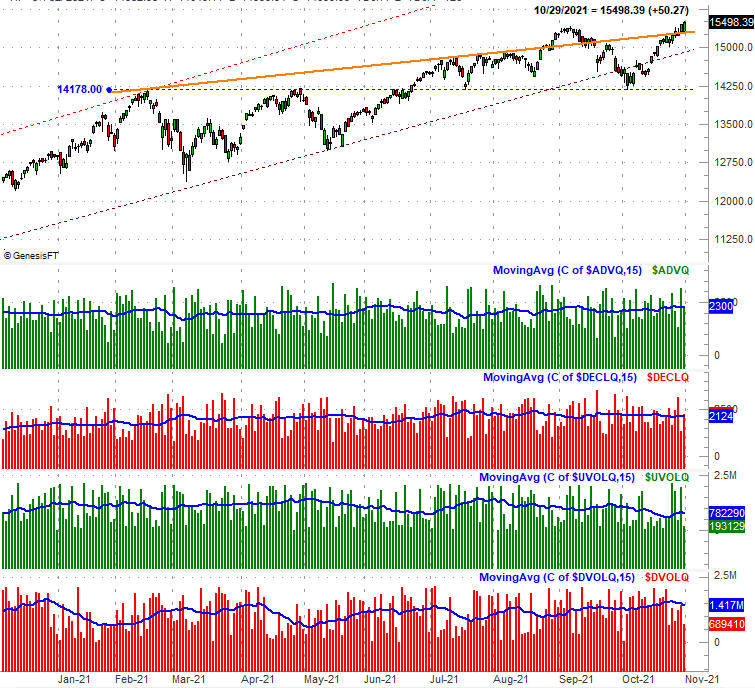
Source: TradeNavigator
The thing is, the flimsy underpinnings haven't been a problem for the market yet, and we're now starting what's usually the best two-month stretch for the market.
Do bear in mind there's room as well as reason for stocks to pull back a bit and then rekindle the rally... as it has for the better part of the past several months. The NASDAQ's 20-day and 50-day moving average lines are about to converge around 15,000, while the S&P 500's same moving average lines have already done so, around 4460. Those are the lines in the sand you'll want to keep in mind in the event of profit-taking. The undertow, however, is still bullish until further notice even though it arguably shouldn't be.