Weekly Market Outlook - The Bears Roar Again, But So Far, It's Just Noise

Last week was a loser, and a particularly big one given that we only had four trading days to do any damage to the market. All told, the S&P 500 fell 1.7% last week, marking the worst week for stocks since June.
And yet, as rough as it was, the bigger-picture rally is still intact. All of the most important technical floors for at least two of the key market indices? Those indices didn't even test them. We're only watching and waiting to see if this is the point that the weight of the market's gains since the middle of last year finally prove to be unbearable.
We'll take a look at the idea in some detail below. First though, let's look at last week's economic news and preview what's in store for this week.
Economic Data Analysis
The shortened trading week only gave us time for one piece of economic data, but it was an important one. We started a deeper dive into the inflation picture with last month's producer inflation rate. It was alarming to say the least. The overall input costs for the nation's factories grew 8.3% year over year... the biggest increase in many years. Even taking the volatile costs of food and fuel out of the picture, costs grew 6.3%.
Annualized Inflation Rate Charts
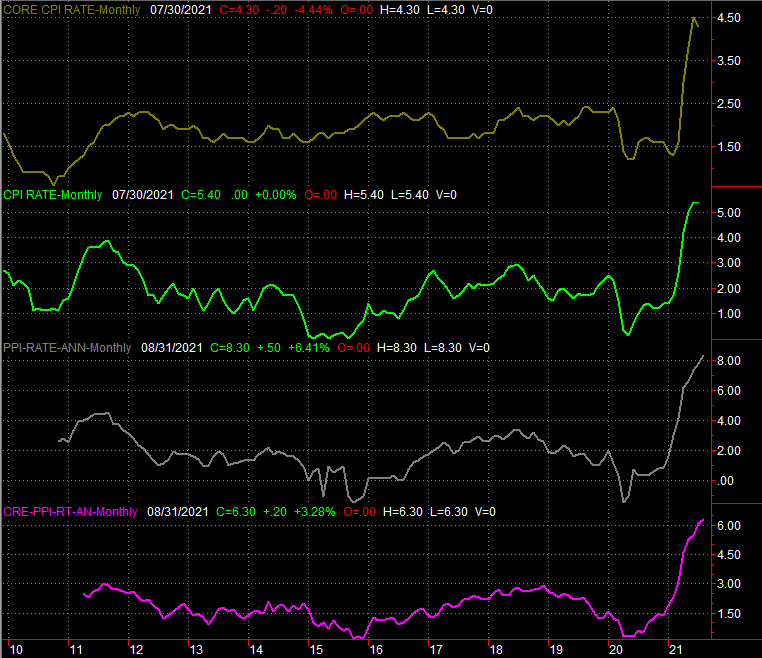
Source: Bureau of Labor Statistics, TradeStation
We'll get last month's update on consumer inflation this week, but don't look for the picture to be any different. The current annualized inflation rate stands at 5.4% (4.3% on a core basis), and economists are calling for the same pace of price increases for August that we saw in July... which should translate into an even-bigger annualized rate. Whatever's in the cards, rising prices are increasingly prodding the Fed into taking action.
Everything else is on the grid.
Economic Calendar
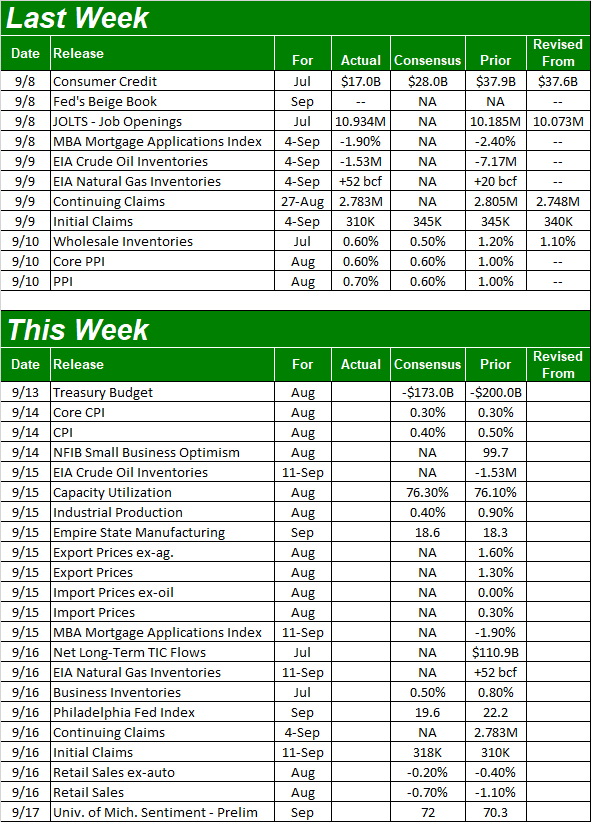
Source: Briefing.com
Aside from consumer inflation figures, we'll also hear about August's capacity utilization and industrial production this week, on Wednesday. Forecasters are modeling modest improvement on July's data, and that's an improvement on already-improving numbers. We're still not back to pre-pandemic levels, but we're moving in that direction. This typically translates into comparable corporate earnings growth.
Industrial Production and Capacity Utilization Charts
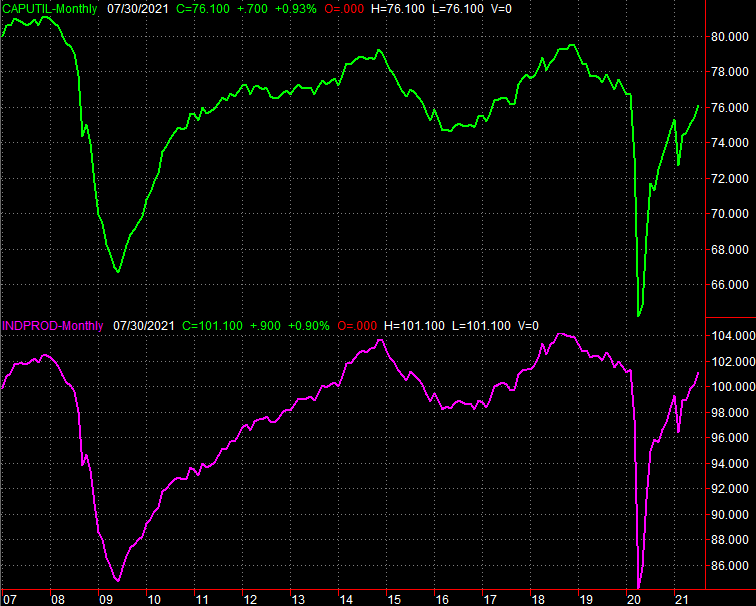
Source: Federal Reserve, TradeStation
The biggie for this week, however, is Thursday's retail sales report. Economists are looking for another lull, even if not as weak as July's contraction. Just bear in mind these are comparison being made to spending seen earlier in the year, which surged after several months of suppressed consumerism stemming from last year's shutdowns. Spending is still well above last year's levels as well as levels seen two years ago. Nevertheless, the trend's direction matters.
Retail Sales Charts
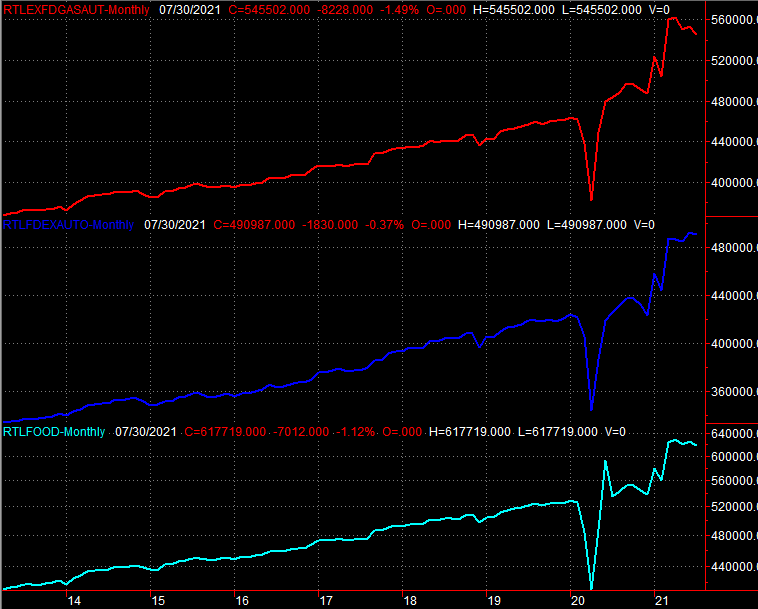
Source: Census Bureau, TradeStation
Stock Market Index Analysis
While Friday's sizeable setback translated into the worst week in the past several weeks (despite only four trading days to it), the market - the S&P 500 in particular - is still above its most important technical floor currently near 4436. That's where the 50-day moving average line (purple) is converged with the lower boundary of the rising converging wedge shape that's been steering stocks higher since March. Ergo, the rally is still alive.
S&P 500 Daily Chart, with VIX and Volume
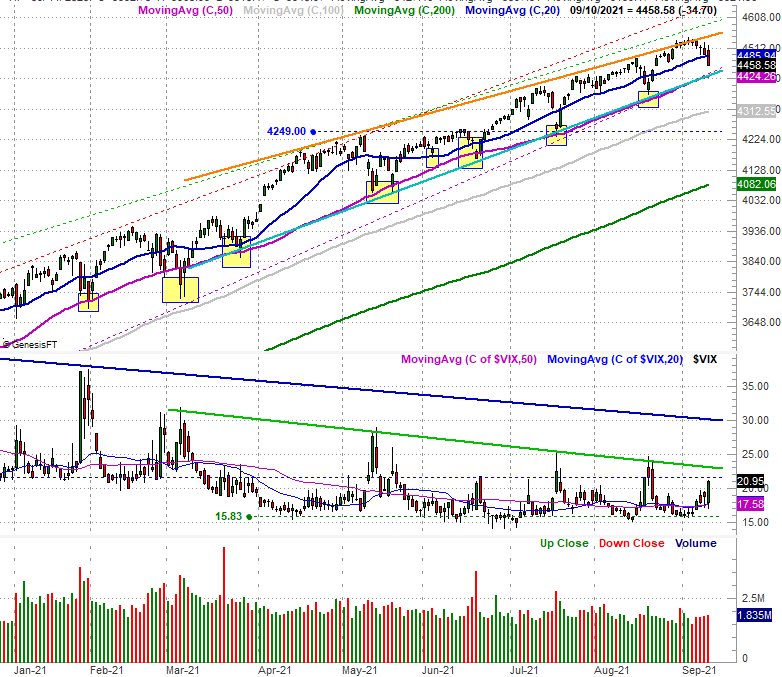
Source: TradeNavigator
There's a huge "but" that taints this bullishness though.... two of them, actually.
One of them is the pace and scope of Friday's tumble. We've seen bad days before, but we've not seen a day this bad in some time. And, while the headlines were concerning, they weren't exactly surprising and alarming. It looks as if the bears were ready to pounce. If that's the case, they may have more axe to grind, which may well pull the S&P 500 under that big-time floor. The VIX also made a firm upward thrust, which we also haven't seen in some time. That too implies the sellers were more than a little ready to tap the brakes, so to speak, and perhaps start testing the waters for some more prolonged profit-taking.
The other "but" to the otherwise-bullish undertow is the volume behind last week's action. While not explosive, the selling volume behind all four bearish days last week was not only above average, but grew a little every day. More and more sellers are, as we put it, testing the waters.
Here's the weekly chart of the S&P 500 for some more perspective on the rising wedge pattern.
S&P 500 Weekly Chart, with VIX and Volume
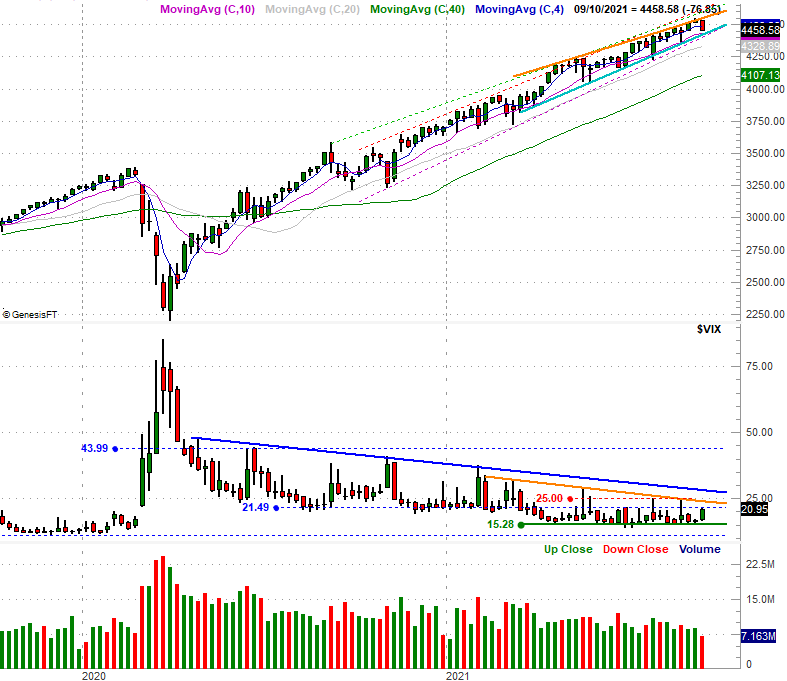
Source: TradeNavigator
The same basic ideas apply to the NASDAQ Composite's daily chart, although it's considerably less structured than the S&P 500's daily chart currently is. Friday's setback decidedly brings a quick end to what looked like a pretty juicy breakout just a week earlier. The VXN made a pretty solid upward move as well. Of course, neither the VXN nor the NASDAQ actually broker above its key ceiling at 23.85 or its key floor at 15,060 (respectively). Note the NASDAQ also remains above a major confluence of support currently at 14,335, and rising.
NASDAQ Composite Daily Chart, with Volatility Index
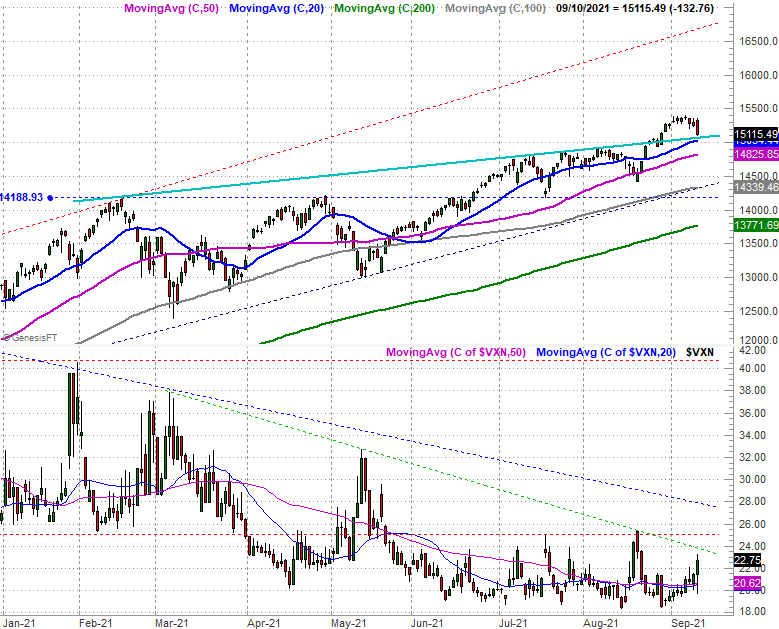
Source: TradeNavigator
What's curious, however, is that we actually did see one key index break under an important technical floor. It's just not one we typically look at in the Weekly Market Outlook. That index is the Dow Jones Industrial Average. As the chart below makes clear, the blue chip index broke under a key support line (red) at 35,180 early last week, and never looked back. In fact, as of Friday the Dow was putting pressure on its 100-day moving average line (gray) for the first time since July, and really, seriously for the first time in months.
Dow Jones Industrial Average Daily Chart, with Volume

Source: TradeNavigator
Does it matter? Maybe. Maybe not. It is a red flag though, perhaps indicating that people are starting to turn in the highest-caliber blue chips. If that's the case, the more aggressive and riskier names (read "NASDAQ stocks") may well be next.
Whatever the case, we're still eyeing the same thing we've been eyeing for the past several weeks - the S&P 500's technical floor at 4433 and the VIX's ceiling at 23.2. It's just that after Friday, pushing past those barriers seems much more likely than it did a week ago.