Weekly Market Outlook - The Bears Just Can't Land a Punch That Hurts Enough

The strong finish to the week wasn't enough to offset the even-bigger selloff suffered on Tuesday and Wednesday. All told, the S&P 500 tumbled nearly 0.6%, seemingly feeling the weight of a rally that began all the way back in March of last year.
And yet, the rally ultimately remains intact. The bulls pushed back when and where they absolutely had to.
That's not necessarily a call to step in here. A correction is more of a process, and it will take several steps to get started if that's what's in the cards. Last week's lull and partial bounceback is just the bulls and the bears testing each other's' conviction. That testing isn't over yet. At least it's started (again) though, which is something worth watching.
We'll take a detailed look at what's going on below, as we always do. First though, as we also always do, let's recap last week's biggest economic announcements and preview what's coming this week.
Economic Data Analysis
It was a busy week in terms of economic news last week... and a mixed one. Factories and manufacturers seem to be doing a bit better than consumers are doing.
We're judging the health of the country's industrial engine based on July's capacity utilization and industrial production figures. Economists expected another month of improvement, and they got it. But, they got even more than expected. Capacity utilization cranked up from 75.4% to 76.4%, while the industrial production index grew 0.9% to 101.1. Both are the highest readings we've seen since the pandemic took hold; they're also both within sight of levels seen just before the pandemic took hold, suggesting we're nearing a "back to normal" situation.
Capacity Utilization and Industrial Productivity Rate Charts
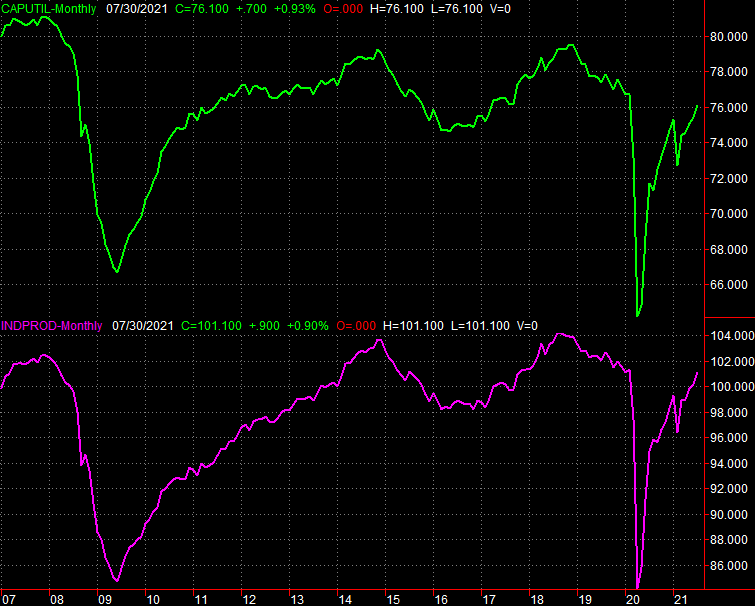
Source: Federal Reserve, TradeStation
Consumers aren't quite on board with the same growth though, in a couple of ways.
The first of them is on the real estate front. The wave of demand for homes (new and existing) cooled off, and isn't fully rekindling. Building permits improved from a pace of 1.59 million to 1.63 million, but that's still well below January's peak of nearly 1.9 million. Starts fell from 1.65 million to 1.53 million, logging another move lower that's part of a bigger-picture slowing. That's despite falling lumber prices that were such a big problem a couple of months back.
Housing Starts and Building Permits Charts
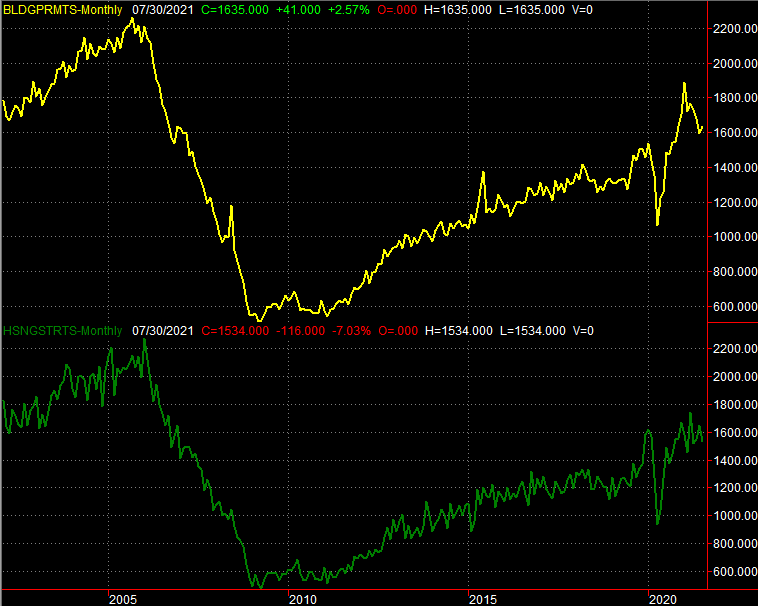
Source: Census Bureau, TradeStation
Retail sales fell too, by all stratifications including measures that remove restaurant and gasoline sales from the tally.
Retail Sales Charts

Source: Census Bureau, TradeStation
In some ways this could have been expected. March's explosive growth was linked to the early proliferation of COVID-19 vaccines; bored consumers were just happy to get out and do anything. That swell couldn't last though. Still, the slow dwindling of that demand in the meantime leaves investors wondering if there's a more serious slowdown in consumer spending that's brewing. Just bear in mind that even if retail spending continues to fade, it will still be "above the trend" established before early 2020.
Everything else is on the grid.
Economic Calendar
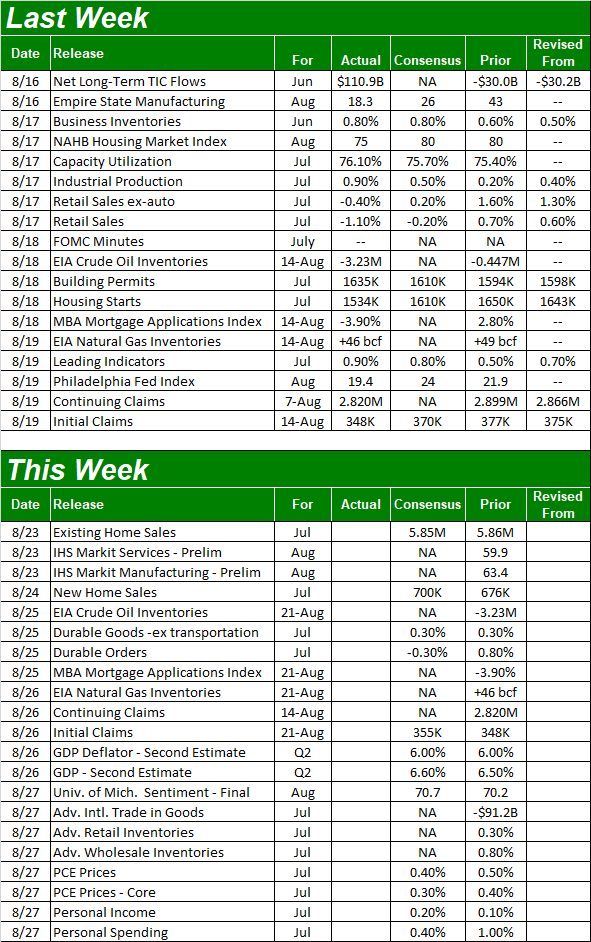
Source: Briefing.com
There are only two (related) items we're interested in this week. That's Monday's existing home sales and Tuesday's new home sales figures. This will round out last week's starts and permits reports. Economists are looking for about the same 5.86 million sales of existing homes, though they're also calling for a slight acceleration in sales of new homes, from a pace of 676,000 houses to 700,000. The latter would be a victory, but only a small one given how much demand was in place around the middle of last year. And, in a similar fashion, merely matching June's existing home sales rate wouldn't even come close to bringing us back to the go-go days of late last year.
New, Existing Homes Sales Charts
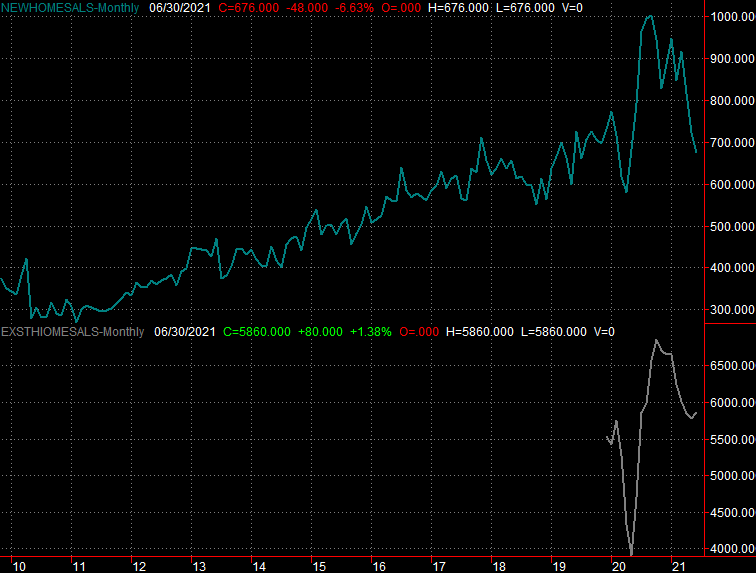
Source: National Board of Realtors, Census Bureau, TradeStation
Stock Market Index Analysis
We're going to shake things up just a bit this time and start our technical look at the market with a weekly chart of the S&P 500. Why? One key reason -- perspective. It's in this timeframe we can see how the index explored the entire span of the narrow range between the upper boundary (orange) and lower boundary (light blue) of a converging wedge pattern that ultimately extends back for several months; the dashed lines are also frames for the rising, triangle-shaped pattern. It's in this timeframe we can also see the Volatility Index (VIX) explored the fullness of its narrowing trading range as well.
S&P 500 Weekly Chart, with VIX and Volume
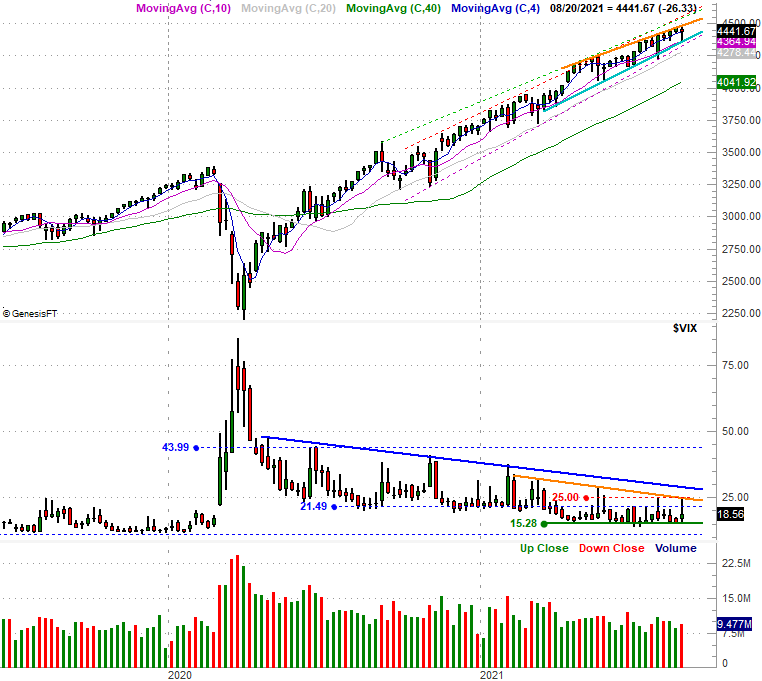
Source: TradeNavigator
So what's it mean? Not really a whole lot... yet. The technical support held up as a floor. But, the test itself is telling. Although the S&P 500 ended up pushing up and off of it, the fact that it's being tested at all indicates a degree of doubt. Breakdowns tend to be processes rather than events, and this is the sort of action one would expect to see at the beginning of a breakdown.
Of course, that's a point that's been made a bunch of times since late last year, each time to no avail.
The weekly chart of the NASDAQ Composite looks similar, though not identical. The NASDAQ didn't test its major technical floor, and remains closer to its recent technical ceiling (light blue). But, it's clearly unable or unwilling to put itself back on the pace it was on coming out of last March's COVID-inspired meltdown.
NASDAQ Composite Weekly Chart, with VXN
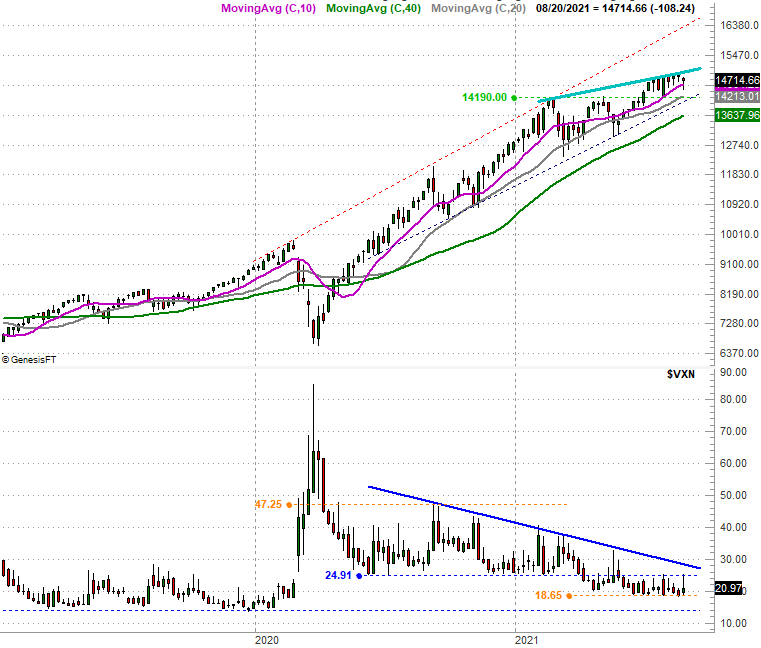
Source: TradeNavigator
Or, one could look at the NASDAQ's weekly chart another way and conclude after last week's lull and recovery effort that it's spring-loaded and finally ready to punch through that technical ceiling currently at 14,956.
Here's a zoomed-in view of the NASDAQ -- in the form of a daily chart -- to flesh out some key details. One of the most noteworthy of these details is the convergence of technical support around 14,145 (highlighted). It wasn't even tested last week, but is clearly shaping up as the pivotal support area should the bears end up taking a bigger bite out of stocks.
NASDAQ Composite Daily Chart, with VXN

Source: TradeNavigator
Finally, here's the daily chart of the S&P 500. All the times the index found support at the lower boundaries of the rising, converging wedge pattern are highlighted. What we want to hone-in on here, however, is the S&P 500's Volatility Index (VIX). After surging on Wednesday, the rug got pulled out from underneath of it on Friday when the market rebounded.
S&P 500 Daily Chart, with VIX and Volume
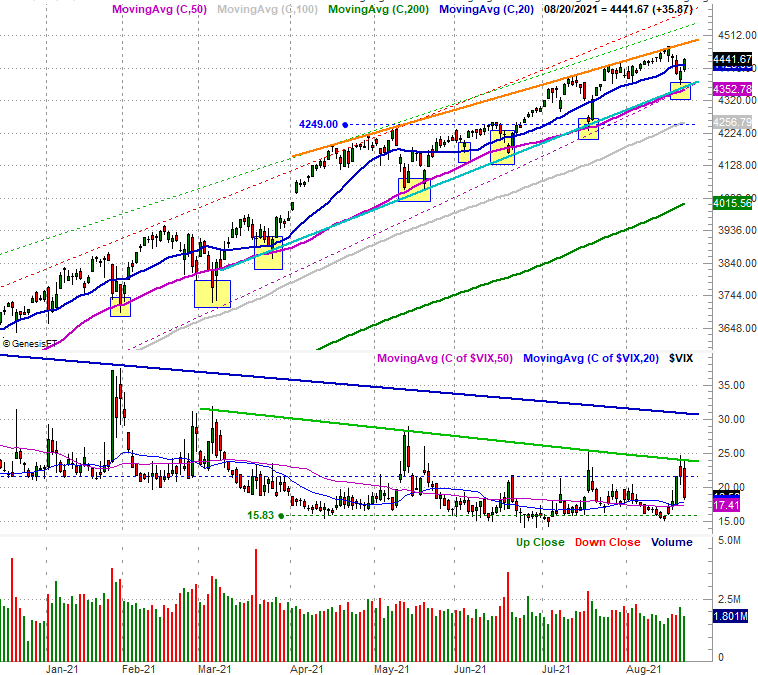
Source: TradeNavigator
So, let's connect the dots.
The rally is still clearly alive despite last Wednesday's (and into Thursday) tumble. But, the most important lines in the sand continue to become better defined.
Notice, however, that at least for the S&P 500 the trading range continues to narrow. Indeed, its current span from high to low is only about 3% of the index's current value. That's not much room to maneuver. And big thrust in either direction would push the S&P 500 out of its wedge confines, leaving traders guessing as to what stocks have planned.
Also bear in mind that being just a week away from starting one of the market's worst months -- September -- a break below the floor currently at 4355 (for the S&P 500) could easily snowball into a bigger corrective move. Such a breakdown of course would have to be marked by the VIX finally moving above its ceilings at 24 and then again at 30. Until then, onward and upward.