Weekly Market Outlook - Stocks Go 0 for 3 (and that's not even the worst of it)
For a third week in a row the market lost ground, easing into its usual September swoon that typically starts in August. Thanks to last week's 3.3% pullback, the S&P 500 now sits nearly 9.3% below its August peak, and seemingly reaching for lower lows. The most bullish aspect of the action is the speed at which it's all unfurled -- we may be due for a sympathy bounce here. The question is, will it last?
We'll dissect it all in detail below. First though, let's recap last week's biggest economic announcements and preview what's coming this week. Spoiler alert: The jobs report for last month is a bit vexing.
Economic Data Analysis
Mirroring the third and final look at August's University of Michigan Sentiment measure, the Conference Board's consumer confidence score for last month also shot higher from July's deep lows. Makes sense.... sort of. The market bounced (and the world didn't end) in July, bringing people a bit back from the brink. Stocks have been falling since the middle of August though. Perhaps the sentiment readings started being taken before the bulk of the pullback took shape. Regardless, overall sentiment remains relatively low.
Consumer Sentiment Charts
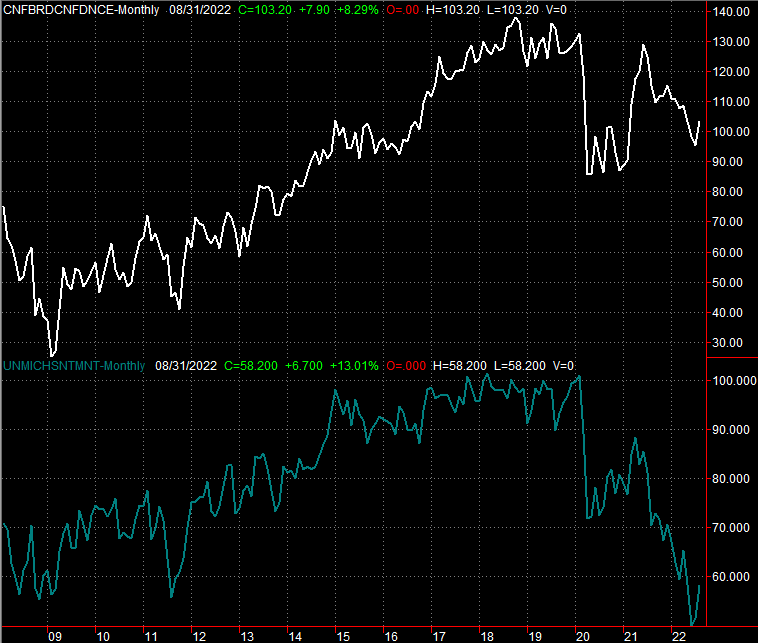
Source: Conference Board, University of Michigan, TradeStation
Home prices continue to rise, but as we've warned was looming, the pace of progress has been set to slow. Now it's clearly doing so. The FHFA Housing Price Index, in fact, almost slowed to a crawl, and the Case-Shiller Index isn't exactly screaming anymore as of last month's update. And bear in mind these figures are for June. Much has happened -- for the worst -- in the meantime.
Home Price Charts
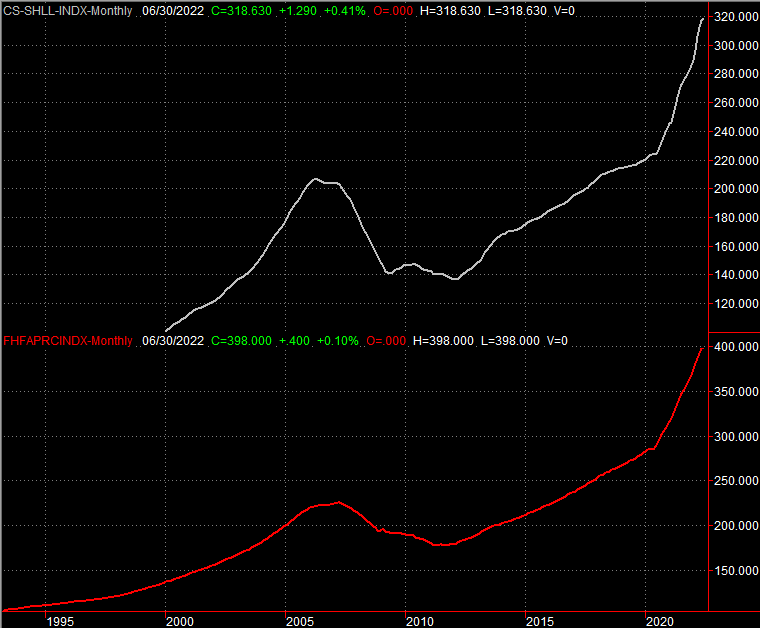
Source: Standard & Poor's, FHFA, TradeStation
Last week's big Kahuna was of course Friday's jobs report. It was... meh. New payrolls of 315,000 beat expectations of just 300,000. More notably though, that pace of payroll growth fell from July's pace of 526,000. Most notable of all, however, the unemployment rate swelled from 3.5% to 3.7%.
Payroll Growth and Unemployment Rate Charts

Source: Bureau of Labor Statistics, TradeStation
It's a surprising report that merits some explanation. Simply put, the unemployment rate is a comparison of the number of individuals officially unemployed compared to the number of people officially in the labor pool, claiming to be willing and able to work. Last month's labor pool grew, but the number of people unemployed jumped by even more as corporate layoffs and downsizing start to make an impact on these numbers. Specifically, the number of unemployed individuals jumped from 5.67 million to 6.01 million.
Everything else is on the grid.
Economic Calendar
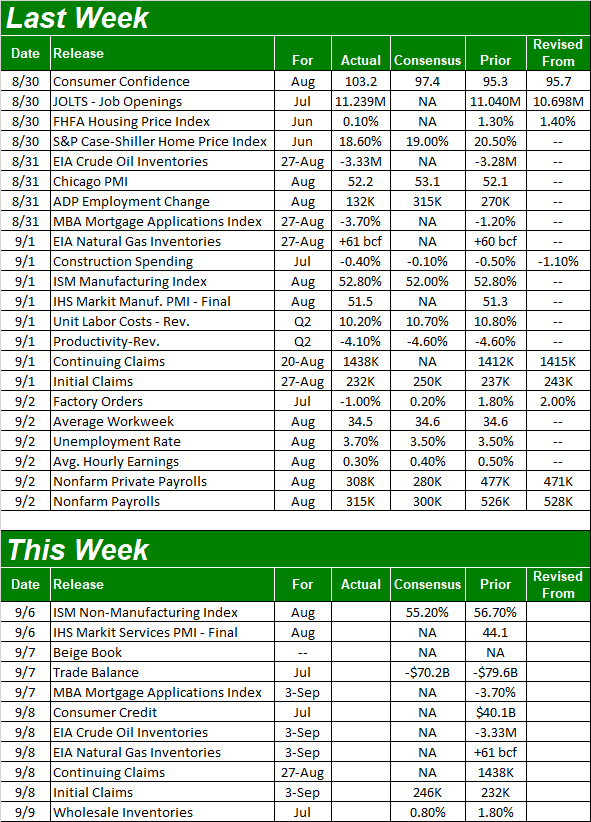
Source: Briefing.com
The only item of any real interest this week is Tuesday's look at the Institute of Supply Management's measure of activity for services industries. Last week's ISM Manufacturing Index update for August was more or less in line with expectations, as well as July's level. At 52.8% though, it's not exactly screaming; the 50.0 line is the make-or-break level. The ISM Services Index is a little firmer at 56.7% for July, and is expected to hold near there at 55.2% this time around.
ISM Manufacturing and Services Index Charts
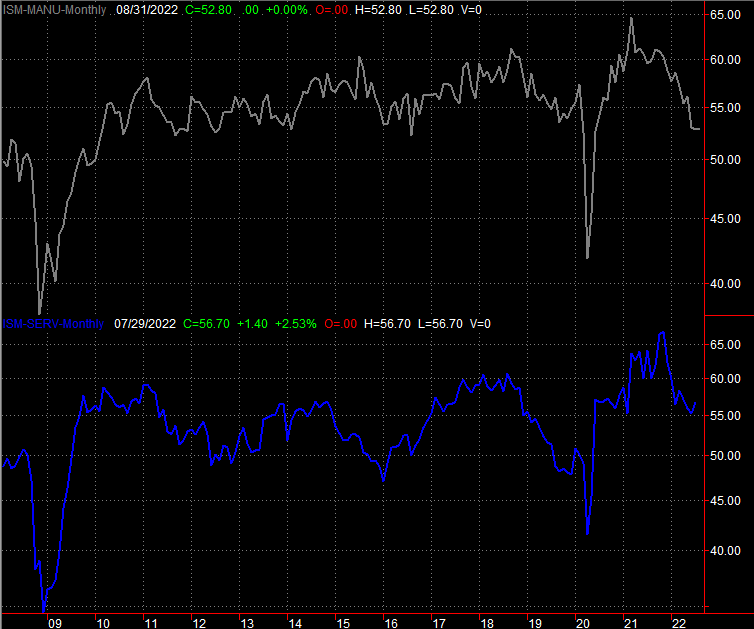
Source: Standard & Poor's, FHFA, TradeStation
Note that indexes are nowhere near as robust as they were just a few months ago, seemingly in bigger-picture downtrends.
Stock Market Index Analysis
Last week we lamented the fact that just on the cusp of a technical rebound, the rug got pulled out from underneath the market. Specifically, just when the NASDAQ Composite was on the verge of breaking back above its 20-day moving average line at 12,682, last Friday's drubbing carried the composite to its lowest low and lowest close in three weeks. There was still one last chance of a rebound effort being made. But, it didn't happen. The bears continued to chip away at stocks all last week, continuing to drag the NASDAQ under other key technical support lines like key moving average lines and -- most notably -- a rising support line (orange, dashed) that had connected several key lows since June's reversal.
NASDAQ Composite Daily Chart, with VXN

Source: TradeNavigator
The NASDAQ's volatility index (VXN) also pushed up and off of its 50-day moving average line (purple). It really needs to bounce back above last week's high of around 34.0 to really underscore the increasing bearishness here. But, the stage is set for that very thing.
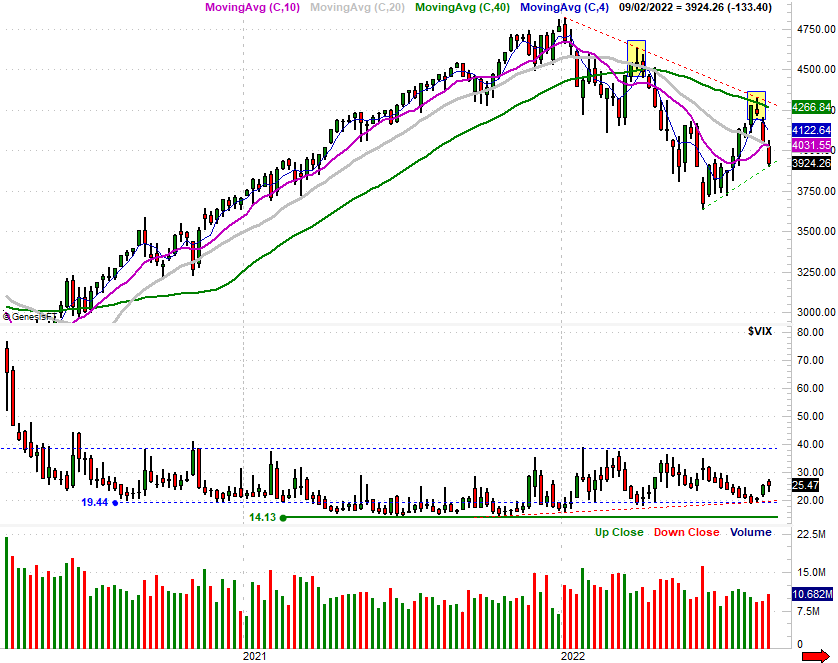
The S&P 500's daily chart is similar, though not identical. It too pulled under its 50-day moving average line at 4020, and clearly tested that line as a ceiling with Friday's strong open... an open that ultimately preceded a move to the lowest close in weeks. As the daily chart of the S&P 500 also shows us though, the index is finding a floor at the support line (green, dashed) that connects all of its key lows going back to June's low, which was the pivot.
S&P 500 Daily Chart, with VIX and Volume
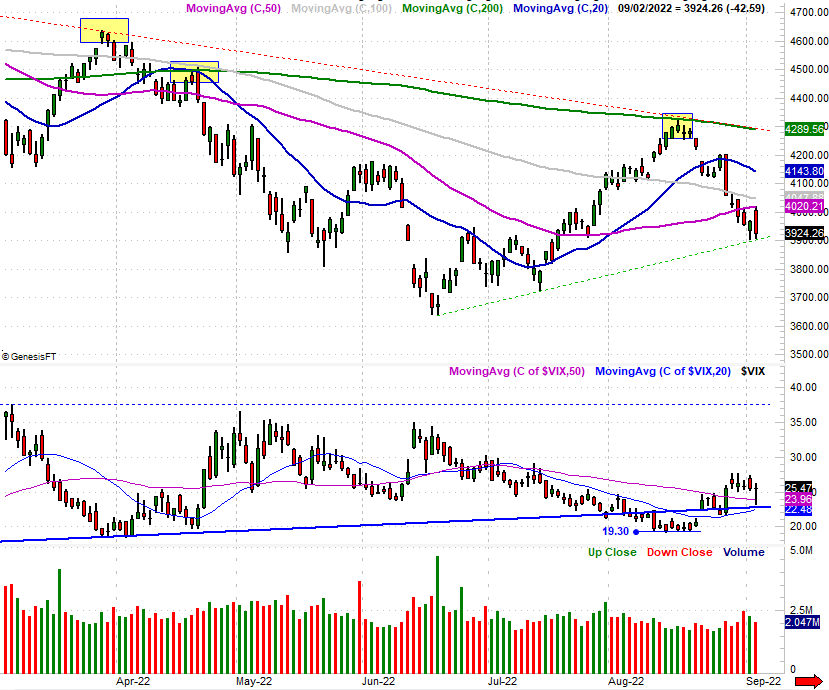
Source: TradeNavigator
Nothing really changes when you back out to look at the weekly chart of the S&P 500. This vantage point is telling all the same though, showing the depth and speed of the reversal that took shape when the index bumped into the 200-day moving average line (green) as well as a major technical resistance line (red, dashed) that connects all the highs going back to January. The weekly chart also clarifies that the S&P 500's Volatility Index is on the rise after pushing up and off of a slightly-rising support line. And, it's got plenty of room to keep on rising.
S&P 500 Weekly Chart, with VIX and Volume
Source: TradeNavigator
None of this action is terribly surprising. This is usually a bearish time of the year for the market anyway, with September more likely to be a loser than a winner. It's arguable traders were mentally planning on weakness here anyway, particularly after the summertime rally set up plenty of profit-taking opportunities.
The one thing that could help here, ironically, is the sheer speed of the pullback. The S&P 500 has lost more than 9% of its value in just three weeks, which already has some would-be buyers thinking about jumping in. Don't be too quick to jump on what seems like a freshly-departing bullish bandwagon though. It's more plausible the majority of the market's participants are content to let this weakness run its full calendar-based course though, with new bullishness taking shape in October as it usually does.
The nice part is, there are lots of clear lines in the sand to mark the market's key technical milestones here.