Weekly Market Outlook - Stocks End 2017 on Less Than a High Note
We warned you a week ago that there wasn't much of a Santa Claus rally leading up to the Christmas break, which was unusual. Rather, the brunt of the typical year-end rally materialized in the two weeks prior to the week leading up to the holiday, leaving little to no room for buying between Christmas and New Year's Day. Sure enough, we logged a small loss last week after doing nothing but moving sideways the week before. We should have seen stocks roaring higher.
 A bearish omen heading into the new year (particularly with tax cuts now in effect)? It's not a great sign, to be sure, but hardly the end of the world. Indeed, there's really no telling what kind of mood investors are going to be in to get 2018 started until we see a couple of days worth of trading.
And even then we won't really know. Stocks tend to start a new year on a bullish foot no matter what, but merely drift until late January. Working in favor of stocks is earnings growth, and working against the market is an extreme valuation that may not be justified even if 2018 is as fruitful -- earnings-wise -- as many expect it to be.
We'll look at the fork in the road below, and the stumble, below... after a run-down of last week's and this week's economic news.
Economic Data
As far as economic news goes, last week offered little. Perhaps it's all for the best, as investors were distracted by holidays at the beginning and end of it. Still, there are a couple of times worth exploring, even if they weren't market-moving at the time.
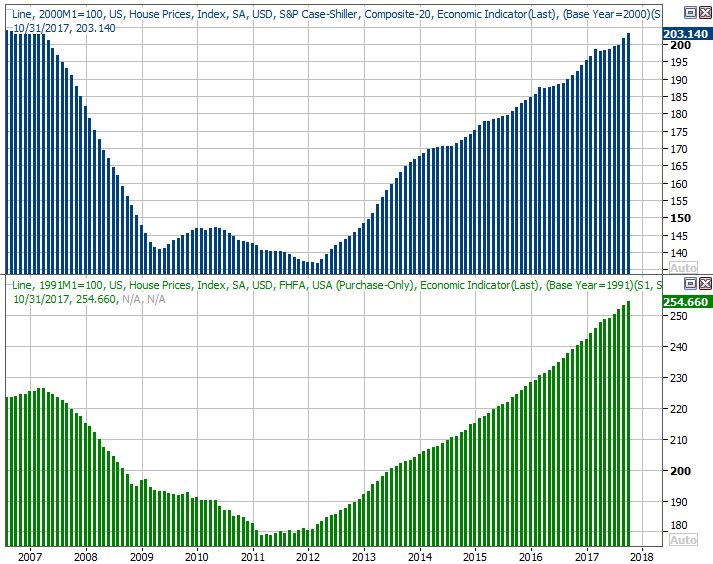
The first of those is October's S&P Case-Shiller Home Price Index, which topped already-lofty expectations of 6.3% year-over-year growth by swelling 6.4%. This rounds out the look at home prices that was started a week earlier with the FHFA Housing Price Index for October, which more or less indicated the same thing - the uptrend is still in motion, and accelerating.
Home Price Charts
Source: Thomson Reuters Eikon
It's not clear to what extent (if any) new tax laws prompted the wave of purchases that pushed prices much higher. Maybe it was the ages-old reason of a better economy translating into better-paying jobs. We'll remind you also that inventory of homes for sale remains pitifully low, so buyers are being forced into bidding wars on some fronts. Perhaps it was a combination of all three factors. Whatever the case, the trend remains impressive.
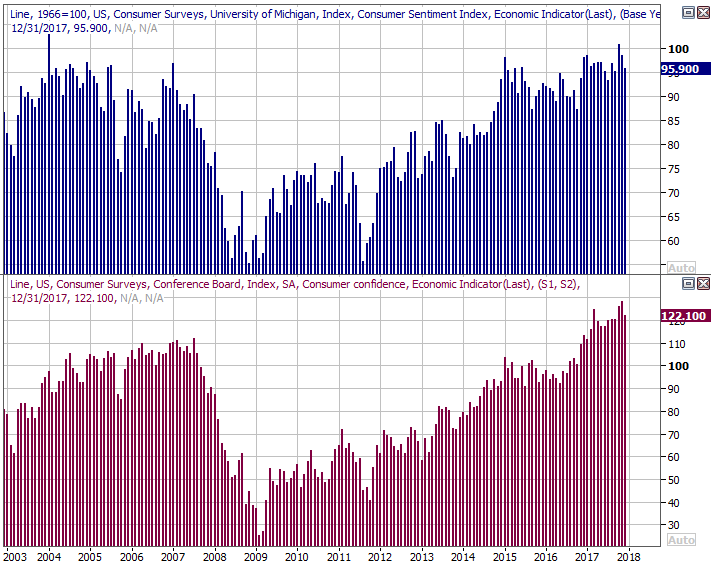
It was also a big week for consumer confidence levels. Though December's reading from the Conference Board was down a bit from November's levels, sentiment remains stunningly high. Ditto for the comparable Michigan Sentiment Index.
Consumer Sentiment Charts
Source: Thomson Reuters Eikon
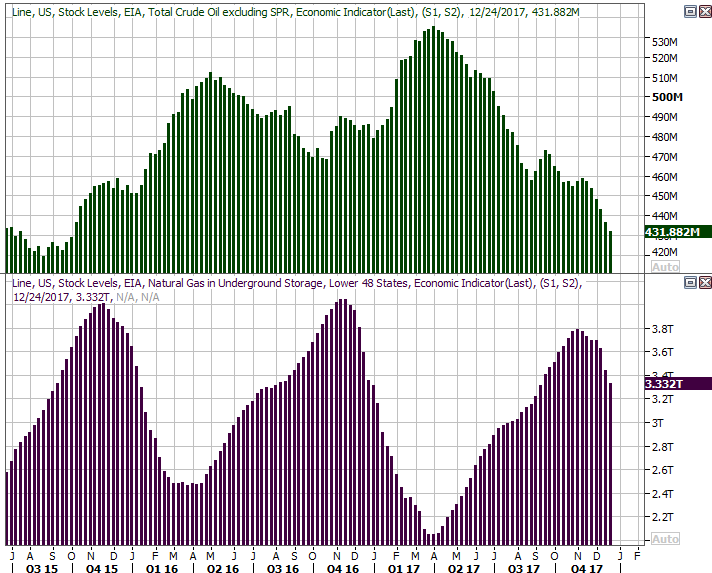
Finally, though it was largely expected, crude oil stockpiles once again fell sharply, extending a downtrend that got going in earnest months ago. It's worth noting that crude prices began to rise in earnest around that time too, with some help from the falling value of the U.S. dollar. Natural gas levels are falling pretty quickly too.
Crude Oil and Natural Gas Stockpile Charts
Source: Thomson Reuters Eikon
Everything else is on the grid.
Economic Calendar
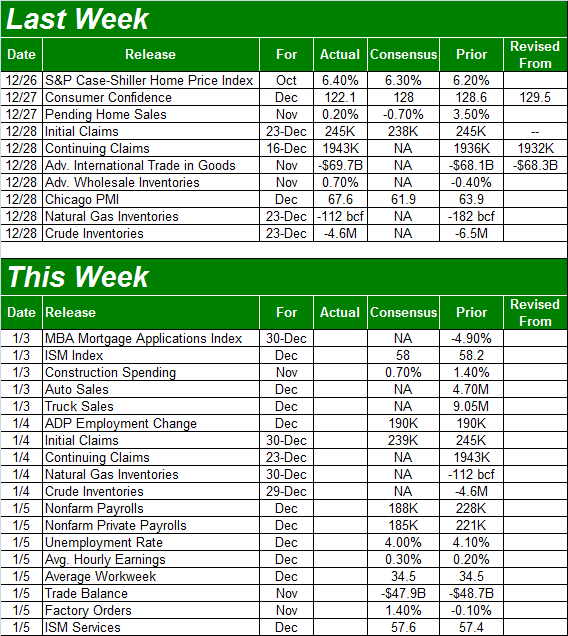
Source: Briefing.com
While this week is also going to be a short one, there's still more than the usual amount of economic news to work through.
Starting and stopping the data flow will be ISM numbers. The ISM Manufacturing Index will be posted on Wednesday, and the service-oriented version of the index will be posted on Friday. The pros are more or less expecting the same for December what they saw in November, but November's readings were quite good. Both remain well above the critical 50 level.
ISM Index Charts
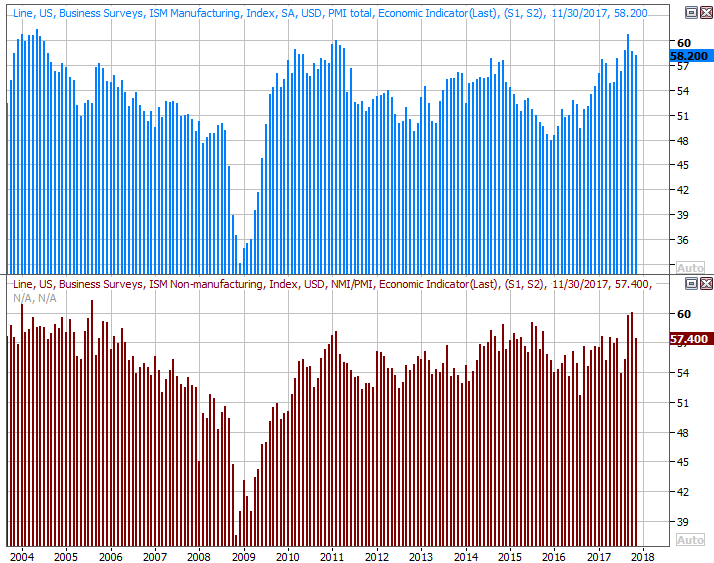
Source: Thomson Reuters Eikon
Also on Wednesday we'll hear about December's auto sales. They're still above the norm thanks to September's hurricanes, which at first prompted the purchase of trucks to help with the rescue and rebuild effort, and were then prodded by insured-replacement purchases. There's apt to be some lingering effect of the same this far out, but it's clearly subsiding. It'll be interesting to see if that purchase surge also serves as something of a blowoff top for the automobile market. Remember, sales were already waning well before September's surge.
Auto Sales Charts
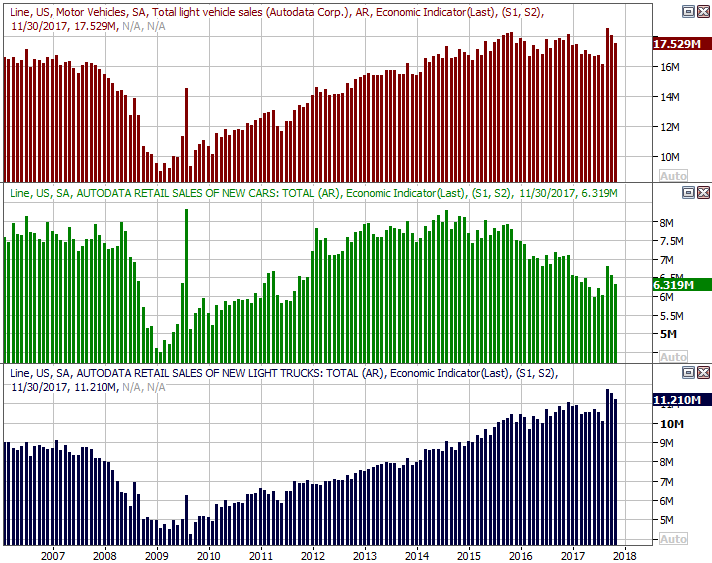
Source: Thomson Reuters Eikon
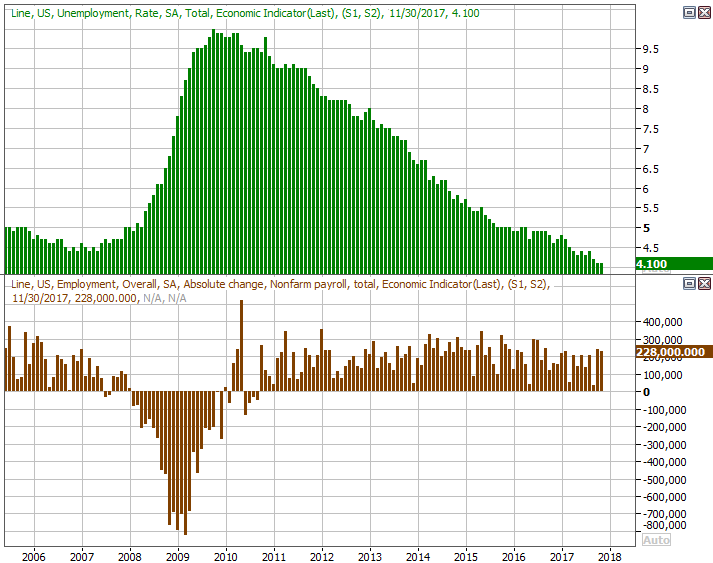
Last but certainly not least, look for December's jobs report on Friday.
Economists aren't looking for the same pace of payroll growth we saw in November -- which was incredible -- but the pros are expecting enough job growth to drive the unemployment rate down to a multi-year record low of 4.0%.
Payroll Growth and Unemployment Rate Charts
Source: Thomson Reuters Eikon
We've said before, however, that we've pretty much maxed out the number of people with jobs -- most everyone who wants one has one. From here the litmus test is wage growth, which suggests employers are competing for workers... the true testament of economic strength. Paychecks, on an hourly basis, are getting bigger again though, and are expected to continue growing through last month. The average hourly earnings change is the number you'll really want to watch.
We'll provide a detailed look at the employment data you don't hear much about at the website, as we do every month in response to the report.
Index Analysis
First and foremost, don't freak about Friday's sudden and rather dramatic pullback (at least compared to the rest of the week). Most of it was apt to be year-end tax selling, and/or some clean-up by fund managers and investment managers that didn't want to have to tell their bosses they were holding certain names as of the end of 2017.
On the other hand, even a small setback could be interpreted in the wrong way, being viewed by some as a red flag, and a warning that the overbought market is finally starting to pay the toll.
Take a look at the daily chart of the S&P 500. It's easy to see how uncharacteristic Friday's dip was.
S&P 500 Daily Chart, with VIX and Volume
Source: TradeNavigator
Then again, the dip is anything but game-changing. The S&P 500 is still in a bigger-picture uptrend, and even with Friday's stumble is holding above the 20-day moving average line. The VIX, which is also technically starting an uptrend, is hardly breaking new ground either.
In other words, don't assume the worst just yet.
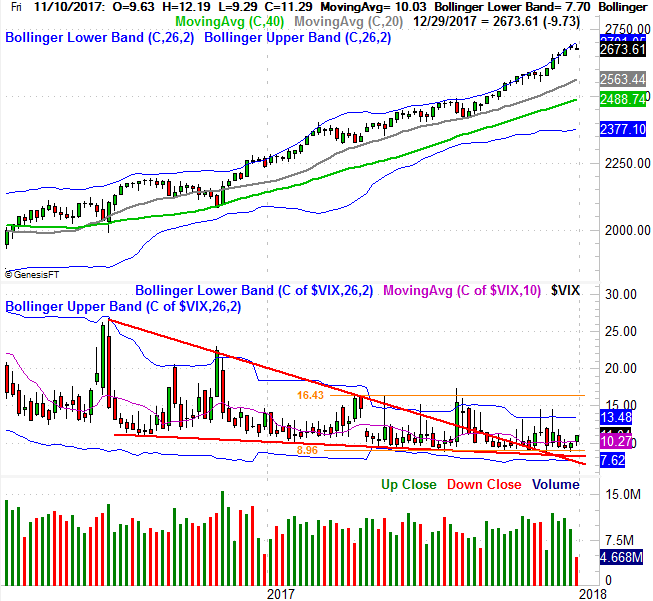
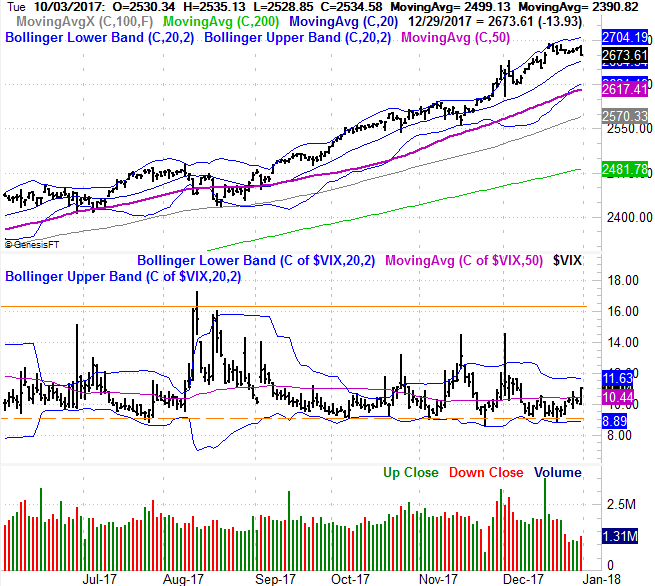
The longer-term weekly chart puts things in a little better perspective. It's in this timeframe we can see just how far away from a true, concerning breakdown we are. The 100-day line (gray), currently at 2563, hasn't been broken as a floor, nor has the VIX's ceiling at 16.4 been breached. Both need to break before there's a real reason to worry.
S&P 500 Weekly Chart, with VIX and Volume
Source: TradeNavigator
A trip back from the recent peak of 2695 to the 100-day line would be a 4.8% pullback, which would be the biggest slide we've seen in months... though it still wouldn't snap the uptrend.
With all of that being said, it's crucial to understand right now that "not bullish" isn't the same as "bearish." Even if the threat of the former becomes a reality, the latter doesn't necessarily have to become a reality.
We're leaning on the daily chart of the S&P 500 with MACD lines and a PercentR indicator to guide us in this way. As you can see, we have a bearish MACD divergence, and the Percent R line has fallen under the 80 threshold. That's technically the end of bullishness. It won't be until the PercentR line falls below -- and stays under -- the 20 threshold until we can get decidedly bullish. Odds are good the S&P 500 will also be under the 100-day average and the VIX will be above 16.4 if and when that happens.
S&P 500 Daily Chart, with MACD and PercentR

Source: TradeNavigator
This is, to be completely unbiased and fair, a coin toss, made even trickier by the beginning of a new calendar and trading year. The smart-money move here may be do nothing immediately, and then keep any new short-term trades on a short leash.