Weekly Market Outlook - Stocks Didn't End the Week on a Much-Needed High Note
Despite Thursday's bounce and Friday's half-hearted effort to follow through on that move, stocks just logged their second consecutive losing week. Indeed, Friday's failed follow-through is extra alarming, in that the bulls had their chance to get things going again, but ultimately yielded to the bears.
There are still some technical support levels that could get in the way of a pullback, but there plenty of hurdles above too. More than anything right now, stocks are trapped in the middle. Now wouldn't be a bad time to remain on the sidelines and let everyone else duke it out.
We'll look at the matter in some detail below (as always), but first, let's review last week's economic announcements and preview this week's economic news.
Economic Data
The party started early last week, with Monday's new-home sales report rounding out the existing-home sales report from the prior week. They were far better than expected, rolling in at an annualized pace of 689,000 units.
Home Sales and Inventory Charts
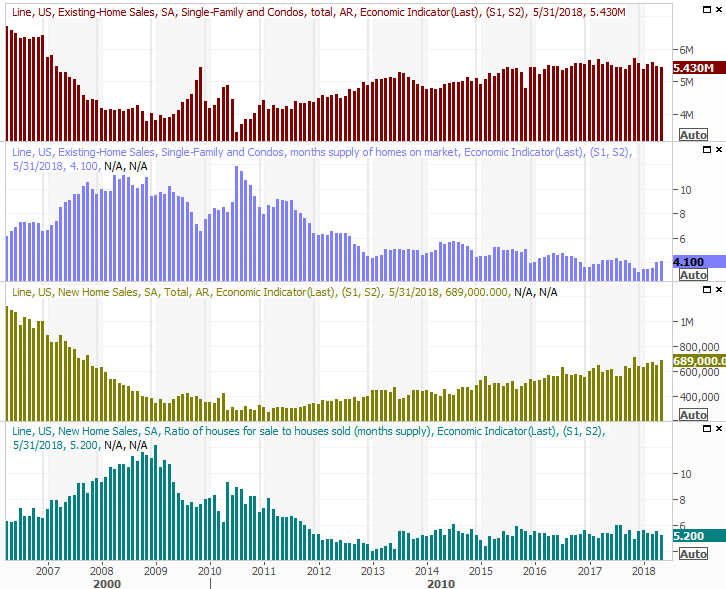
Source: Thomson Reuters
That strength in existing home sales offset weakness seen in new-home sales last month. On both fronts, sales may be tempered by an ongoing lack of inventory.
It was also a big week for consumer sentiment. The Conference Board's consumer confidence level fell a bit, and more than expected, but is still at a high level, and still broadly trending higher. The University of Michigan's read on consumer sentiment also slipped a little, but again, it's still trending higher... into multi-year highs.
Consumer Sentiment Charts
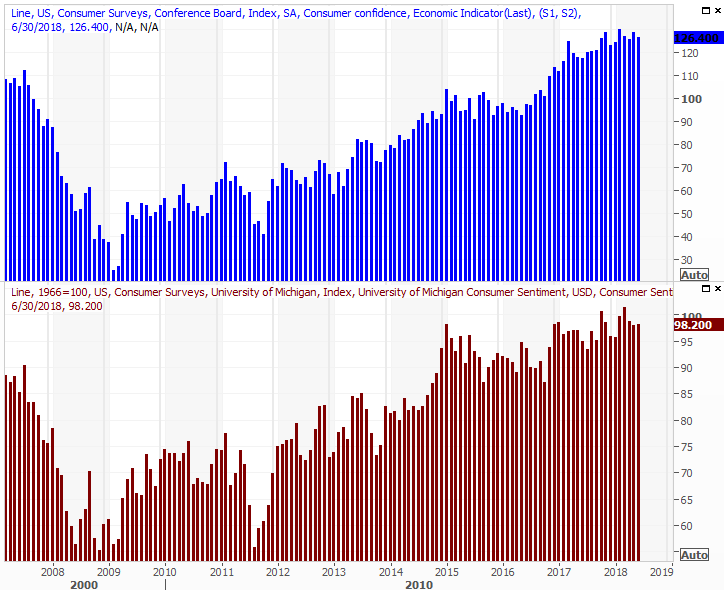
Source: Thomson Reuters
The Case-Shiller index was updates on Tuesday, undersoring the previous week's FHFA home price report. As expected (and as has been the case for months now), we say more progress. The Case-Shiller Index was up 6.6% year-over-year, and the FHFA home price index was up 0.1% month-to-month. Both say home prices continue to firm up, abating any concern about the apparent slowing in existing home sales.
FHFA, Case-Shiller Home Price Charts
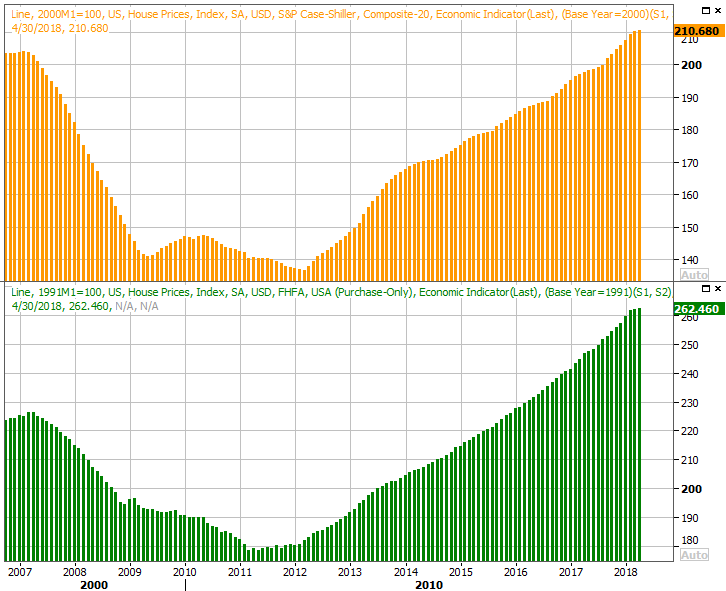
Source: Thomson Reuters
Do note that both home price reports were for April, so they're a bit dated.
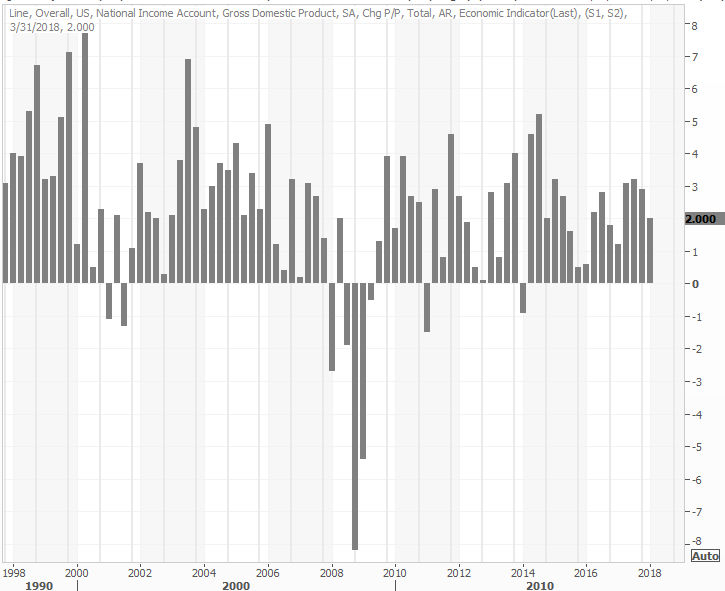
The third and final look at Q1's GDP growth rate has been pegged at 2.0%, down a little from the second estimate. It's not a great score, though could be worse. Perhaps more important at this point, Q2's GDP growth rate is expected to be about twice that of Q1's growth rate.
GDP Growth Charts
Source: Thomson Reuters
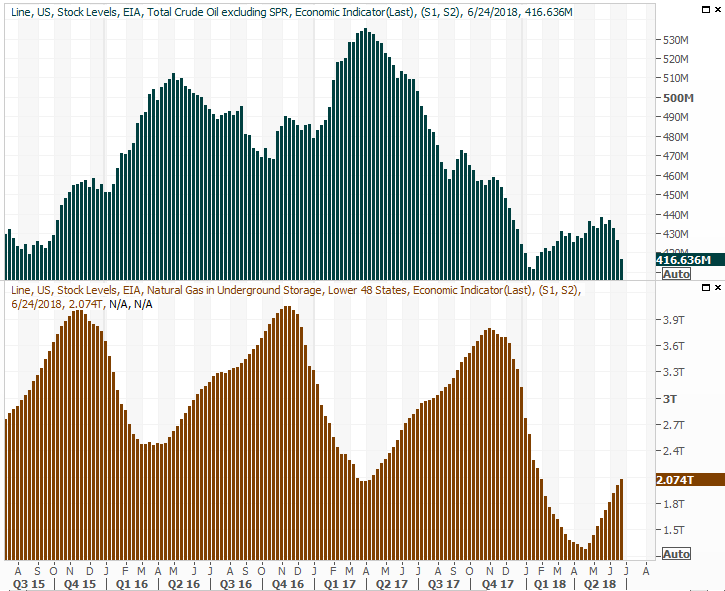
Last but not least, oil inventory levels fell sharply once again. All told, stockpiled crude fell to the tune of 9.9 million barrels.
Crude Oil, Natural Gas Inventory Charts
Source: Thomson Reuters
This decrease in inventory levels suggests the oil industry is exercising a higher level of production discipline than they were willing to exercise back in 2015 and 2015.
Everything else is on the grid.
Economic Calendar
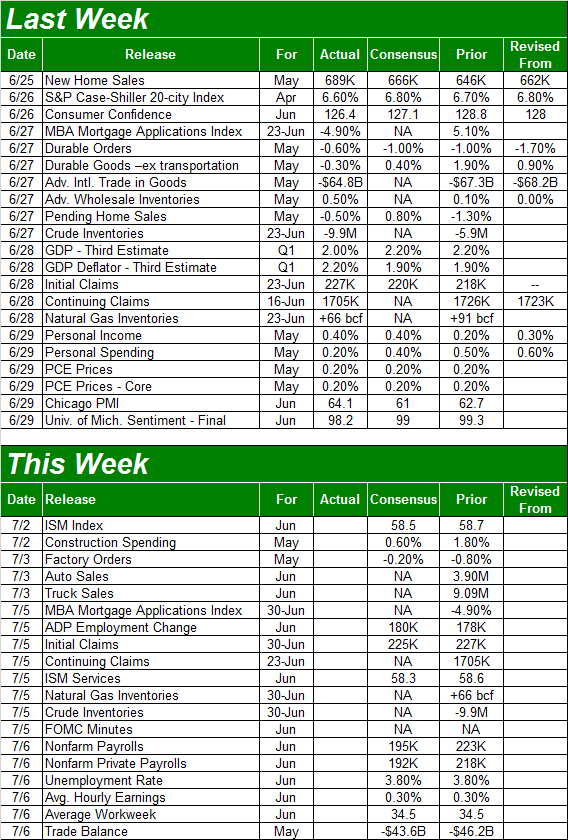
Source: Briefing.com
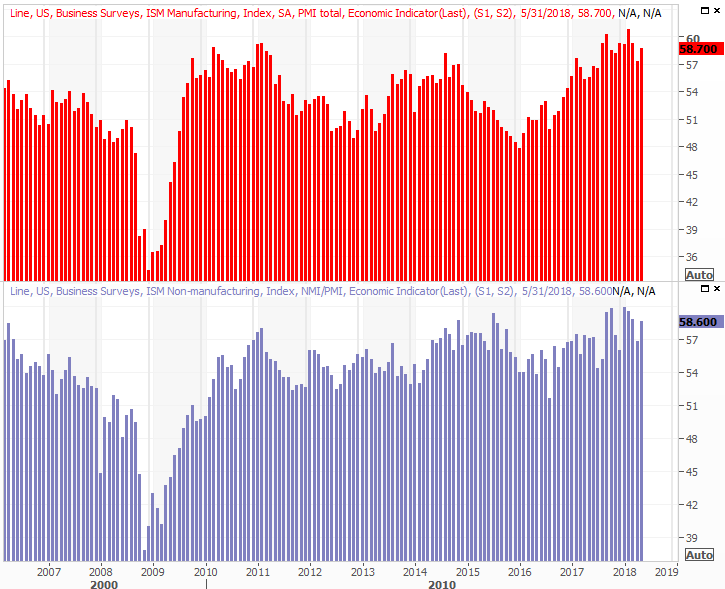
This week won't be quite as busy, though there are a handful of items worth watching closely. Chief among them is Friday's look at June's employment data, but first things first. On Monday we'll hear about June's ISM Manufacturing Index report. The pros say it won't change much, but it's holding steady at healthy levels.
ISM Index Charts
Source: Thomson Reuters
The ISM Services Index report won't be posted until next week. It's been just as strong as its manufacturing counterpart though.
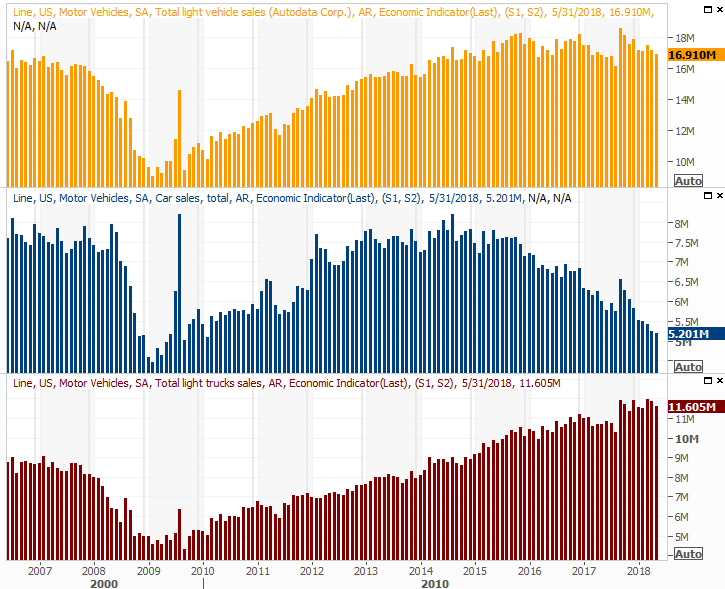
On Tuesday we'll get June's auto sales figures. Boy do we need a win on that front, though it's unlikely we'll get one. Even truck sales, which had been carrying all the weight for the industry, seem to be leveling off here. Bad news here could very likely cause major problems for the automobile industry, though that won't necessarily do a whole lot of damage to business outside of automobile circles.
Auto Sales Charts
Source: Thomson Reuters
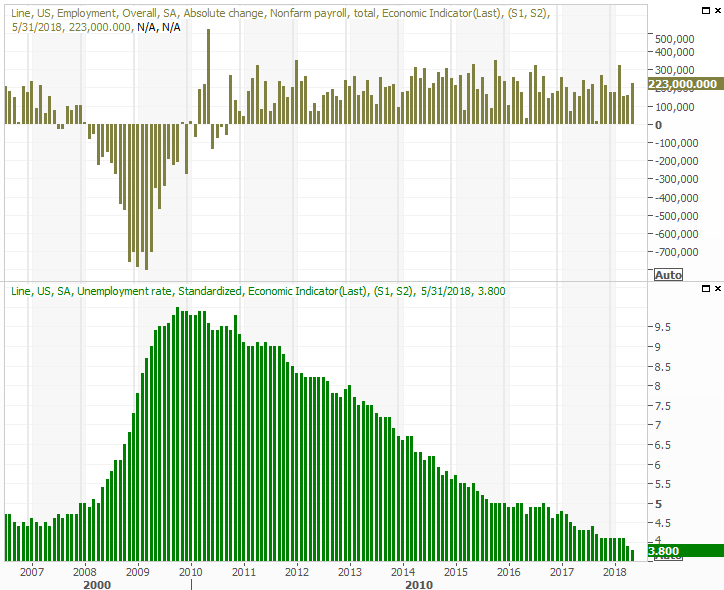
The big Kahuna this week, of course, will be the look at June's unemployment levels and job creation. Economists aren't expecting the unemployment rate to slide any lower than its current figure of 3.8%, but that's a stunningly low figure. It's unlikely the economy is even plausibly capable of pushing the unemployment rate below that level. In the meantime, the pros say we added 192,000 payrolls in June. That's down from May's 218,000, but still a very solid figure.
Unemployment Rate and Payroll Growth Charts
Source: Thomson Reuters
The real measures of the job market's strength from here will be pay rates, and hours-worked. We'll take that detailed look at the website shortly after the news is released.
Index Analysis
For a short while on Friday it looked like the market might achieve escape velocity, pushing up and off major technical support and rekindling the uptrend that got started in March. By the time Friday's closing bell rang though, the market was once again in a fight, back-pedaling. It ended the day with a gain, but also ended the day near its low, and just a tad above that support level... and still drifting in the wrong direction.
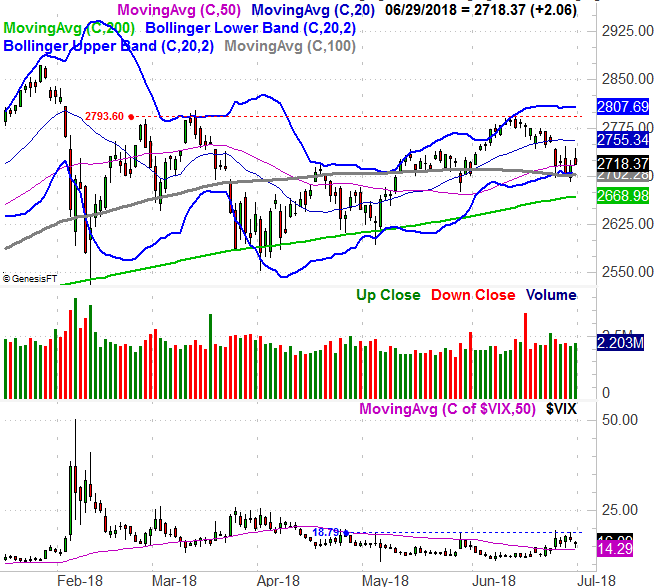
Take a look at the daily chart of the S&P 500 below; it speaks straight-forwardly. It looked like the index was going to push off the 100-day line (gray) and the lower Bollinger band at 2700. And, it did... but just barely. The bulls were entertaining doubts as the weekend approached.
S&P 500 Daily Chart, with VIX and Volume
Source: TradeNavigator
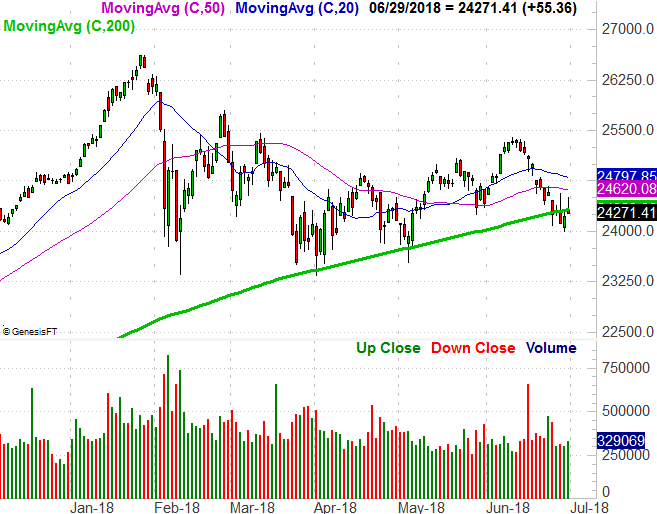
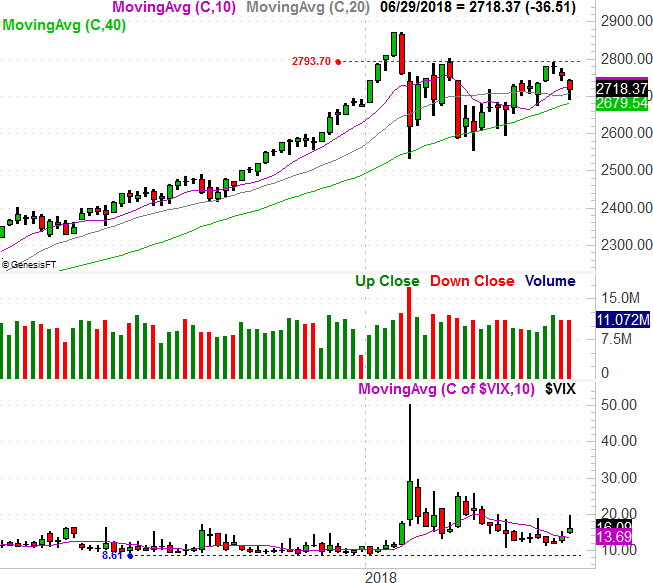
Now take a step back and look at the weekly chart of the S&P 500, for perspective. This is the worst two-week stretch in a long while, and as you can see, the all-important 200-day moving average line (green) is once again being threatened. It's held up as a floor the last few times it was tested, but the more often it's tested, the more likely it is it will eventually fail as support.
S&P 500 Weekly Chart, with VIX and Volume
Source: TradeNavigator
And for the record, the Dow Jones Industrial Average is below its 200-day line, for the first time since early 2016.
Dow Jones Industrials Daily Chart, with Volume
Source: TradeNavigator
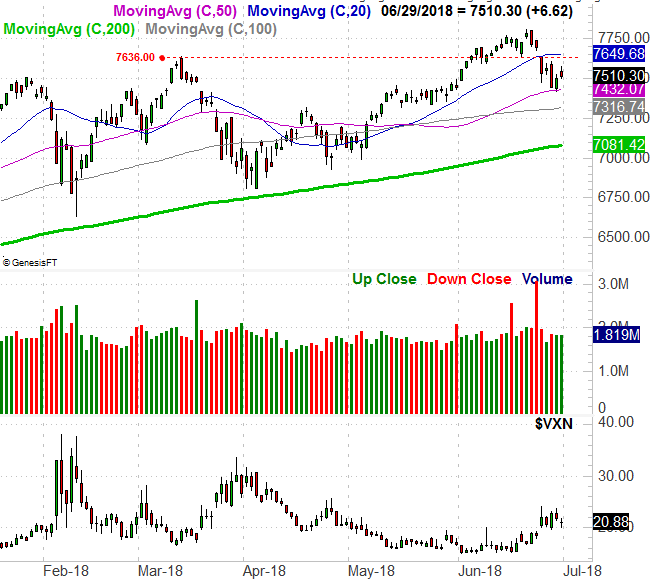
The NASDAQ Composite, on the other hand, is nowhere close to being below its 200-day moving average line. This broadly bullish, in that the NASDAQ tends to lead the market, up and down. If it's holding up, it means the market is more strong than not.
Still, the NASDAQ appears to be failing to push through its current headwind.
NASDAQ Composite Daily Chart, with VXN and Volume
Source: TradeNavigator
It's a conundrum - even more than the market usually is. On balance though, the bears are actually in charge of the short-term trend. Before that trend truly turns into something worth worrying about though, two things are going to have to happen. First, the S&P 500 is going to have to move below its 200-day moving average line, ad 2669. Second, the VIX is going to have to make its way above 18.8. If both are going to happen, they'll likely happen right around the same time.
The hard part about navigating the current market environment is appreciating that we haven't seen a normal-sized correction in years. Rather, any dips have been modest and short-lived. Equally tough is believing that one of these day, a modest blip is going to turn into a full-blown correction, on the order of driving a 10% - 20% loss. In the meantime, this remains a day-to-day affair.
Check back a week from now. We'll see how (or if) things have changed.