Weekly Market Outlook - Stocks Can't Ride the Fence Forever

Stocks mustered a second weekly gain last week despite Friday's lull. But, that lull certainly taints the effort, suggesting that when push came to shove and traders had to commit to stocks for two days they couldn't sell them, they chose not to own them. There was plenty of volume behind Friday's lull to boot.
Maybe it was just an off day. The S&P 500 is still notably above several key lines in the sand. And, though it's also below another pivotal line, it's close. Perhaps more sideways movement would be the ideal outcome from here... just to let the bulls regroup a little more.
On the other hand, investors have been oddly discouraged by a clear lack of progress of late.
We'll weigh what's working and not working for the market below, as always. First though, let's review last week's major economic news and then preview what's in store for this week.
Economic Data Analysis
Several big announcements were made last week, and none of them were particularly encouraging.
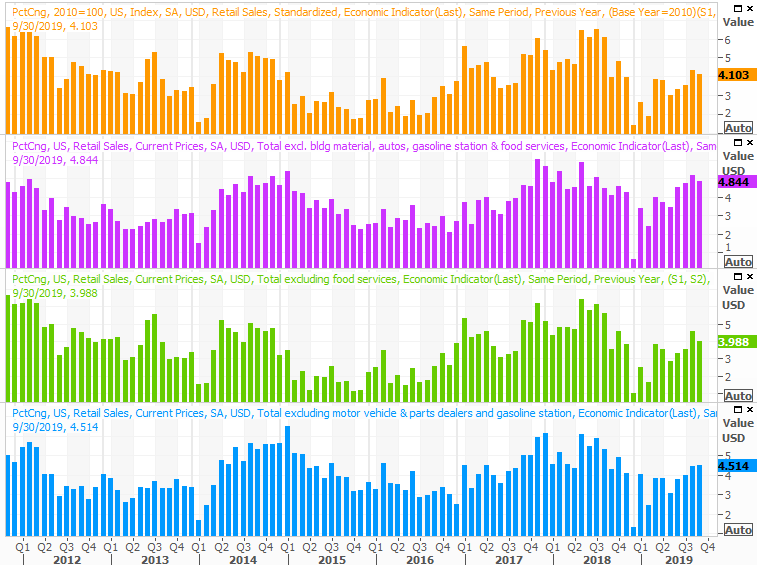
The party started in earnest on Wednesday, with last month's retail sales numbers. Surprisingly, they slumped rather than grew as expected. Retail consumption fell 0.1% overall versus expectations of a 0.2% increase when not counting automobiles. But, spending fell 0.3% when factoring cars in compared to the 0.3% analysts were modeling.
There is one MAJOR detail that needs to be considered before drawing any sweeping conclusions about the figures, however. That is, retail spending fell, but that fall was from August's unusually strong surge. On a year-over-year basis, retail spending was up 4.1% from last year's September.
Retail Spending Charts
Source: Thomson Reuters
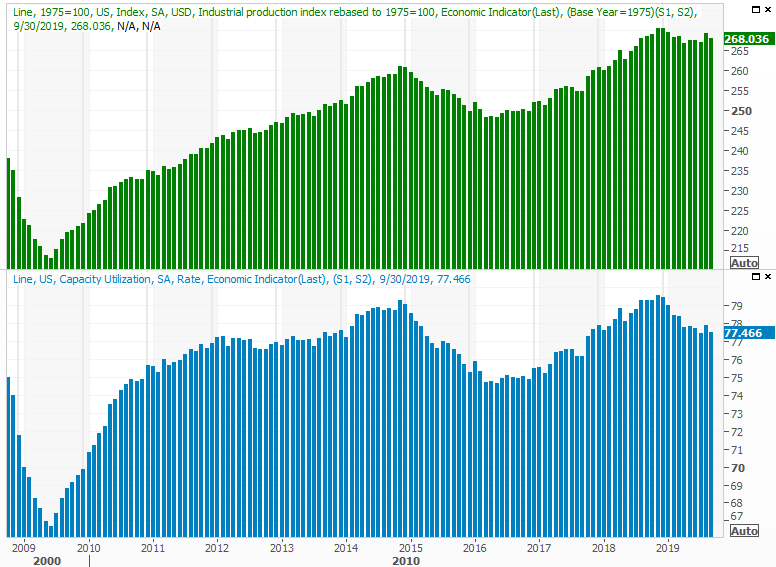
On Thursday we got September's industrial production and capacity utilization figures... another letdown. Economists knew they'd be down, but they underestimated how much they'd fall.
Industrial Production and Capacity Utilization Charts
Source: Thomson Reuters
One bad month doesn't make a trend; remember both measures ticked higher in August. The one setback could be an omen that this year's weakness before August is about to resume. It's the last thing long-term investors want to see (seriously).
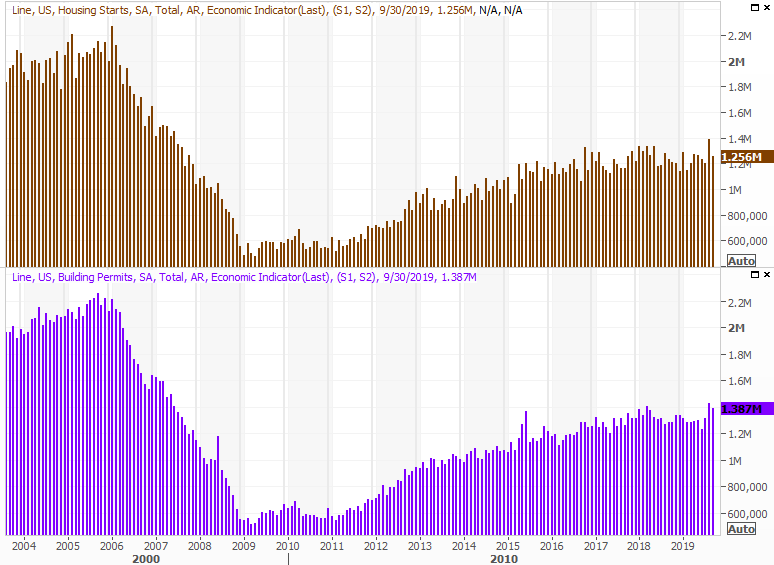
Finally, also on Thursday we got last month's building permits and housing starts numbers. The pros were calling for a lull, and they weren't wrong.
Housing Starts and Building Permits Charts
Source: Thomson Reuters
It's not the end of the world. Even though the data is seasonally-adjusted, it was being compared to an unusually strong August, spurred by lower mortgage rates. Last month's readings are still above the recent average, which is bullish. The data won't mean a whole lot until we can cross reference it with this week's home sales information. (Either way, though the seasonal adjustment is supposed to work this out, the seasonal lull in new-building starts has a way of working itself into the numbers.)
Everything else is on the grid.
Economic Calendar
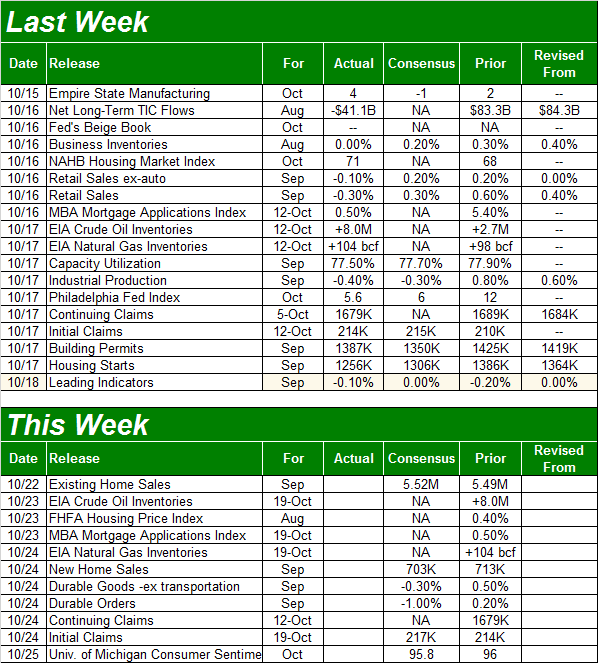
Source: Briefing.com
This week will be a light one, though we're getting a huge updated, additional outlook about the real estate market. On Tuesday we should see a slight uptick in last month's sales of existing homes, followed by Thursday's report of September's new home sales. The pros expect a slight lull in new home sales, though that lull will be the result of an incredible surge from August. It should still be healthy.
New, Existing Home Sales Charts
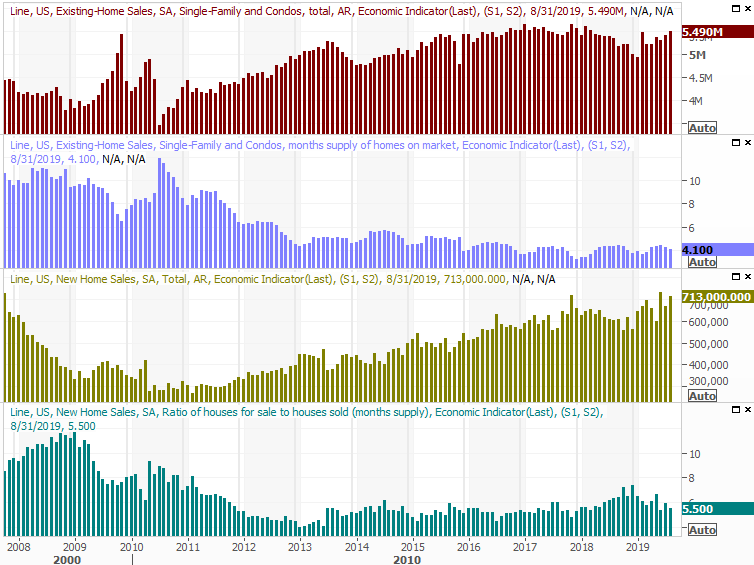
Source: Thomson Reuters
The home-value uptrend is leveling off, but total purchase activity and interest has remained prodded. The market can survive on that, even if it's not thriving.
On Friday we'll get the third and final look at the Michigan Sentiment Survey for October, though we'll save our closer look at it until next week when we can compare it to October's consumer confidence reading from the Conference Board.
Stock Market Index Analysis
Just a few weeks ago the threat of a major turning point for the market was upon us. We were hoping the lack of room to simply drift sideways within the confines of a narrowing trading range would force stocks to bolt higher or lower. But, no dice. The S&P 500 and other key indices are still on the fence, with even less room to maneuver now. That's annoying, but ultimately good news as it brings us even closer to the point where the market will have to do something decisive.
What that may be remains entirely in question. The bulls have the advantage of being above all the key moving average lines, most of which are also pointed upward at this time. The bad news is, we're at a time of year (and a time within the four-year presidential term cycle) that's generally not good for stocks.
Relief should start in mid-November, but ironically, the one thing working against that relief is a lack of clear weakness right now. We'd be best served by selling off rather roughly right now and making a good, clear bottom rather than continuing to drift sideways and ease into that bullishness. The market is pretty frothy as is.
There is good news, no matter what's in store -- the lines in the sand have become crystal clear. For the S&P 500 that's (still) the support line that connects the low from early this month with the key lows from August. That's plotted in light blue on the daily chart below, and it aligns with the 200-day moving average line (white). At the other end of the spectrum, the technical ceiling around 3022 (yellow, dashed) is still intact as resistance.
S&P 500 Daily Chart
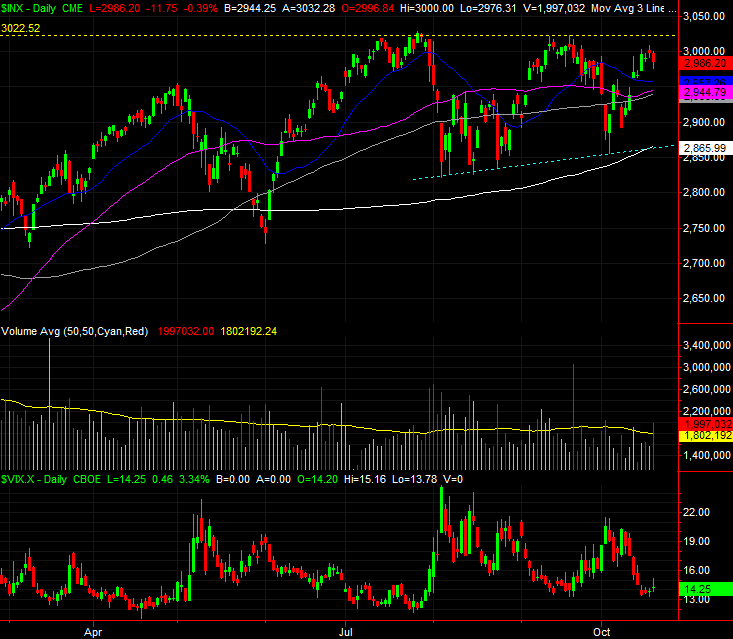
Source: TradeStation
As is usually the case, zooming out to the weekly chart puts things in perspective. In this instance doing so really illustrates just how stagnant the market has been of late. In the past it's either made prolonged rallies or pullbacks, with only short-lived gyration. Things have gone nowhere (constructive) since May though, and there's still a little room left between the key support and resistance levels to continue doing nothing.
S&P 500 Weekly Chart
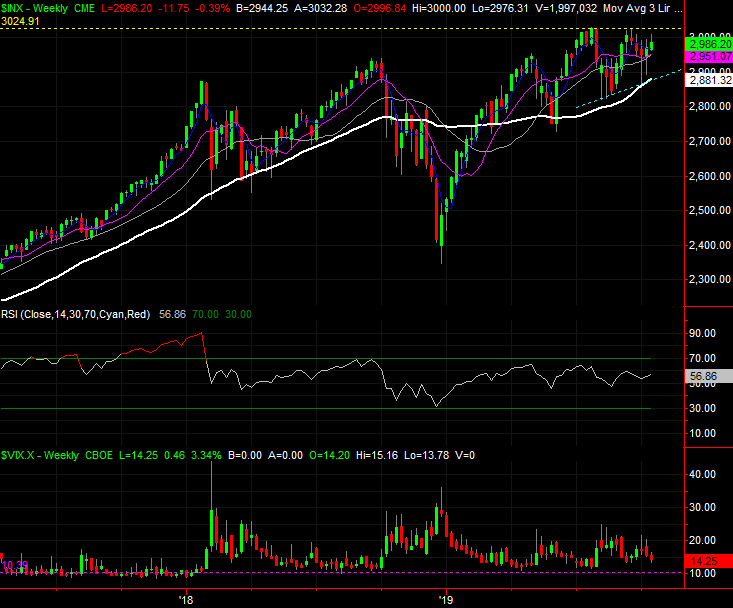
Source: TradeStation
The daily chart of the NASDAQ Composite more or less tells the same story, but with a couple of different nuances.
One of them is, it's already made a couple of lower highs (purple, dashed). Another is its best support line is horizontal rather than pointed upward, parked near 7697 where the index has hit lows several times since August. And, perhaps most obscured of all is that the NASDAQ's volume tide has already turned bearish -- almost -- as evidenced by its accumulation-distribution line.
NASDAQ Composite Daily Chart
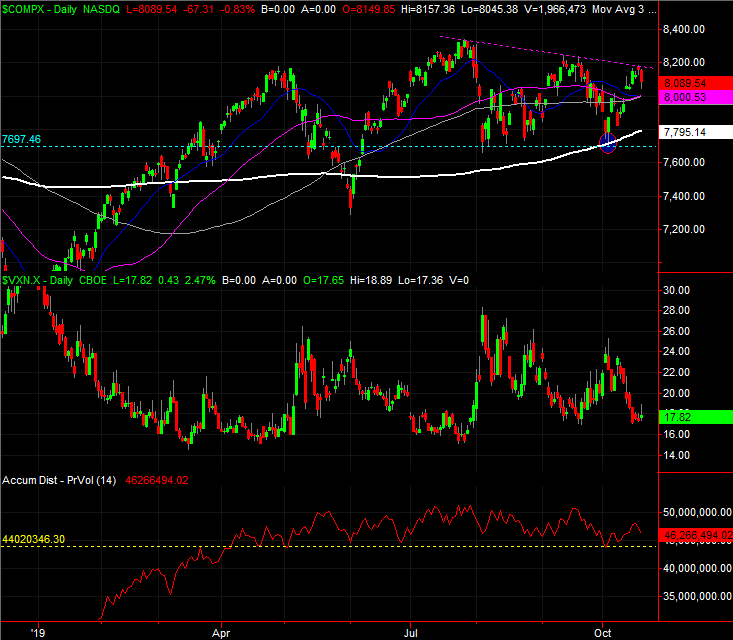
Source: TradeStation
Should that A-D line break below 44.02 million and the NASDAQ itself fall under 7697, that's trouble... and more than a little. The composite tends to lead the rest of the market, higher and lower.
The question is, how far might a breakdown drag the broad market? A painful but palatable pullback is actually a somewhat desirable outcome here to set up a year-end rally. A bullish move could trigger more bullishness by virtue of blasting past resistance, but there's little room left for gains beyond that point given how little certainty there is about the condition of the economy. And, there's no trade-based catalyst on the near-term horizon.
That puts all the focus on earnings season, but that will take through the end of November to draw any clear conclusions. That makes it tough to expect anything besides more range-bound action ahead.