Weekly Market Outlook - Stocks Back on the Fence (and maybe willing to stay on it)
Technically speaking, the market is still in a bullish mode. It's the most lethargic bullishness one could possibly imagine though, with most of the key indices one bad day away from being back on the wrong side of the table. Never even mind the fact that the market actually lost a little ground last week.
 So once again, investors are left on the fence, able to hope for the best but ready to deal with the worst. The core problem is that the buyers are tired of pulling stocks up by their bootstraps every time they take one on the chin.
We'll look at the tentative matter in detail below -- as always -- but first let's run through last week's and this week's economic news.
Economic Data
Last week was rather tame in terms of economic news. The only items of interest were last month's ISM Services Index, and temporarily, supplies of crude oil and natural gas... a matter that became immensely more meaningful after hurricane Harvey shut down the Gulf Coast's energy industry and Irma is about to wreak at least a little more havoc.
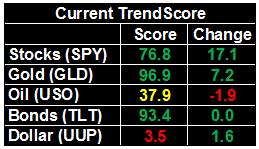
We didn't get the ISM Manufacturing Index data last week; that came a week earlier. In that the two data sets go hand in hand though, we'll remind you that the ISM Manufacturing score for August rolled in at 58.8 -- a multi-year high -- while we learned last week that August's ISM Service Index score was 55.3. That's lower than the recent norm, but still up from July's level.
ISM Index Charts
Source: Thomson Reuters Eikon
Both remain above the critical 50 level. And on a side note, one can't help but wonder if President Trump's pro-manufacturing agenda is driving at least some of the ISM Manufacturing Index's advance.
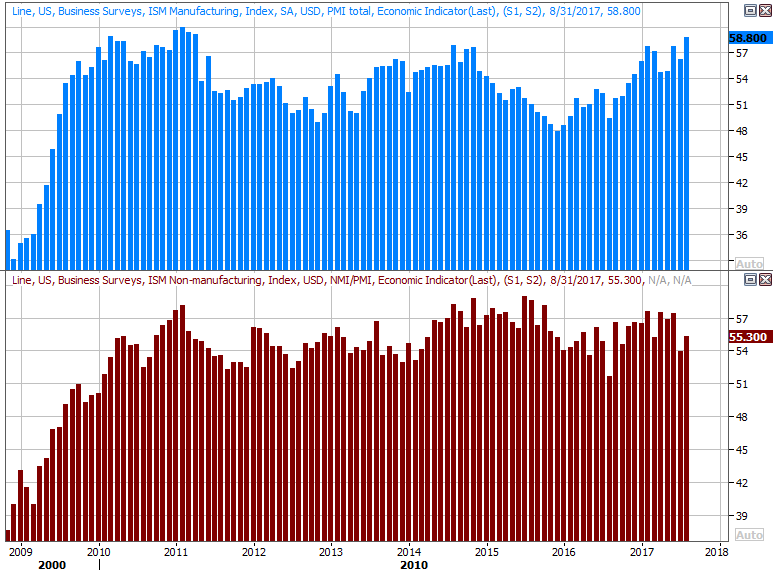
As for crude oil levels and natural gas levels, it's not a real surprise the former ticked higher last week. A wide swath of the nation's refiners had to shutter when Harvey ripped across Texas and Louisiana, meaning oil wasn't being delivered to refineries even though it was still being extracted from the ground. Don't read too much into that blip. The bigger trend is still downward.
Not so with natural gas, which wasn't impacted by Harvey quite as much as crude was. Natural gas inventories rose once again last week, though that's the norm this time of year (headed into colder months). Still, absolute levels of natural gas inventory is below the recent norm for this time of year.
Natural Gas and Crude Oil Stockpile Inventory Charts
Source: Thomson Reuters Eikon
These charts suggest higher prices are likely for both gas and oil -- an undertow that's being accelerated by the weakening U.S. dollar.
Everything else is on the grid.
Economic Calendar
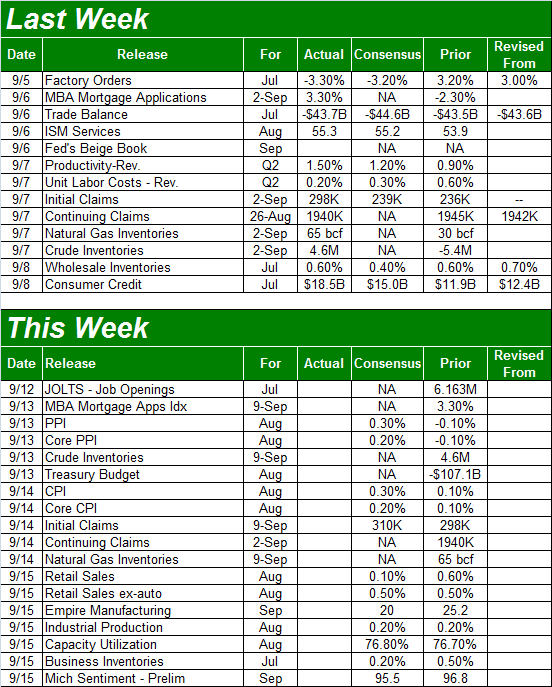
Source: Briefing.com
This week is going to be busier, starting with a look at last month's inflation data. The pros are calling for a lot more of it than we saw in July, when producer inflation actually fell and consumer inflation was almost nil. Both overall CPI and PPI rates are expected to rise 0.3% from July's prices, while both "core" inflation measures are expected to rise 0.2% from July's figures. On an annualized basis, that's somewhere on the order 2.0%, give or take.
Producer and Consumer Inflation Charts
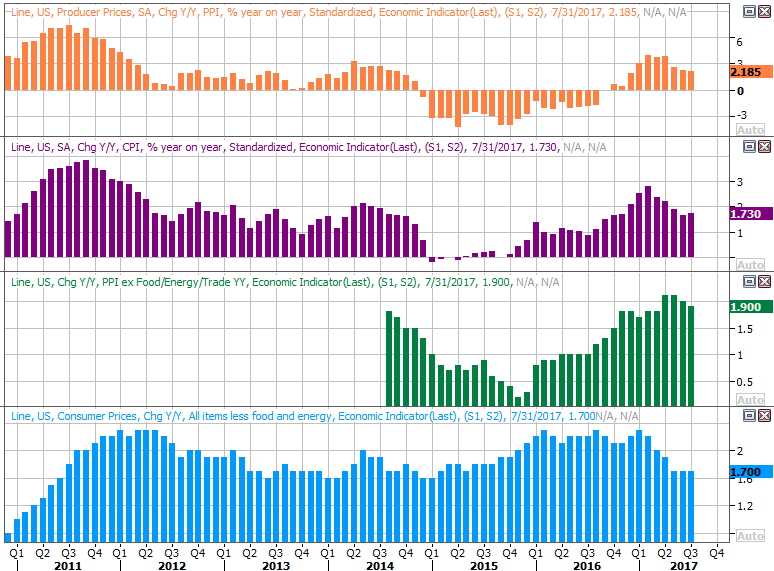
Source: Thomson Reuters Eikon
Not only is inflation stabilizing, it's stabilizing at levels that won't really force the Fed to take drastic, quick action. Traders are now saying, and betting, there won't be another rate hike until very late next year.
On Friday we'll hear about last month's retail sales data, which should be healthy when taking cars out of the equation; economists are looking for 0.5% growth on an ex-auto basis (but only 0.1% growth when factoring in cars). That's in line with July's growth pace.
Retail Sales Growth Charts

Source: Thomson Reuters Eikon
Consumer spending growth is technically slowing down, but that's mostly a function of several years of spending growth... it's all relative. It's leveling off at still-encouraging rates on the order of 3% annualized growth.
Finally, also take note of Friday's capacity utilization and industrial productivity data for August.
The figures will almost certainly be crimped by the impact of Harvey, though to what degree isn't exactly clear. But, in that this data set correlates quite well with the market's long-term trend, this is noteworthy information all the same.
Capacity Utilization and Industrial Productivity Charts
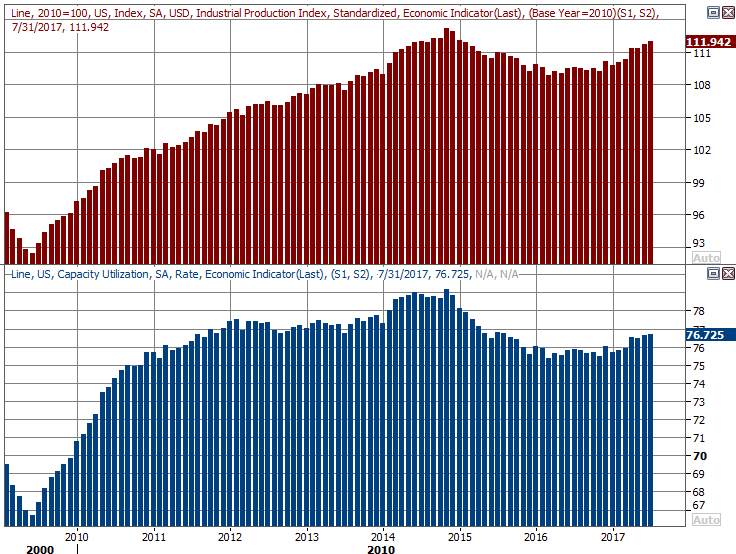
Source: Thomson Reuters Eikon
Realistically speaking, any hurricane-driven setback for this data is only apt to be a temporary one. So, take any shortcoming with a grain of salt. On the flipside, should either or both figures further firm up, don't be shocked and don't dismiss it. More than anything though, note that both have been improving for some time now.
Index Analysis
It could have been worse. But, it could have been better too. Specifically, the S&P 500 managed to remain above the critical 20-day (blue) and 50-day (purple) moving average line -- where a long-term support line (dashed) has intercepted both -- but it didn't follow through on the bullish surge we saw develop late the week before. The best chance to make good on a breakout thrust is when it first starts to develop. Now, seeds of doubt have been planted. The question is, will they sprout?
S&P 500 Daily Chart
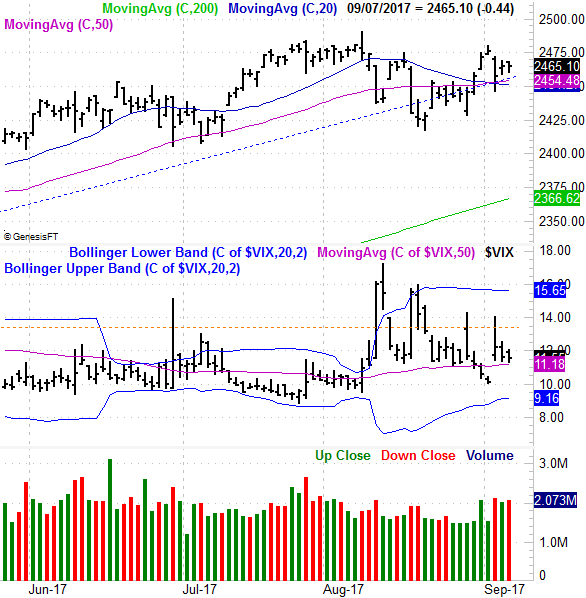
Source: TradeNavigator
Interestingly, traders are cautiously optimistic, willing to entertain the possibility that the market may find a way of rekindling the bullish move. But, investors are also prepared for the possibility that we could see the usual September bearish blues... at a time when stocks are ripe for a sizeable pullback. This even-keeled mindset suggests whatever's in the cards, it shouldn't be too terribly dramatic.
We come to this conclusion based on the position and action from the VIX. It's been drifting lower, but isn't at unusually low levels like the July low near 8.8 or where its lower Bollinger band is now. Sentiment won't be "too complacent" until the VIX gets to that level.
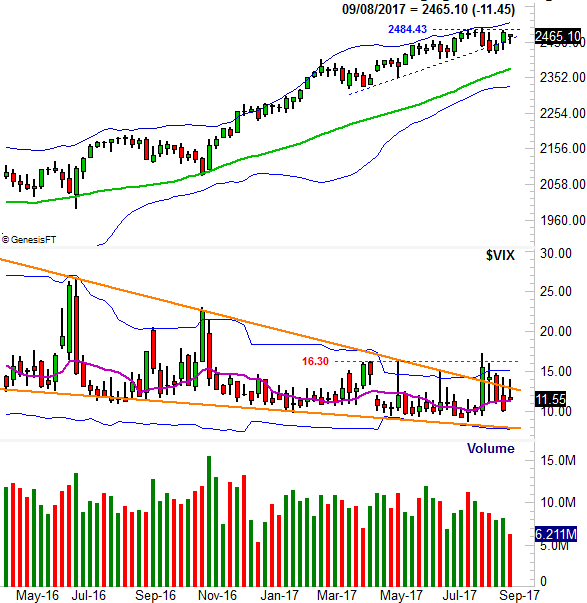
Zooming out to a weekly chart of the index puts all of this in perspective. Notice the S&P 500 wasn't able to clear the recent ceiling around 2484, and though the index managed to crawl back above a support level that goes back to April's low, a break back under that floor is still on the table. A second move under that support might not get the bulls' rebuke the way the last one did. The line in the sand is right around 2450.
S&P 500 Weekly Chart
Source: TradeNavigator
Still, until the VIX is back above 16.3, the market will remain in the hunt.
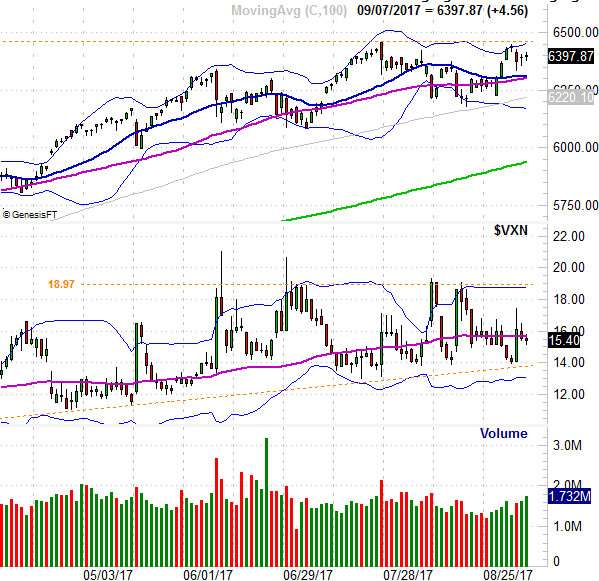
For the first time in a long time, the NASDAQ Composite looks like the S&P 500, and the VXN looks like the VIX... with the same make-or-break scenarios. That is, the VXN is getting squeezed into a wedge pattern, and the composite failed to break above the July peak of 6380.
NASDAQ Composite Daily Chart
Source: TradeNavigator
The big floor to watch for the NASDAQ is the 100-day moving average line (gray) at 6220. The VIX's lines in the sand are framed by the orange, dashed lines above and below it.
Though anything is still a possibility, the NASDAQ and the S&P 500 both have some clear lines in the sand. A break above the recent ceilings or below the aforementioned floors are apt to kickstart the suggested breakouts or breakdowns. We still contend, however, the calendar is setting up a pullback rather than another bullish leg.