Weekly Market Outlook - Still One Bad Day Away From Disaster
Stocks may have logged a small loss last week, but it could have been worse. Much worse, in fact. For a couple of hours on Thursday the key indices were below some pivotal support lines. They ended up reversing their intraday losses, setting up a nice gain on Friday that pushed us back to what was almost a breakeven for the week.
Still, we're within easy reach of that technical support level. One bad day could drag stocks back under it, and the next time around the bulls might not be so quick to fight back. And, for the record, Friday's big bounce was nowhere near as healthy as a superficial look at it would suggest.
We'll dissect all the details below - as always - but first let's run down last week's and this week's economic news. April's jobs report, posted on Friday, was uncomfortably strong, and this week we'll round out the other factor the Fed's looking out when it comes to making a decision on interest rates.... inflation.
Economic Data
Last week was chock-full of data - more than we can look at here. We'll stick with the highlights. In order of appearance...
As expected, both of the ISM indices fell in April after a huge March. And, both fell more than expected. Each remains above the key 50 mark though, suggesting the economy is still in growth mode.
ISM Index Charts
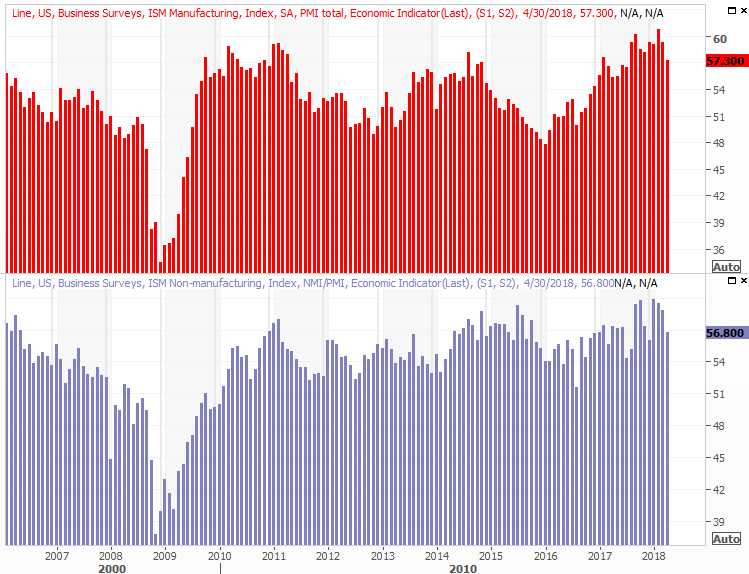
Source: Thomson Reuters
Another drop like April's could be a more concerning red flag, and speaking of red flags.
Investors were celebrating March's strong automobile sales a month ago, but the industry didn't exactly dish out an impressive encore. The pace fell to 17.15 million, rekindling a lull that got started early this year. Even truck sales, which had been resilient, are starting to flatten out.
Auto Sales Charts
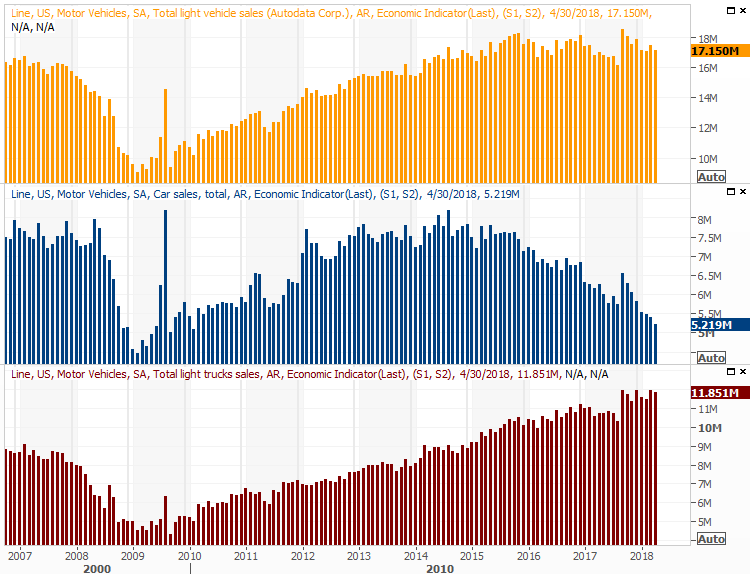
Source: Thomson Reuters
The show-stopper, of course, was the April jobs report posted on Friday. Unemployment fell to 3.9% of the labor pool... a multi-year record low. We only added 164,000 new jobs, missing estimates for 190,000 new payrolls. But, it wasn't exactly a failure. Employers are struggling to attract workers, many of which already have other jobs they intend to keep. Wages are growing quite nicely, fanning the flames of economic growth.
Unemployment Rate and Payroll Growth Charts
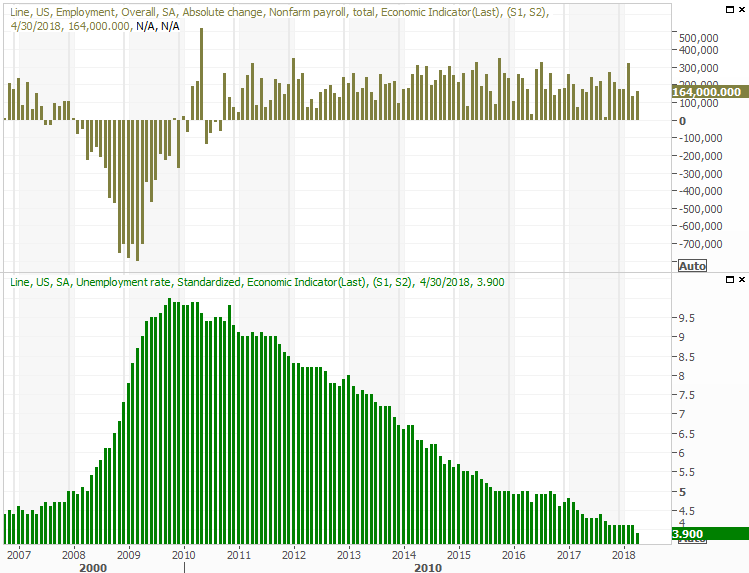
Source: Thomson Reuters
We took a detailed look at the jobs report at the website.
Everything else is on the grid.
Economic Calendar
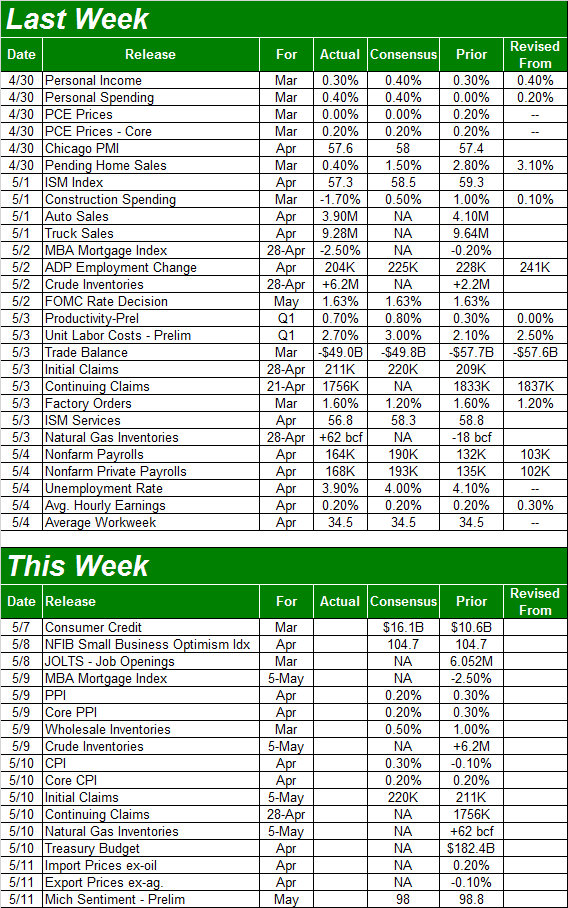
Source: Briefing.com
This week isn't going to be nearly as busy. In fact, there's only one data set we're interested in... though it's a huge one. On Wednesday we'll hear about last month's producer inflation, followed by Thursday's consumer inflation report.
Prices for everyone have been on the rise, though not to the point where inflation has become painful. Economists don't think that's apt to change this time around either, though in light of job growth and wage growth, it's certainly possible the pros are underestimating just how much inflationary pressure is at work now.
Inflation Rate (Annualized) Charts
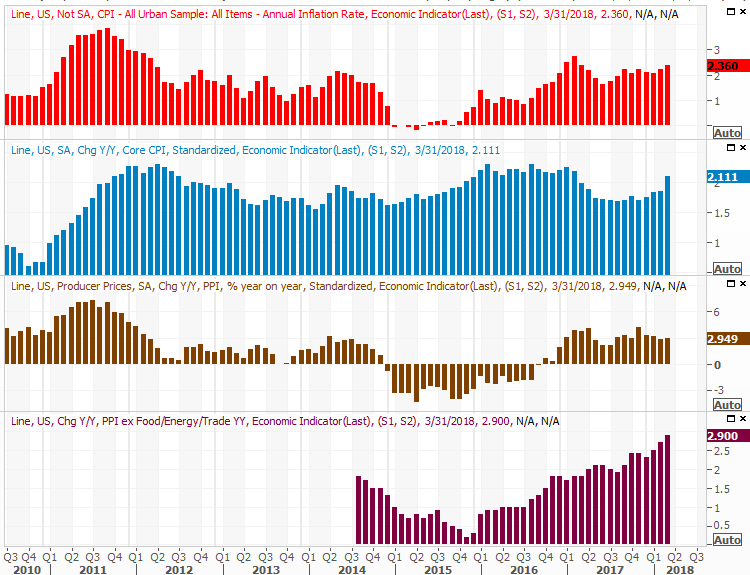
Source: Thomson Reuters
That being said, do note that regardless of what happens this week, inflation-wise, traders are betting on at least three more (and maybe even four) rate hikes this year.
Index Analysis
With just a quick glance it looks like Friday's big gain could be the beginning of the bullishness that's been absent since February. Take a closer, second look though. There are still some things very wrong with the market, and the path of least resistance remains to the downside. One more bad day could still easily push the market over the edge of the cliff.
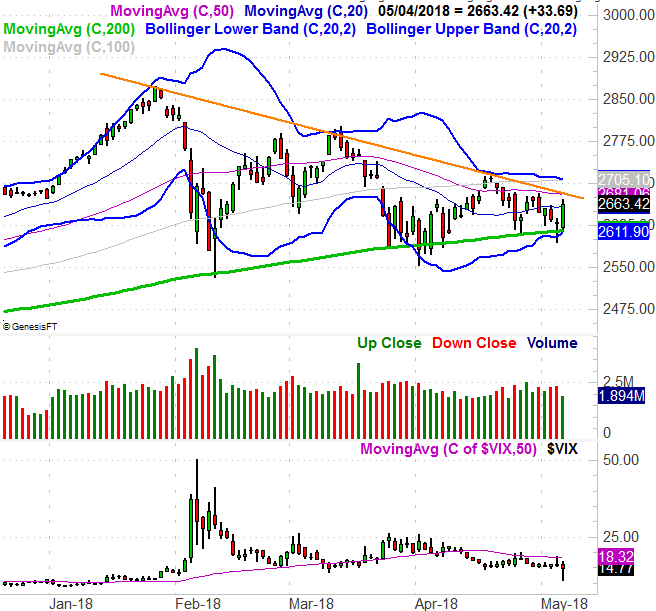
Take a look at the daily chart of the S&P 500 below. Right on cue, the index found support at the convergence of the 200-day moving average line and the lower 20-day Bollinger band and sprung higher. It's just what the early part of a bigger rebound move would look like.
S&P 500 Daily Chart, with VIX and Volume
Source: TradeNavigator
It's anything but a sure thing though.
For starters (and above all else), Friday's gain was an alarmingly low volume affair. We'd like to see increasing volume if a move is to see any follow-through. Almost just as important - the index needs to fight its way back above several of the key moving average lines and resistance lines ranging from 2663 to 2705. There are a lot fewer support lines to break down; both are at 2612.
One more minor clue that should be noted, if only to keep tabs on going forward - the VIX. Even though the S&P 500 rallied pretty nicely on Friday, the VIX didn't mirror the move with a strong dip. The VIX was on the way back up as the day came to close, suggesting traders are at least somewhat hedging against a pullback. That means there's some lingering doubt.
For the record though, the NASDAQ Composite isn't teetering on the edge of a breakdown like the S&P 500 is. Also, the NASDAQ's volatility index, the VXN, didn't reverse higher on Friday. It continues to edge lower, suggesting traders may be increasingly confident after all.
NASDAQ Composite Daily Chart, with VXN and Volume
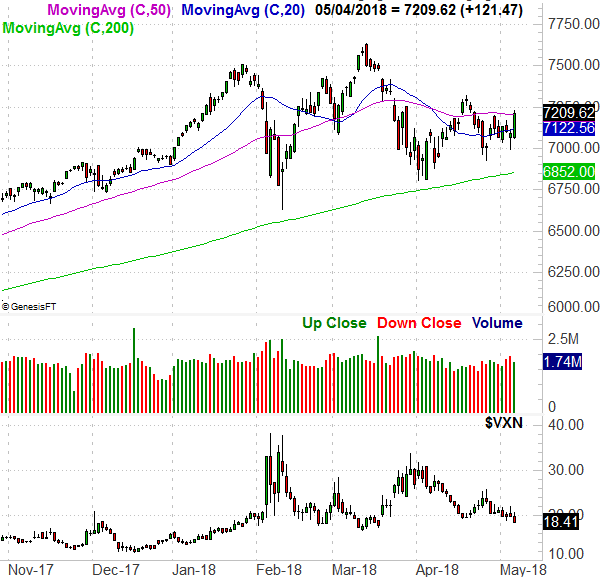
Source: TradeNavigator
This is worth noting. The NASDAQ generally leads the overall market, higher or lower. To see it steering clear of danger a little better than the S&P 500 points the scales back in favor of bullishness again. In fact, the NASDAQ is almost on the verge of thrusting through the 50-day moving average line.
Still, even the NASDAQ's big gain on Friday was on light volume. We'd like to see more participation in a rally effort. And, pushing the scales back toward the bearish side of the fence is the time of year. In good years or bad, May and June are pretty miserable months for stocks.
S&P 500 Average Day-to-Day Results
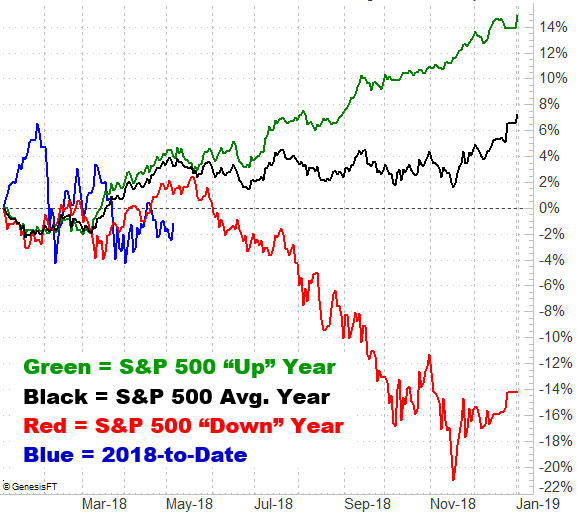
Source: TradeNavigator
The S&P 500 has been unusually bearish this year, underperforming even the average bearish year. Moving lower from here would still be unusually bearish for the index. It can and does happen though, particularly in light of the fact that late-2016 and 2017 were unusually bullish, and there's some pent-up profit-taking waiting to be unleashed.
Bottom line? We're waiting for the S&P 500 to wiggle its way out of its support and resistance confines. Anything else, and there's too much uncertainty to make any major bets.
The good news is, there's not much room left within those confines to move around. Something's going to have to give sooner or later.
Finally (and on an unrelated note), crude oil prices fought their way to new two-year highs last week. This is telling, but also shocking in that the U.S. dollar continues to increase in value while the supply of crude - stockpiles - are moving higher as well.
Crude Oil Price Chart, Weekly
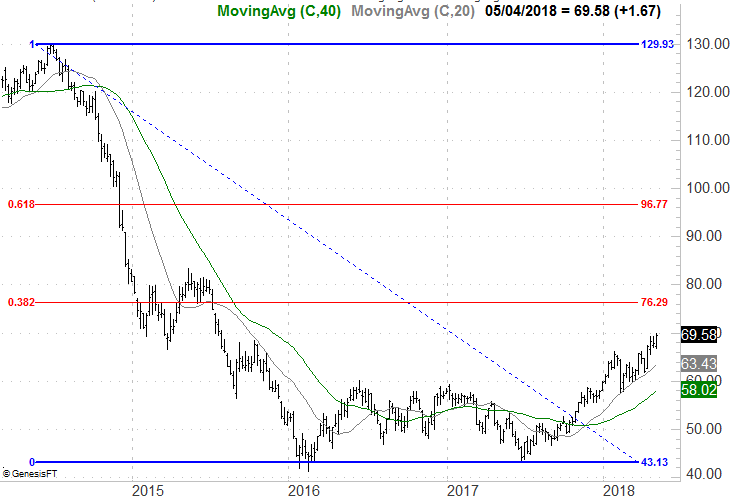
Source: TradeNavigator
There's no analysis to speak of about oil prices today, though we'll post one at the website later on. It's also challenging to do so, as the underpinnings don't support such a rally. That doesn't change the fact that the trend here is indeed a bullish one though, and we have to respect the trend even if it can't be explained.
More to come on that front, but in the meantime we do have to concede that there's still some room for crude oil to keep rising before it bumps into a major Fibonacci retracement level.