Weekly Market Outlook - So Much for the Meltdown Gaining Traction
A week ago the market was finally toying with a long-overdue corrective move. The bulls just weren't going to let it happen though. Fueled by renewed hopes that the trade war will finally ease up, the market renewed a powerful uptrend that's been in place since early July. Last week's close of 2904.98 was the best weekly close the S&P 500 has ever logged.
Can it last? Maybe, but September is a tough time of year for the market. It's usually a loser. Rules were made to be broken though.
We'll look at the trend and its risks below, after running down last week's economic news and previewing this week's announcements.
Economic Data
Inflation was last week's biggie. Not surprisingly, we've still got it, and it's still above-average. A ray of hope started to shine on this front last month though. That is, the pace of inflation actually slowed for the first time in months. The overall inflation rate peeled back to a modest 2.7%, and 2.2% on a core basis. Producers are seeing their input costs mostly tempered as well.
Inflation Rate Charts
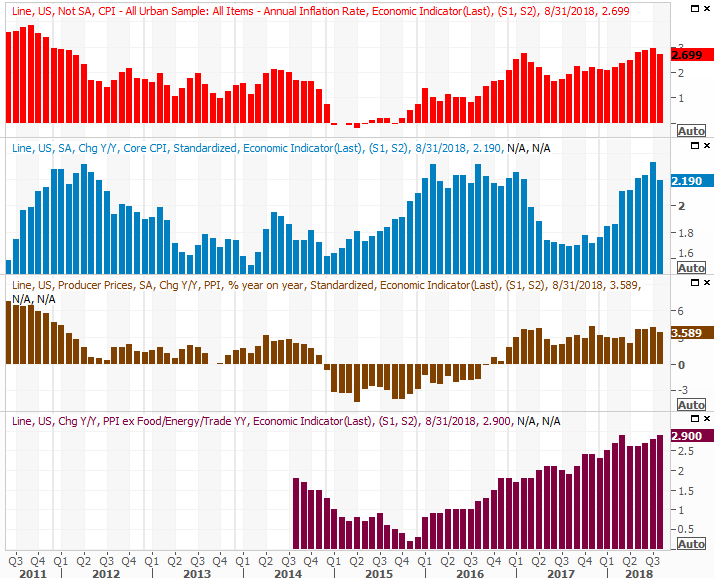
Source: Thomson Reuters
Though one cooled-off monthly report isn't necessarily going to prompt the Fed into canceling all plans for future rate-hikes, it certainly makes them less of a must-do.
Inflation wasn't the only big update. Also last week we got August's retail sales figures. They were good, again. Though not as strong as July's rates, but they were still positive. They may have been more so had inflation not contracted a bit. Either way, consumerism remains alive and well.
Retail Sales Growth Charts
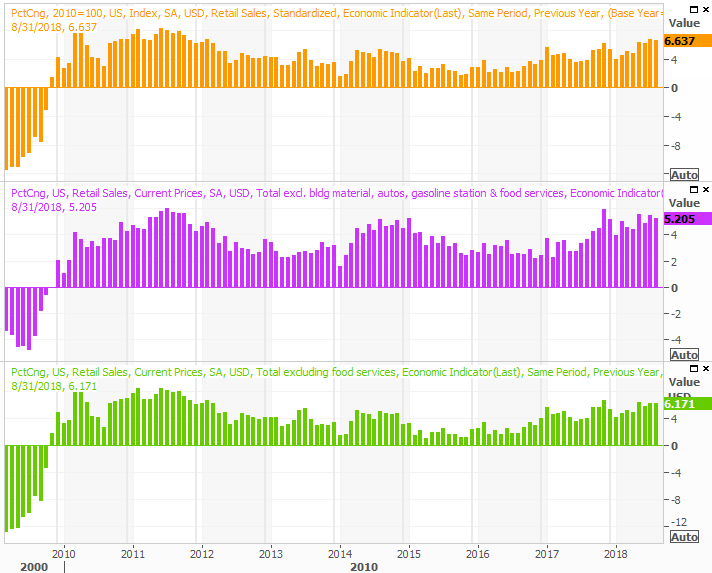
Source: Thomson Reuters
Perhaps more important, last month's industrial activity and capacity utilization were both up.
The correlation between corporate earnings and industrial activity is a strong one. Just as strong it's the correlation between the long-term market trend and industrial production. That activity, along with use of the nation's production capacity, both grew again August, extending a long uptrend.
Industrial Production and Capacity Utilization Charts
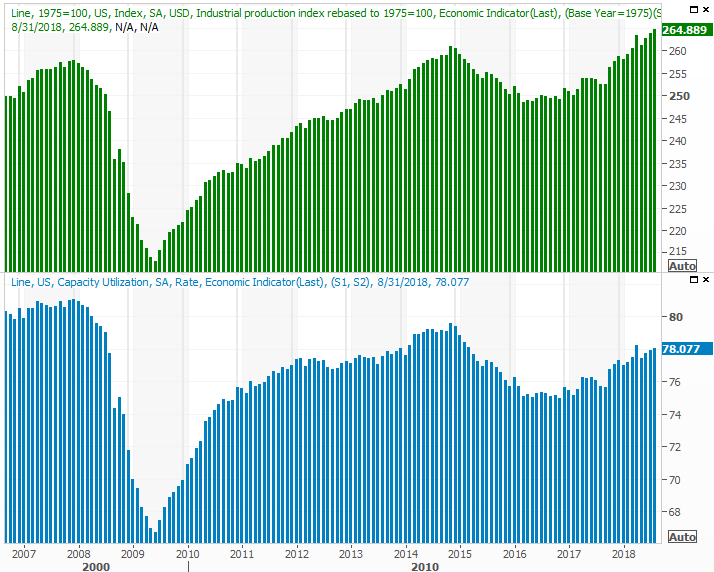
Source: Thomson Reuters
This is a particularly important premise to digest right now. With the bull market now lasting for a record-breaking duration, bull markets don't stop and start according to a calendar. Something causes earnings to contract or grow again. That's when markets turn.
That's not to suggest this bull market isn't nearing an end. It is to point out, however, that none of the signs we usually see at the beginning of an economic contraction are in view now.
Everything else is on the grid.
Economic Calendar
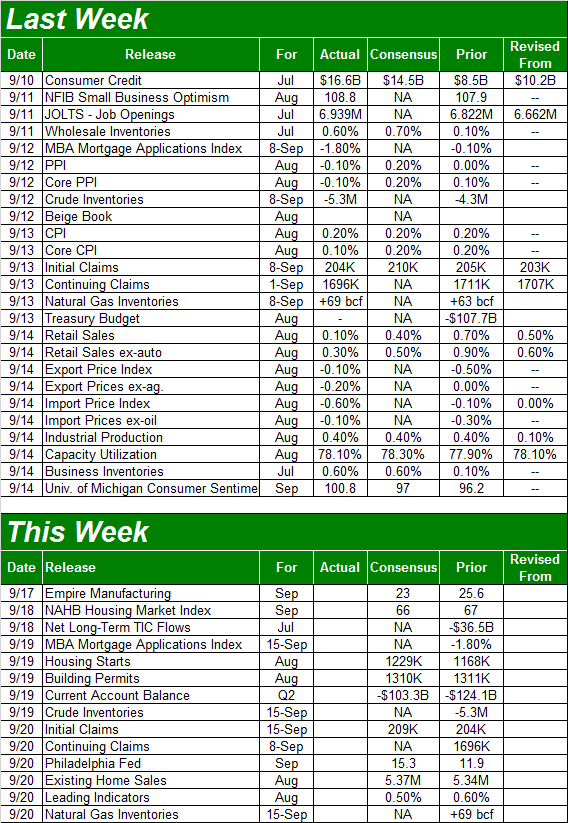
Source: Briefing.com
This week is going to be a relatively big one in terms of economic news. On Wednesday we'll hear about last month's housing starts and building permits. Though the overall economy has been strong, real estate has been a soft spot. The pros are calling for a slight improvement in starts for August, though permits will be about even. Even so, the environment for new construction isn't a thrilling one.
Housing Starts and Building Permits Charts
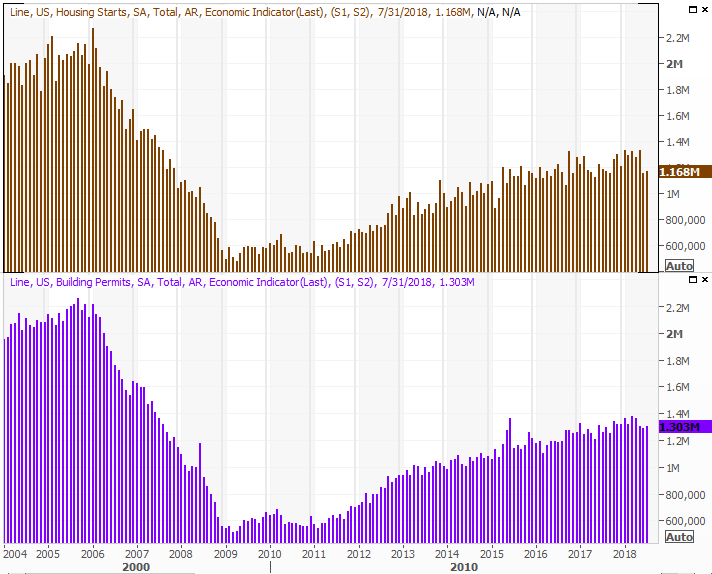
Source: Thomson Reuters
Also this week we'll start our look at real estate sales activity for August, with last month's existing home sales data due on Thursday. Economists are calling for a slight uptick in sales of existing homes. But, that won't be enough to reversal the broad (even if tepid) lull.
New and Existing Home Sales Charts
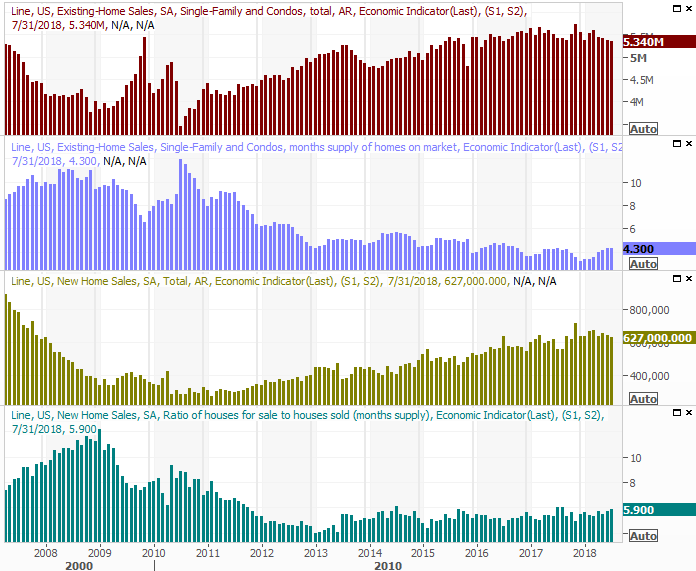
Source: Thomson Reuters
Next week we'll hear about last month's new home sales pace, though it's unlikely it will be able to break out of the same overall slump.
Index Analysis
Just for perspective, let's start this week's analysis out with a look at the bigger-picture weekly chart. The uptrend that's been underway since early July is still intact; the previous week's pullback was just a blip.
S&P 500 Weekly Chart, with Volume
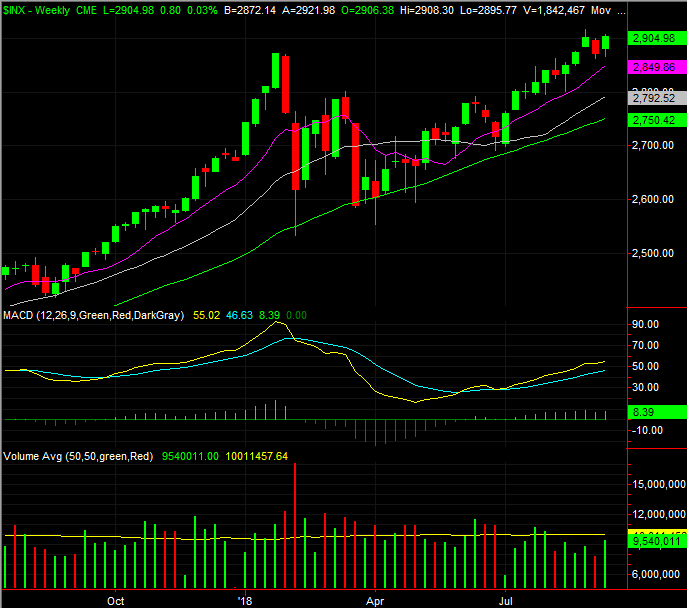
Source: TradeStation
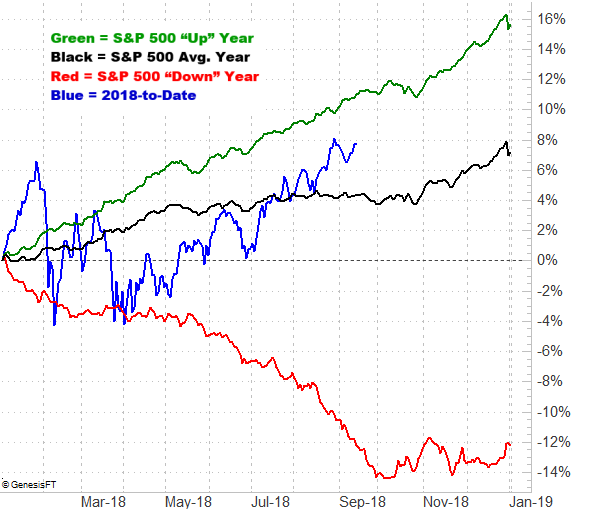
If this is frustrating to you, you're not alone. The market is technically overbought and arguably overvalued, but that's not necessarily been a problem in the past. Making matters even more confusing is the fact that of all the months that should be rough on stocks, it's this month. September is more often a loser than a winner, averaging a 0.6% dip. Aside from that, the S&P 500 is up 8.0% year-to-date, and would normally only be up 4.7%. That adds to the potential profit-taking pressure.
Yet, there it is... an unlikely rally that's still going strong.
S&P 500 Average Day-to-Day Results
Source: TradeNavigator
It would be naive to believe there's something besides the prospect of the tariff war coming to an end that's driving the rally. This buying may even be a good bet. Be cautious here though. "Buy the rumor, sell the news" has become a cliche for a reason, and it may be a stark reality in the foreseeable future.
Just as troubling is the potential, eventual impact of a failure to end the tariff war.
Zooming into the daily chart frames this uptrend with more detail. It's on this chart we can see the guideposts that have been directing the S&P 500 higher since April. We can also see that the lull from a couple of weeks ago only had to kiss the 20-day moving average line (blue) to reverse that selling and renew the uptrend.
S&P 500 Daily Chart, with VIX and Volume
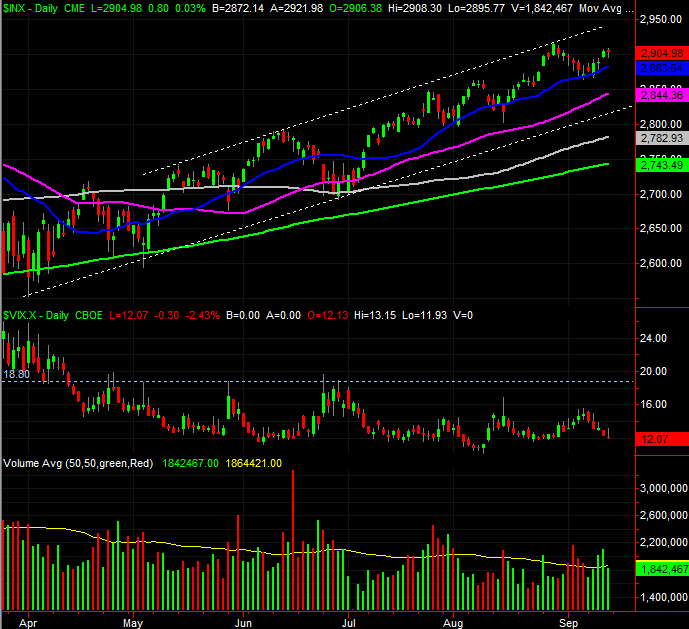
Source: TradeStation
The S&P 500 is up 13% from its early April low... an amazing run for less than six months time. It's not the kind of move that doesn't leave traders wondering if it's time to take some profits though.
The trend is bullish, so we have to be as well. This isn't a market or a situation you can afford to turn your back on though... ever. Though there are several lines that could act as technical floors below the S&P 500's current value, if the bears decide to pull the trigger, there's no guarantee any of them will matter.