Weekly Market Outlook - Ripe for Profit-Taking, Sellers Dig In
After playing with fire for several weeks, the weight of the gains since early June finally took their toll. The S&P 500 fell 3.1% last week... the biggest setback since late-May, though the same setback that immediately preceded a major rebound move. This stumble, however, didn't take shape at the end of a selloff. It may just be the beginning of one.
Or, maybe it isn't. As rough as last week was, by the time Friday's closing bell rang we saw the bulls finally starting to push back, and a crucial moving average line stepped up as support. Though this is usually a tepid time of year, the sheer speed of last week's tumble could lead into a dead-cat bounce this week. The question is, will a dead-cat bounce turn into something more?
We'll explore possible answers to that question below. First, however, let's recap last week's major economic announcements and preview this week's releases.
Economic Data Analysis
It was an overly-busy week, loaded with economic news at a time when most traders were distracted by the sheer velocity of the market's pullback. In order of appearance....
Last week once again acknowledged that the housing market's growth was slowing down. That was confirmed - again - last week with another lackluster look at home prices. The Case-Shiller Index, though up for May, fell a bit short of expectations, and slowed down from April's pace. That slowdown mirrors similar data from the FHFA, and real estate sale data.
Home Price Index Charts

Source: Thomson Reuters
It's possible the recent rate cut could spur new demand that in turn spurs higher prices. In fact, in June purchase activity perked up. Even so, not more than ten years into an economic expansion cycle, it's arguable that prices are 'maxed out' and that anybody who wanted to buy a home has already done so.
It was also a big week for consumer sentiment. Not only did we get the third and final look at the Michigan sentiment index for July, we also got the Conference Board's consumer confidence measure for last month. The latter was catapulted to near a multi-year high, reaching 135.7. The Michigan sentiment measure didn't mimic the move, but at 98.4, it's near a recent (and long-term) ceiling. Both bode well for future growth, despite largely pessimistic headlines.
Consumer Sentiment Charts

Source: Thomson Reuters
Clearly neither of those announcements were the biggies for last week, however. The show stoppers were, of course, the Federal Reserve's decision on interest rates and last month's jobs report.
The FOMC did lower rates, by the expected quarter of a point. But, it was something of a begrudging move, with Fed Chairman Jerome Powell making clear that a rate-hike rather than another rate cut was very much a possibility, if need be.
As for July's jobs report, it was solid... nothing to complain about. The 164,000 new payrolls added to the economy was on target, and though it wasn't enough to lower the unemployment rate, at 3.7%, it's about as low as it can feasibly get.
Unemployment Rate, Payroll Growth Charts

Source: Thomson Reuters
We took a detailed look at July's job numbers at the website, here: https://www.bigtrends.com/education/markets/july-jobs-report-couldnt-have-been-any-more-perfect
One more item from last week that's not necessarily hard-hitting, but noteworthy all the same - July's automobile sales. They fell, not dramatically, but enough to suggest the bigger-picture decline since 2015's peak remains intact.
Automobile Sales Charts

Source: Thomson Reuters
Everything else is on the grid.
Economic Calendar
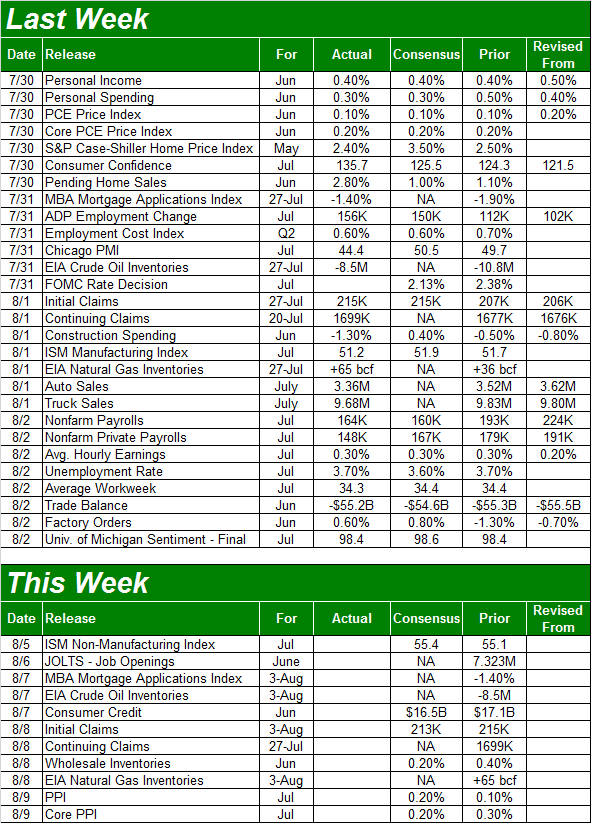
Source: Briefing.com
This week is going to be considerably slow... strangely slow, in fact. There are two items worth noting, however.
One of them is the updated look at the ISM Non-Manufacturing (Services) Index. It's expected to make a little forward progress, from June's score of 55.1. That would take shape despite the slight decline in the ISM Manufacturing Index for July, from 51.7 to 51.2.
ISM Index Charts
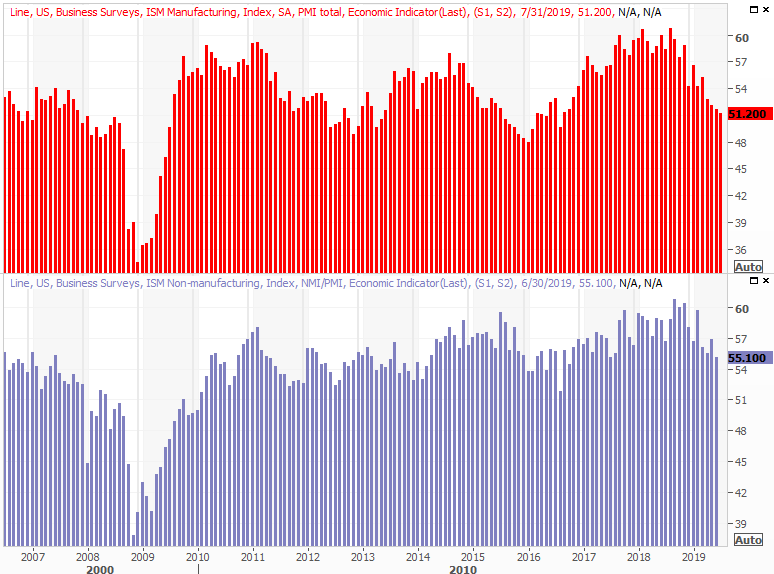
Source: Thomson Reuters
Even so, note that both ISM indices are slumping.
The other information you'll want to keep an ear/eye out for is Friday's look at inflation, via July's producer inflation data. It's not quite as telling and the consumer inflation report that will be posted early next week. But, with economists looking for healthy producer inflation, odds are good consumer inflation will be firm as well.
Producer, Consumer Inflation Charts
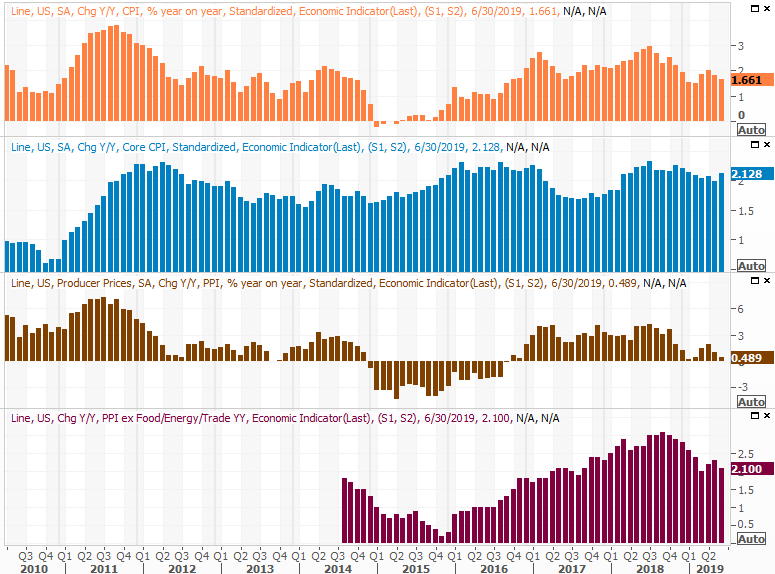
Source: Thomson Reuters
This is going to be critical data. Though we won't yet see the inflationary impact of last month's rate cut yet, if inflation is already brewing even before the rate cut becomes official, it could swell to uncomfortable levels when lower interest rates leave it unchecked.
Stock Market Index Analysis
The fragile rally was up-ended last week, with the S&P 500 losing 3.1% of its value in just five trading days. We've suffered worse, and snapped back from worse. But, the stumble is uncomfortably reminiscent to the beginning of the major selloffs we've seen since early 2018.
Still, it can't be ignored that the S&P 500 found support where it most needed to find support at the one place where it needed to.
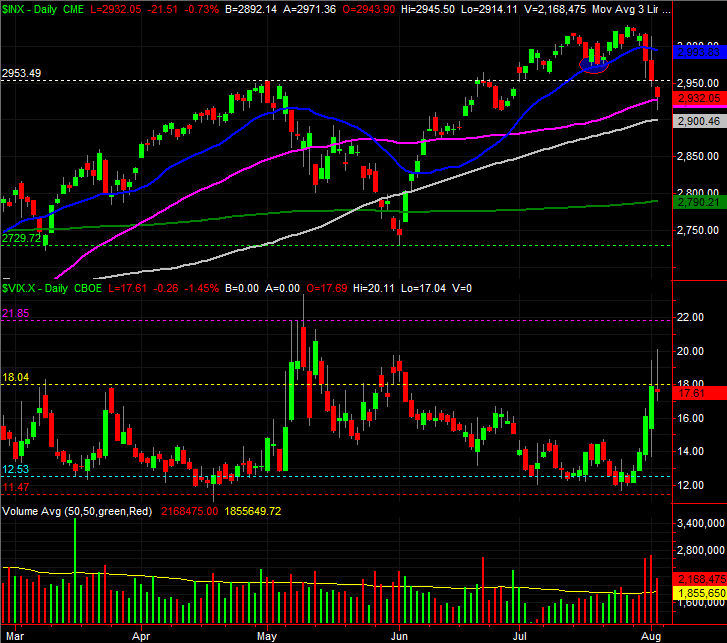
That's the 50-day moving average line, plotted in purple on the chart below. The S&P 500 fell briefly below that level on Friday, but by the time the closing bell rang it was back above it. Notice the VIX also temporarily popped above its key ceiling around 18.0 on Thursday and Friday, but neither day was it able to close above it. Both suggest there's a brewing pivot here. It may be permanent, or it may be temporary. Or, it may not materialize at all. It's a possibility that has to be acknowledged at all.
S&P 500 Daily Chart, with VIX, Volume
Source: TradeStation
Zooming out to the weekly chart of the S&P 500 we can gain some crucial perspective. The index has been unable to move above a major technical ceiling that lines up the major peaks from early 2018 and September of 2018. That, along with the sheer speed and size of the 27% advance since late last year, left the index vulnerable to such a setback. As the longer-term history of this chart suggests, once the sellers take their first big shot, they tend to continue working the market lower.
S&P 500 Weekly Chart
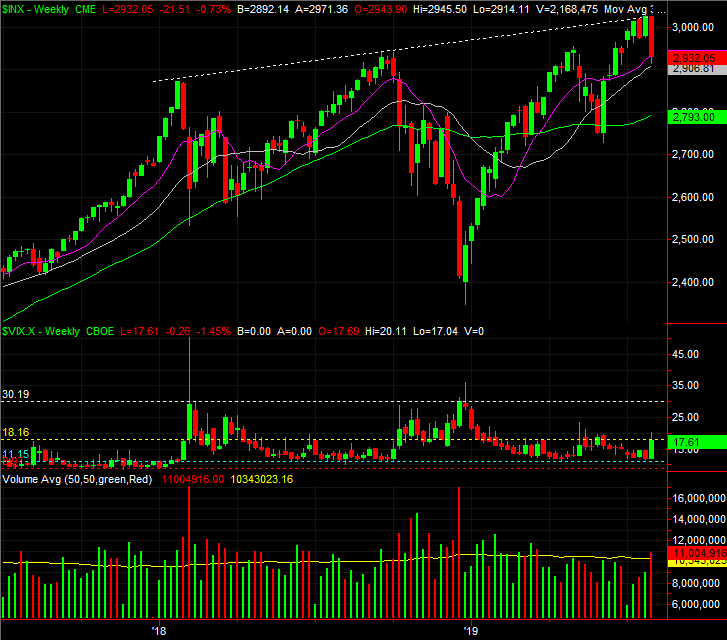
Source: TradeStation
The daily chart of the NASDAQ shows the same basic situation. Namely, it too found support at the purple 50-day moving average line. The VXN is also hinting at a downside move, reversing last week's advance. That's a bullish hint for the broad market.
NASDAQ Composite Daily Chart, with VXN, Volume
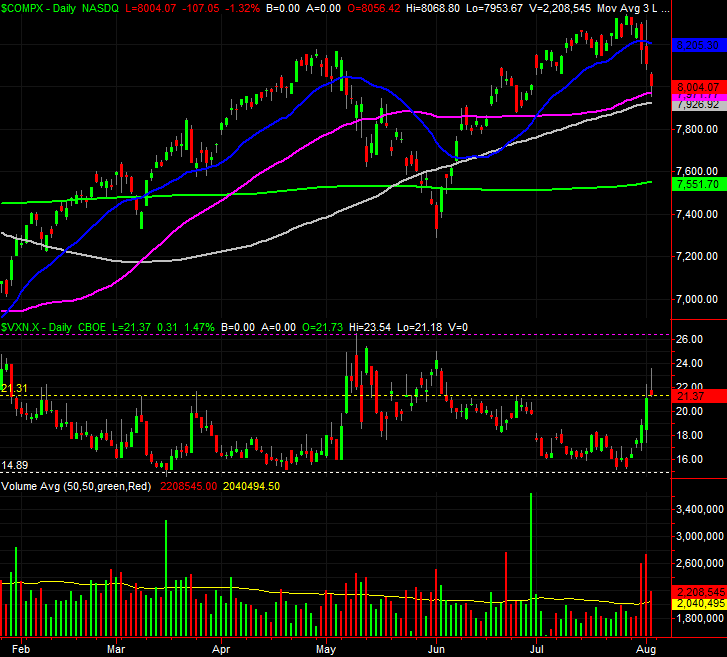
Source: TradeStation
This is very much an 'on the fence' scenario. The current tide is clearly bearish, though the fact that the 50-day moving average line stepped up as a floor can't be ignored. It also can't be ignored that, given its history, the market is due for more downside before a true capitulation has been made.
With that as the backdrop, seemingly the most likely outcome here is a modest effort to rekindle the rally by pushing up and off the 50-day moving average line, followed by another more successful attempt that carries the market closer to its 200-day moving average line. For the S&P 500, that's around 2790.
There are two semi-related clues leading us to an assumption that, while we're not quite at 'the' bottom yet, the trip to that bottom should be a fairly short one.
One of those clues is the fact that, though the put/call ratio trend line isn't yet back to a more absolute ceiling around 1.00, it's now en route there, and it doesn't take long to get there once it gets started.
S&P 500 Daily Chart with Put/Call Ratio Trend
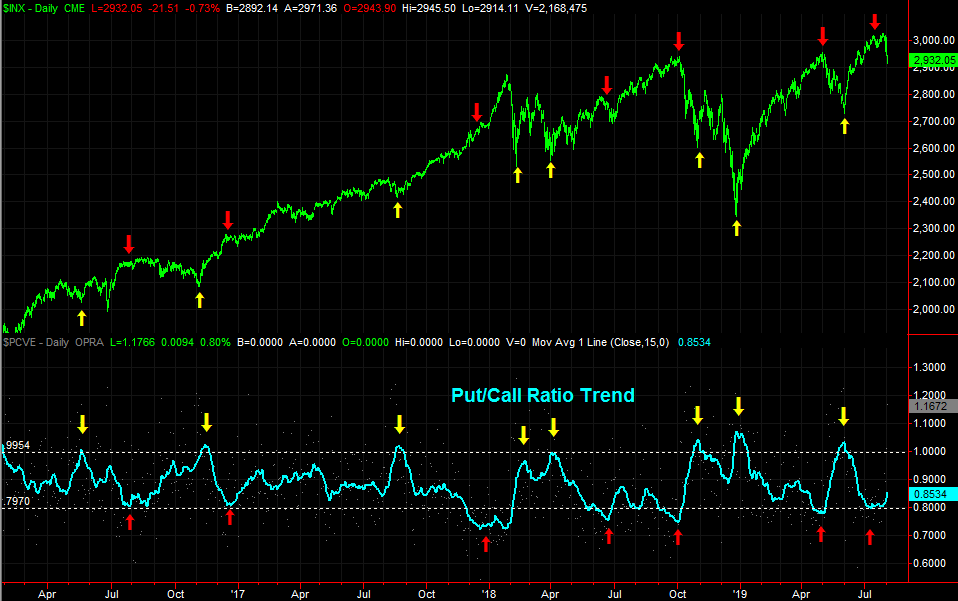
Source: TradeStation
The other clue is where the Trading Index, or Arms Index, average is right now. It's not yet at the point where a bottom is made more likely (due to an imbalance in breadth and depth). But, as was the case with the put/call ratio's trend, we're not too far from that point now.
S&P 500 Daily Chart with Trading Index (TRIN) Trend
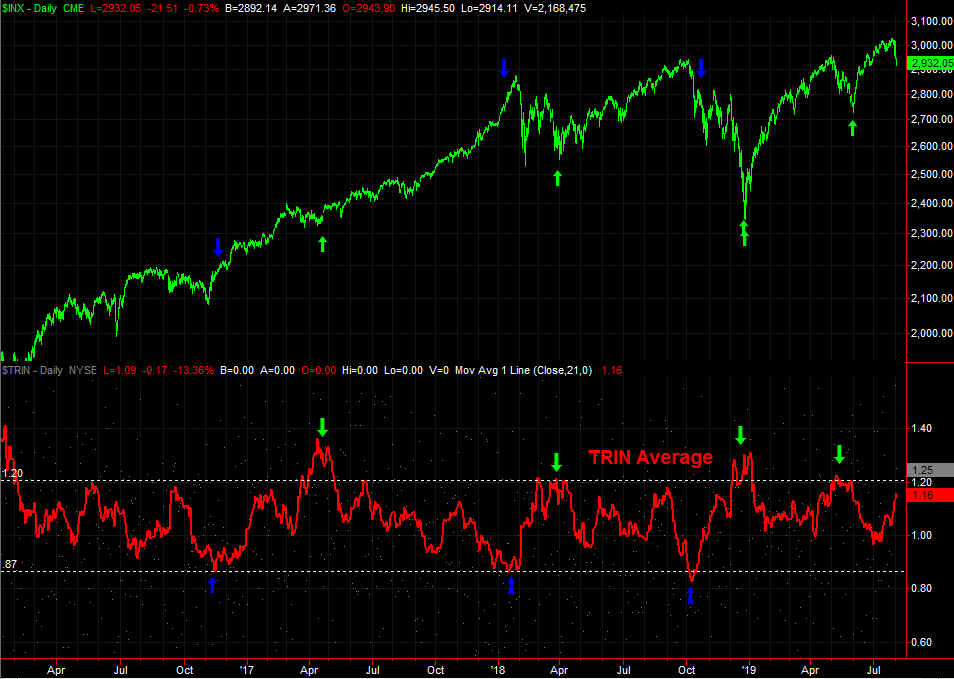
Source: TradeStation
Whatever's in the cards, it's important to not over-react or draw any sweeping conclusions based on one day's action, or even the action over the course of a few days. Not even the market knows where it's headed next, let alone traders. There's not a lot of conviction here on either side of the market.