Weekly Market Outlook - Onward & Upward, Though Most Traders Are Still On the Sidelines

Stocks may have started last week on the wrong foot, but ultimately, Monday's pullback ended up setting the stage for a bounce that would carry the market into record-high territory. Last week's close of 4411.79 for the S&P 500 was nearly 2% higher than the prior Friday's close.
And yet, there are legitimate worries. One of them is where Friday's rally finally stopped... at a technical ceiling first established in April. Another is the sheer lack of real interest in participating in this particular advance. None of last week's daily gains were on notably high volume, and worse, that volume waned the higher the market climbed. People in general aren't "feeling it" as much as they're just watching it. That's a problem.
We'll take a detailed, visual look at both ideas below. First though, let's run down last week's key economic reports and preview what's in the cards for this week. We're really getting a good look at the real estate picture.
Economic Data Analysis
Near-term construction projects will be... relatively lackluster. Although the number of building permits issued last month moved higher to a pace of 1.64 million (extending a long-standing uptrend), the number of permits issued in June fell to a multi-month low of just under 1.6 million.
Housing Starts and Building Permits Charts
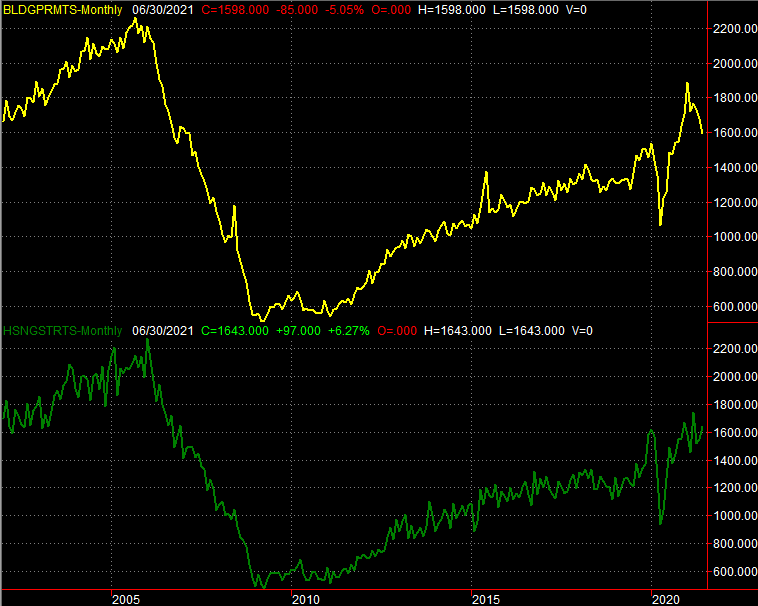
Source: Census Bureau, TradeStation
Surprisingly, this may well indicate a lack of buying interest much more than it reflects the soaring price of homes. Lumber price, after all, were largely reeled in last month. Sales of new homes also fell to multi-month lows in May, and while sales of existing homes ticked a little higher in June, it was a "just barely" improvement from May's reading, which was also a multi-month low.
New, Existing Home Sales Charts
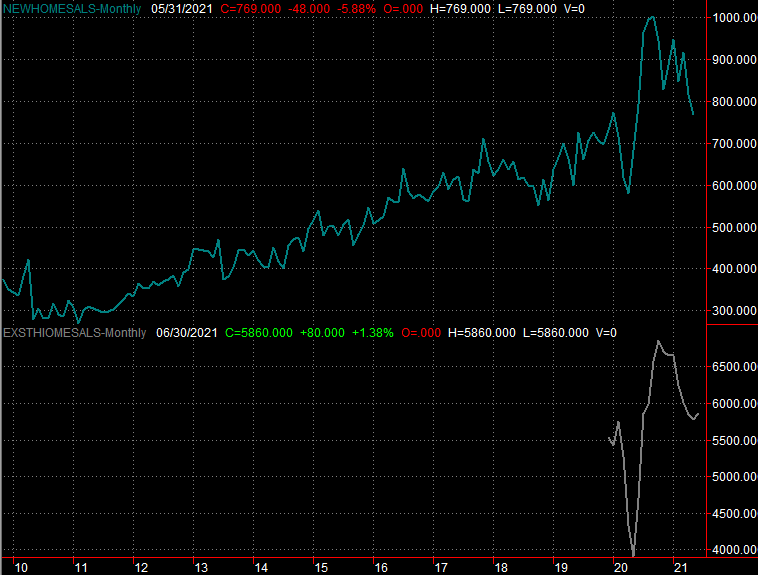
Source: National Association of Realtors, Census Bureau, TradeStation
New home sales figures for June are coming this week, as are a couple of different home pricing reports... albeit it for May. Though purchases are generally slowing, economists are calling for a quickened pace of new-home sales of 800,000. And, those same forecasters believe home prices themselves - the ones that are still being bought and sold - will be higher all the same.
In short, real estate remains a mixed bag. We can still say the glass is half full rather than half empty though.
Everything else is on the grid.
Economic Calendar
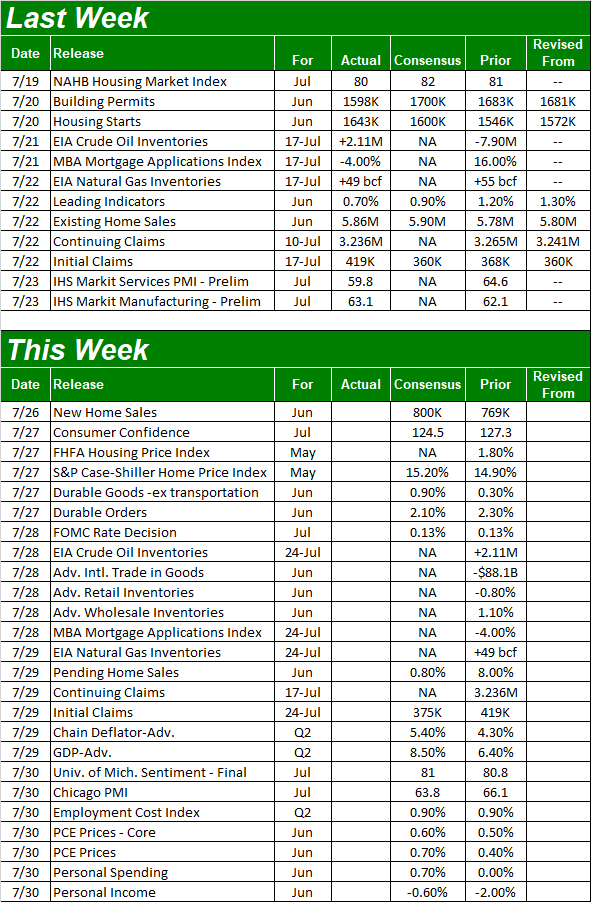
Source: Briefing.com
Aside from new home sales, as was noted, we'll also be getting a couple of key home-price snapshots... the FHFA Housing Price Index and the Case-Shiller Home Price Index. There's no forecast for the former, but the pros believe May's Case-Shiller figure will be 15.2% better than the year-ago comparison. Part of that big leap can be attributed to timing; we were in the throes of the pandemic last May. Nevertheless, both measures held up very well then, and accelerated beginning in the latter half of last year and are now deep into record high territory. The sheer cost of homes (regardless of lumber costs) could be at least part of the reason starts, permits, and purchases are slowing.
Home Price Charts
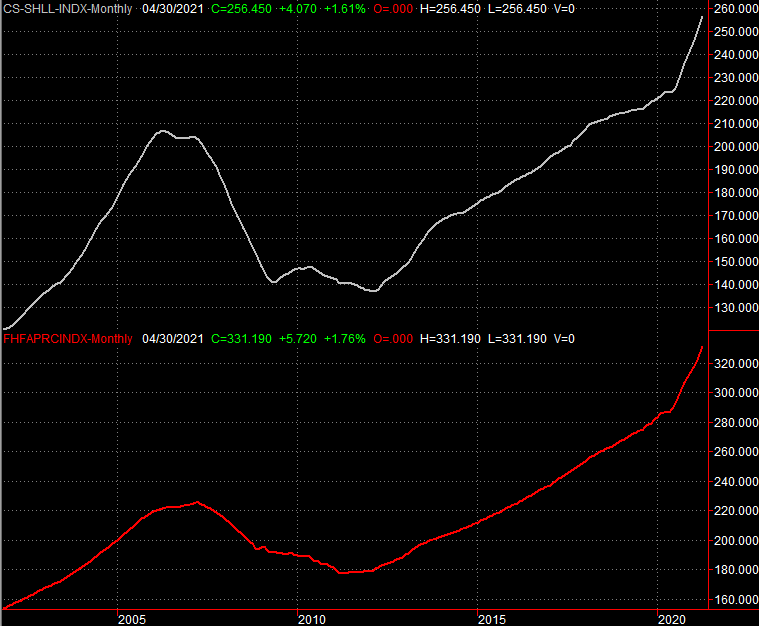
Source: FHFA, Standard & Poor's, TradeStation
It's also going to be a big week for consumer sentiment measures. The Conference Board's consumer confidence report for July is coming on Tuesday, while the third and final look at the University of Michigan's sentiment data for July is due on Friday. Both are expected to have peeled back a bit from June's numbers, though at least for the Conference Board's data, June's bar is set quite high.
Consumer Sentiment Charts
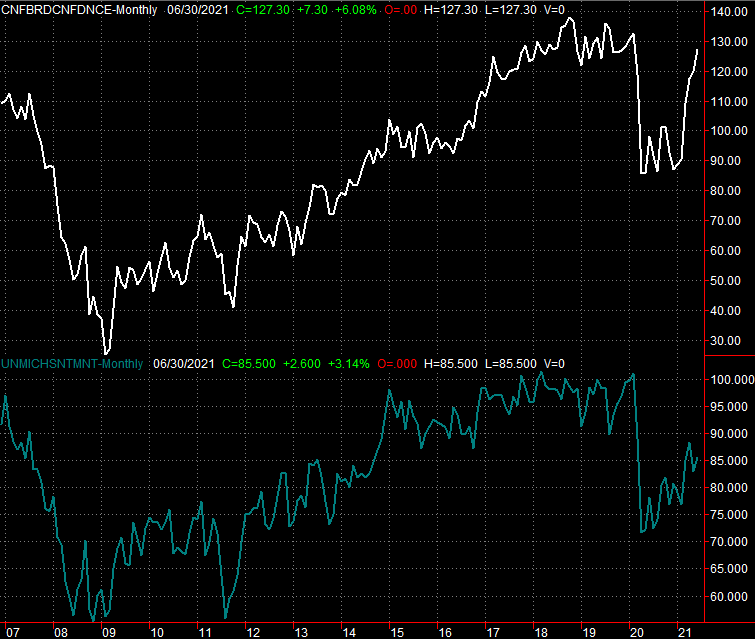
Source: Conference Board, University of Michigan, TradeStation
There's more. Although there's nothing really to chart, the Federal Reserve will be making a decision on interest rates on Wednesday, and on Thursday we'll hear the first estimate of Q2's GDP growth rate.
As for interest rates, don't look for any change - the FOMC is likely to keep rates as low as structurally possible despite inflation levels turning uncomfortable. But, do pay attention to any changes to the language associated with the decision.
As for GDP, economists are calling for an 8.5% improvement, accelerating from Q1's increase of 6.4%. Just bear in mind those big figures are being compared to famously poor year-ago results, exaggerating growth now.
Stock Market Index Analysis
Last week's advance was impressive to be sure, but also fundamentally flawed.... for a couple of reasons. The first of those reasons is, at least for the S&P 500, the rally was stopped cold at a key technical ceiling. Take a look at the index's daily chart below. The line that connects all the key highs made since April (orange) was -- suspiciously -- also Friday's high.
S&P 500 Daily Chart, with VIX and Volume
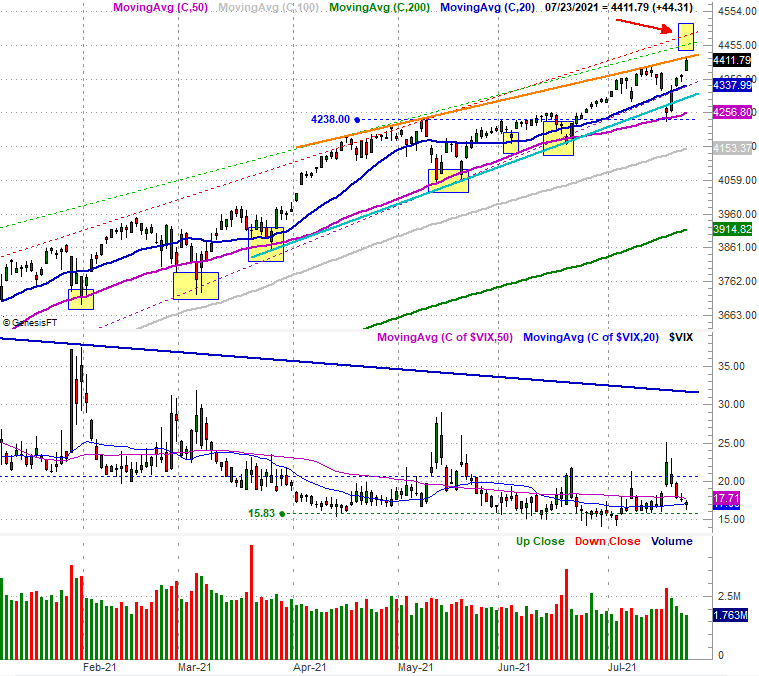
Source: TradeNavigator
And that's not the only concern. Take a look at the volume bars at the bottom of the chart. Tuesday's rebound unfurled on respectable volume, but failed to match the volume seen during Monday's drubbing. Perhaps more concerning is the fact that volume waned each and every day following Tuesday as the S&P 500 was climbing. It's a hint that only a handful of traders are willing to participate on the advance. That's a problem simply because for a rally to last, it has to gather participants as it moves.
And the above chart's volume data isn't some sort of misleading optical illusion.
When breaking down the NYSE's "up" volume ($UVOL) from its "down" volume ($DVOL) as we do on the graph below, there's no denying we're seeing waning interest in the advance. In fact, the bigger "up" volume trend has been sinking since early June. (Look at the blue moving average lines to see the trend, and the highlighted box in to see falling "up" volume.) This bigger-picture downtrend wasn't really broken by the late-June surge in buying volume. In the same vein, the NYSE's daily advancers and decliners have also demonstrated the same trend since early June. The most recent portion of the marketwide rally isn't a majority opinion.
S&P 500 Daily Chart, with NYSE Advancers, Decliners, Up Volume, Down Volume
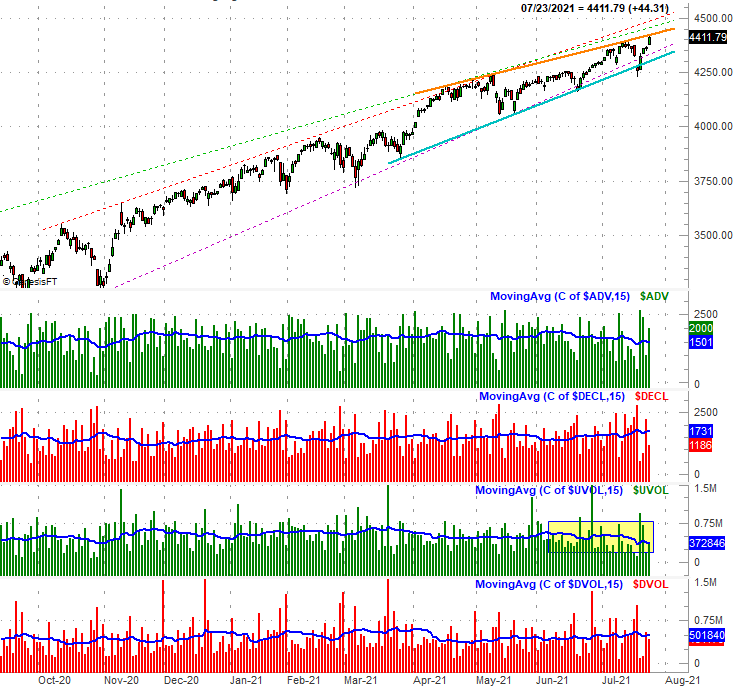
Source: TradeNavigator
Oddly, we're not seeing bearish-leaning levels of breadth and depth from NASDAQ listings. That is to say, the NASDAQ's "up" volume ($UVOLQ) has indeed been trending upward sine late June, while its "down" volume ($DVOLQ); its advancers and decliners trend haven't been nearly is decisive. Even so, this appears to be a bullish undertow.
NASDAQ Composite Daily Chart, with NASDAQ Advancers, Decliners, Up Volume, Down Volume
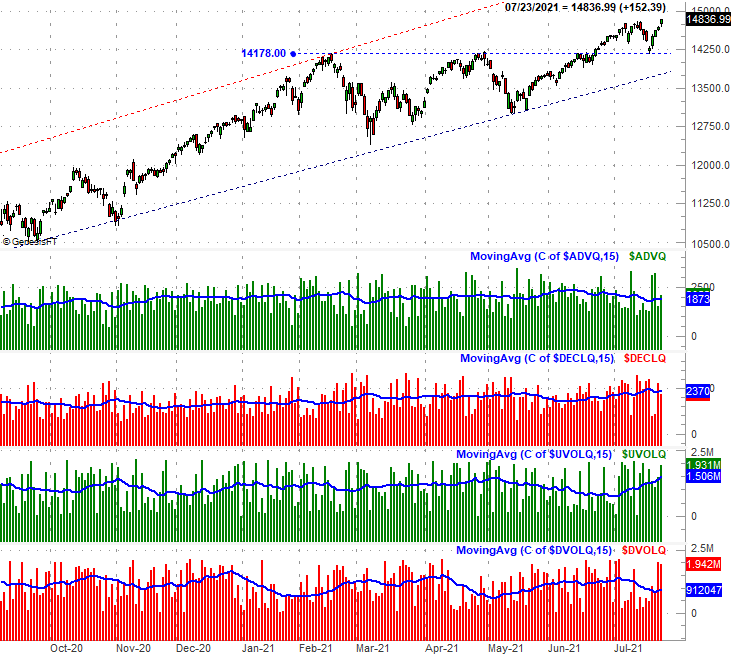
Source: TradeNavigator
This chart just might paint a misleading picture, however.
We talked about it in depth at the website on Friday (https://www.bigtrends.com/education/etfs/this-rally-remains-strangely-poorly-balanced), but here's the short version of the story: The marketwide rally seen since early June isn't "marketwide" at all. It's being led - and dominated - by the large cap growth and technology stocks that make up the vast majority of the NASDAQ's total market cap. We're talking about Amazon (AMZN), Apple (AAPL), Facebook (FB), and all of its other most familiar peers. These stocks are the only stocks up since mid-June, and for all intents and purposes, they're the only stocks meaningfully higher since April.
Market Cap & Style Performance
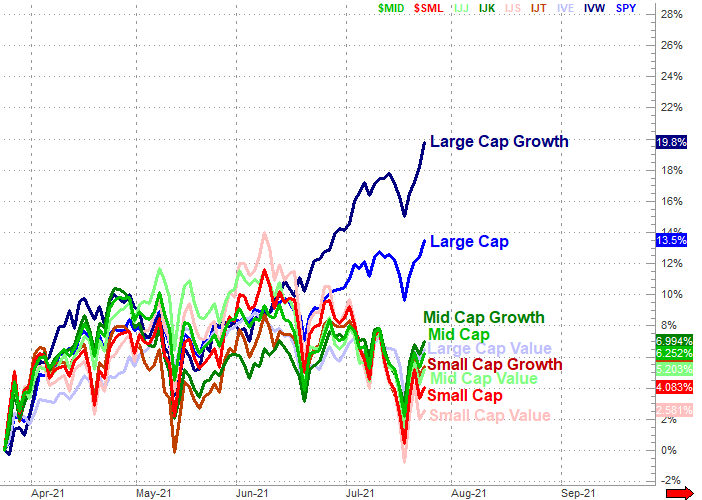
Source: TradeNavigator
And yet, this imbalance doesn't inherently mean the NASDAQ Composite is due a stumble straightaway. In fact, it's in pretty good technical shape. The former ceiling at 14,189 has since turned into a technical floor (blue, dashed), and there's nothing standing in its way again until the 16,100 area (highlighted), where the upper boundary of its long-term trading range lies. It may not be a well-balanced or well-supported rally, but there's room for such a rally all the same.
NASDAQ Composite Daily Chart, with VXN
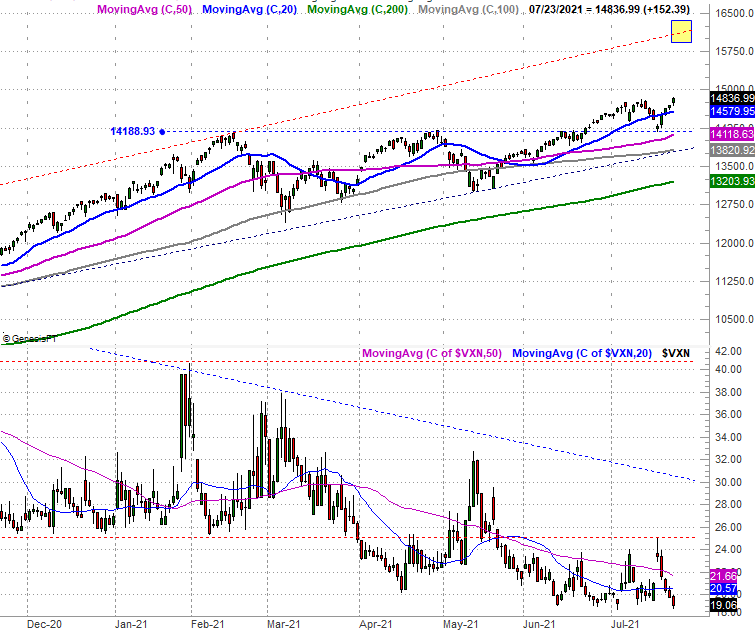
Source: TradeNavigator
It's a tricky situation, with good reasons to sit on either side of the table. You don't have to make that choice just for the sake of taking a stand though. The smart-money move right now may be waiting on the sidelines -- as most people seem to be doing -- and watching this all play out. We are overdue for a correction, and a pullback through September and into October would actually be a welcome thing, setting up the usual year-end bullishness. Let's not get too presumptive based on hopes or assumptions though. Let's instead wait for the market to tip its hand. It hasn't yet, which means we have to assume the current bullish momentum is intact.