
Determined to keep the bigger rally alive, the bulls shrugged off the weakness from two weeks back to log a gain for last week, pushing stocks to a record high (and record high close) in the process... even the NASDAQ, which had been lagging. It's the wrong time of year and wrong situation for bullishness, but as the old saying goes, you can't fight the tape.
This adage is admittedly getting harder to trust. The S&P 500 now stands 87% above last March's low, at a time when economic growth seems tougher to muster - some of the recent economic news has been less than thrilling. From the momentum perspective we have to adopt though, again, don't try and fight the tape... at least not until we have a clear reason to do so, which we don't yet.
We'll dissect everything in detail below. Let's first recap last week's economic reports and preview what's coming this week. The grand finale is a critical jobs report.
Economic Data Analysis
Last week was a busy one in terms of economic news, but not a terribly important one. The only items of interest were May's new and existing home sales, as a barometer of the real estate market's health. It could be better. New home sales fell, and fell well short of expectations. Sales of existing homes -- of which there's a bit better inventory levels -- cooled just a bit, slightly topping forecasts. More than that though, we can see that purchases are well off peak levels seen in the middle of last year.
New and Existing Home Sales Charts
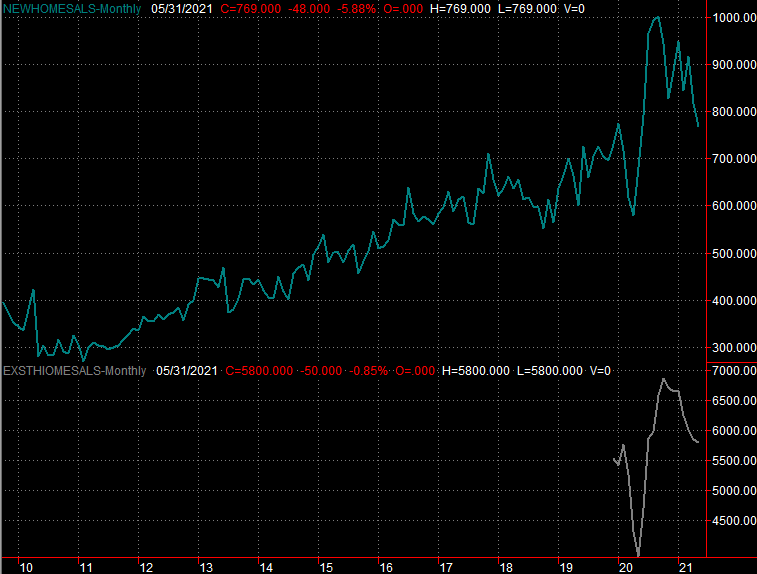
Source: National Association of Realtors and Census Bureau, TradeStation
As was noted, a lack of inventory is an issue. This may also be an indication of waning interest too, however, or lack of creditworthiness. Whatever the cause, things are clearly moving in the wrong direction here.
The only other item worth noting is the third and final update of Q1's GDP growth rate. It did indeed roll in at 6.4%, as the second guess suggested. This is certainly encouraging, though bear in mind this data is very dated. We're almost at the end of Q2, and things seem to have changed dramatically in the meantime.
Everything else is on the grid.
Economic Report Calendar
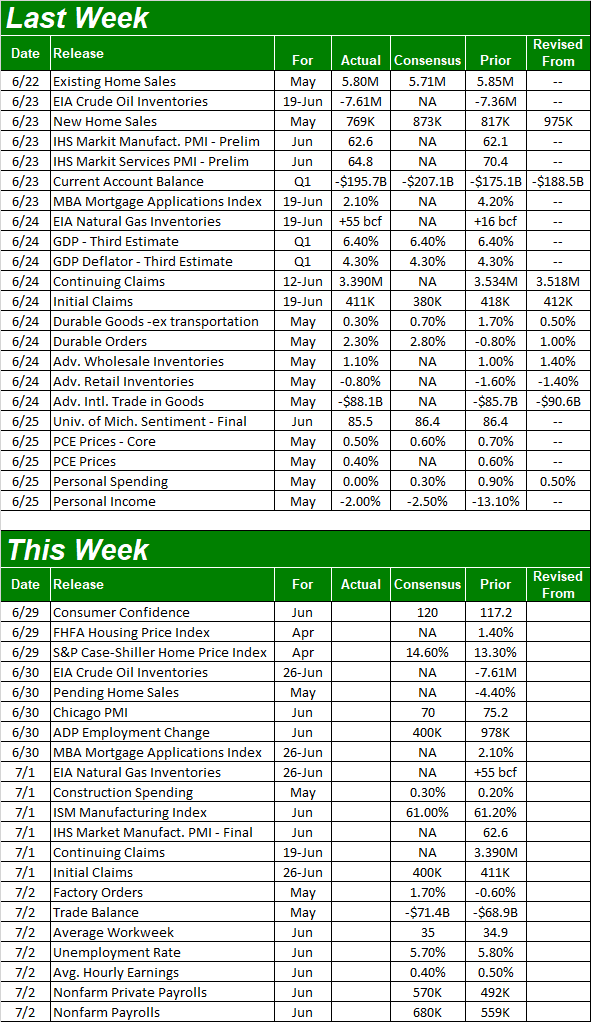
Source: Briefing.com
This week is loaded, beginning with Tuesday's look at the Conference Board's look at consumer confidence. We got the third and last look at the University of Michigan sentiment reading last week; it came in up just a bit from May's final look, and the Conference Board's figure is expected to edge a bit higher as well. Note that both measures are both in healthy uptrends, even if they're both still below pre-COVID highs.
Consumer Sentiment Charts
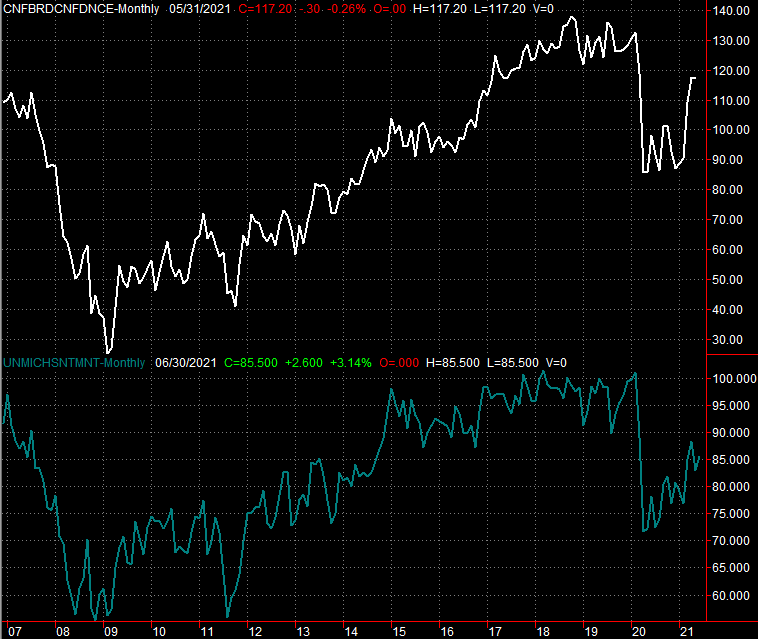
Source: Conference Board, University of Michigan, TradeStation
The real estate picture also gets rounded out this week, with a look at home prices. The FHFA Housing Price Index and the S&P Case Shiller Home Price Index will both be posted on Tuesday day. Despite slowing purchases, prices are soaring... another sign that it's a lack of supply that's causing the purchase slowdown. Prices are projected to rise again.
Home Price Charts
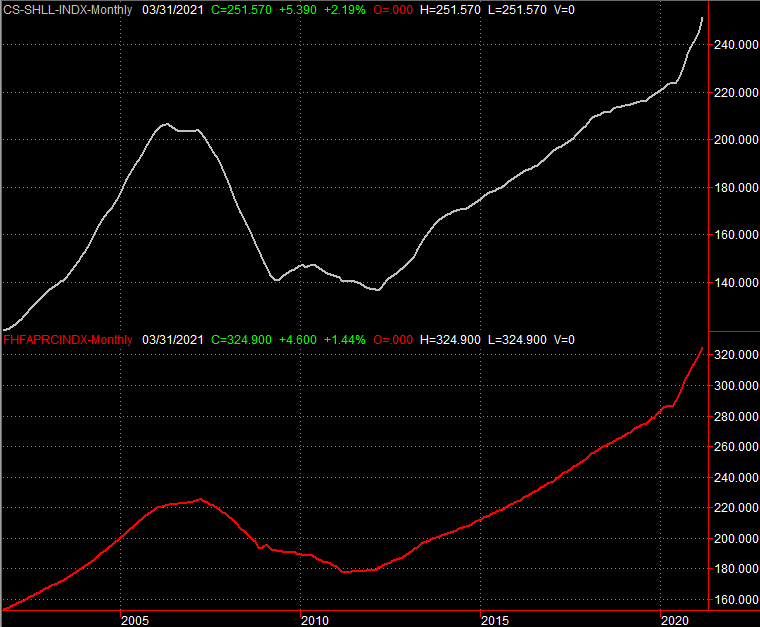
Source: Standard & Poor's, FHFA, TradeStation
Two things to note about the home price trend: First, it's reached an unhealthy, unsustainable growth pace. Second, Tuesday's numbers are for April, and not May. If things have changed in the meantime (and it seems as if they've at least started to), don't be shocked to see a sharp reversal.
On Thursday we'll hear from the Institute of Supply Management about June's manufacturing activity; the services report won't be out until next week. Economists do believe manufacturing activity is leveling off, although it's leveling off at a very healthy level of the low 60's.
ISM Manufacturing and Service Charts
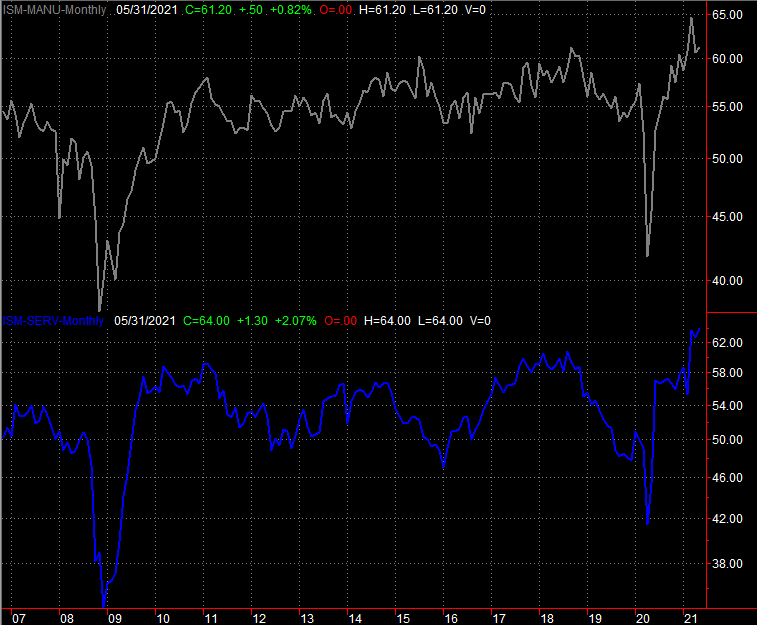
Source: Institute of Supply Management, TradeStation
Finally, on Friday brace for what might be the most important unemployment report we've had in a long while. The forecast is for 680,000 new payrolls, which should drive the unemployment rate down from 5.8% to 5.7%. There's no room for error though, and given the struggle/trouble we've seen getting this last of pandemic-displaced workers back to work, a little bad news could do a lot of damage.
Unemployment Rate and Payroll Growth Charts
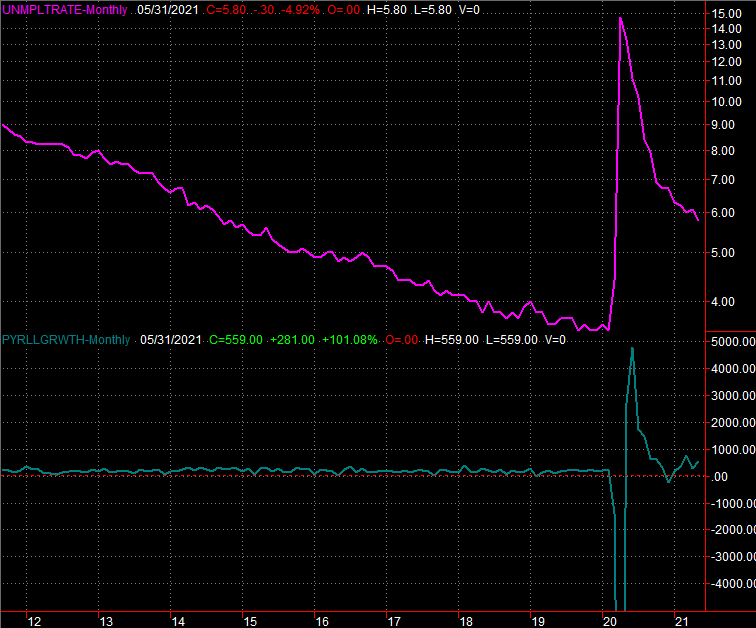
Source: Department of Labor, TradeStation
Stock Market Index Analysis
Just when it looked like the bears were taking over, the bulls landed a pretty solid punch. More specifically, despite the previous Friday's close below the 50-day moving average line (purple) as well as a rising support line that connects all the key lows going back for months (purple, dashed), the buyers started last week on a mission and never looked back. Notice the S&P 500 made firm progress past a horizontal resistance line at 4238 (blue, dashed) to log a record high, record high daily close, and record high weekly close all on Friday.
S&P 500 Daily Chart, with VIX and Volume
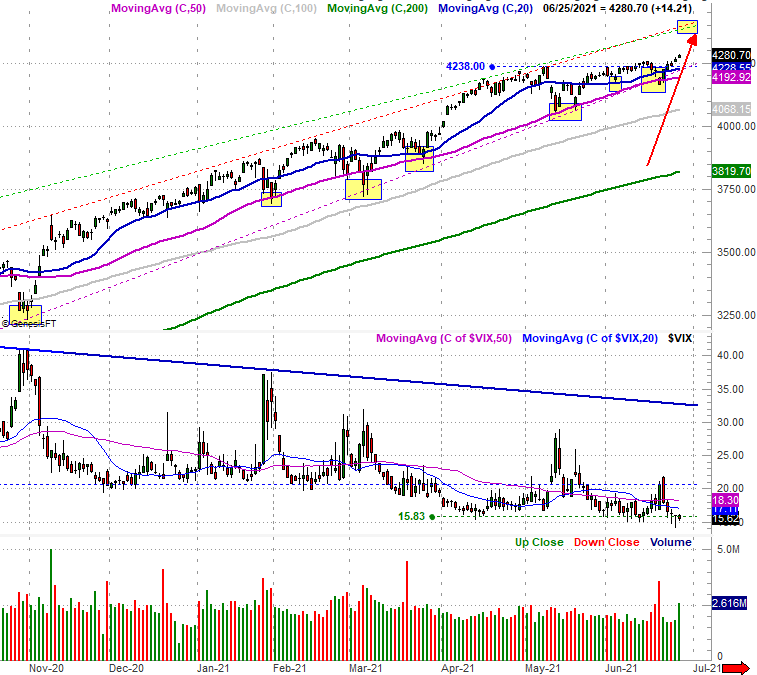
Source: TradeNavigator
The unlikely move did more than defy the calendar. It bought the bigger-picture rally some time. Assuming the upper boundary of the long-term trading range (the dashed red and green lines) that's been guiding the S&P 500 upward since April of last year, the bulls shouldn't bump into any technical trouble until the index gets to the 4400 area (highlighted; see the red arrow).
That doesn't mean the market won't pull back a bit, as profit-takers test the buyers. But, the path of least resistance here is upward, not downward. There's all sorts of technical support levels below, most in the form of moving average lines.
Zooming out to the weekly chart of the S&P 500 offers us some more perspective, but it's the Volatility Index (or VIX) that's so interesting here. We've been waiting for some time for the VIX to make a clear upward thrust, signaling a major shift toward bearish sentiment. If you look closely though, the VIX is starting to push below what had been a developing floor around 15.3. If this floor fails to hold up, the next stop is near 11.0, which was the absolute floor late last year and early this year before the pandemic uprooted.... well, everything. Do note that the market continued to log gains while the Volatility Index simply drifted sideways just above the 11.0 mark for weeks. There's no reason to assume it can't happen again.
S&P 500 Weekly Chart, with VIX and Volume
Source: TradeNavigator
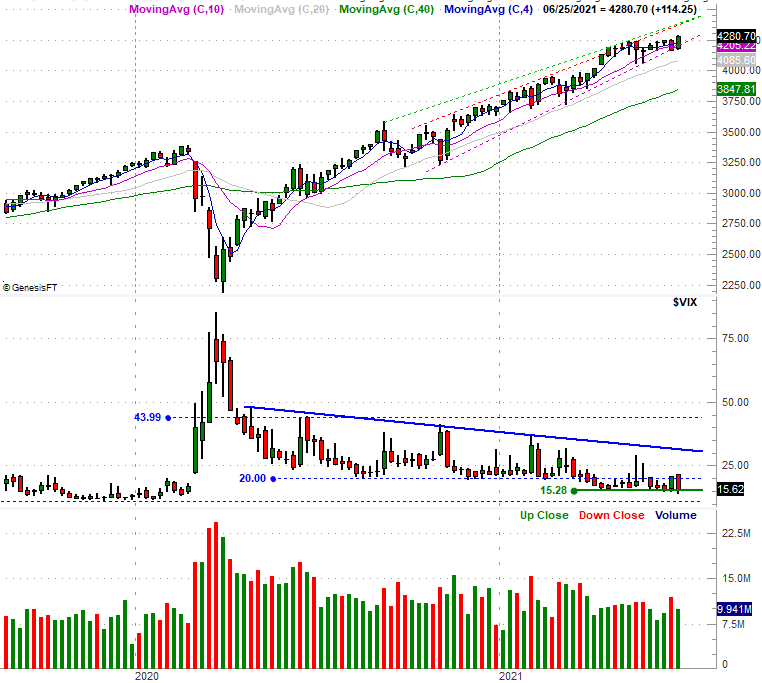
The red flag the VIX can potentially wave is still the same. That's a move above the falling ceiling (solid blue) that's been steering it downward since the middle of last year. It could take weeks for the S&P 500's volatility index to even get in position to make such a move though, just as it could take weeks for the S&P 500 itself to start breaking below its longer-term moving average lines that would signal a more serious correction. The "in between" is about 10% span though, so waiting for that cue could mean you've waited too long to start bailing out of longs. The charts sure aren't making it easy to be a trader here!
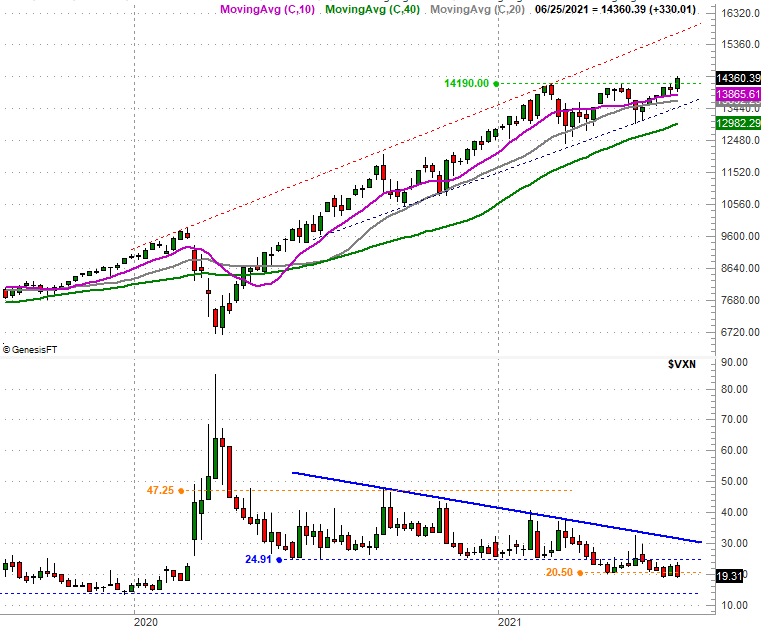
As for the NASDAQ Composite, same story. The index finally blasted past a horizontal ceiling at 14,189, and now that it has, the deck is cleared (so to speak) for a move to the upper boundary of the composite's long-term trading range. Its current position is 15,806 (highlighted), though bear in mind that upper resistance level (red, dashed) is rising every day.
NASDAQ Composite Daily Chart, with VXN
Source: TradeNavigator
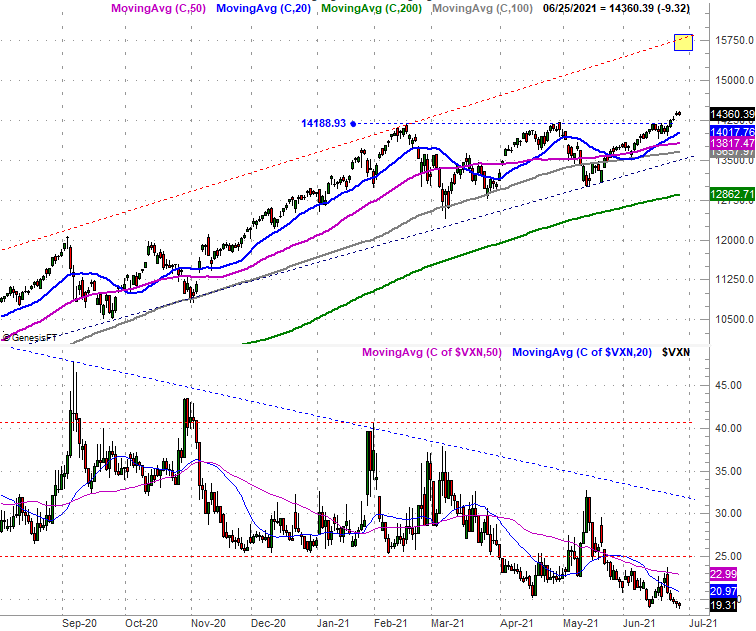
Pulling out to a weekly view of the NASDAQ Composite puts this whole thing in perspective, but perhaps more important, put the NASDAQ's Volatility Index (VXN) in perspective. Similar to the S&P 500's VIX, the VXN has once again broken below a floor around 20.5, opening the door to a slide all the way to late-2019's low near 13.5.
NASDAQ Composite Weekly Chart, with VXN
Source: TradeNavigator
While it's a technical breakout with a clear path to higher highs, be cautious... although admittedly, that's always good advice. It's great advice right now, however, as this isn't something that should still be able to happen.
Regardless of what happens early this week, realize that a rough start and a little selling isn't necessarily a sign that the breakout has failed. These moves are processes more than events, and as long as both index's key moving average lines hold up as support levels, the uptrend technically remains intact. The same is true until the VIX and VXN both break above their respective falling resistance lines.