Weekly Market Outlook - Not the Kind of Win the Bulls Wanted, But Still a Win
The market may have ended last week with a gain, but it was anything but the ideal kind of progress. Not only did stocks end the week with a whimper, they ended it ultimately facing the wrong direction in the shadow of a major pivot signal... a pivot out of an uptrend and into a downtrend. There's room and reason for more downside.
Problem? We're nearing the point where the market starts to pick up bullish steam and log a year-end rally.
We'll take a look at what's wrong and right about the effort below. First though, let's recap last week's most important economic news and preview what's in store for this week. It's not going to be a terribly busy one, but it is a big one for real estate numbers.
Economic Data Analysis
Inflation, to put is simply, is under control. The annualized consumer inflation rate now stands at 1.4%, or 1.7% not counting food or energy costs. Producers are facing inflation of 0.4% year over year, or 0.7% on a core (ex-food and ex-energy) basis.
Consumer, Producer Inflation Charts

Source: Bureau of Labor Statistics, TradeStation
This is good. Although consumerism/consumption is actually pretty brisk (more on that in a moment), price increases are mostly palatable. That said, do know that there are whispers circulating that inflation could run out of control in the foreseeable future, fueled by the oft-discussed V-shaped recovery in an environment where interest rates are at rock-bottom levels.
Taming that inflation (and taming fears) is last month's capacity utilization and industrial production. Not only did the figures fall short of estimates, they fell from August's levels despite the continues economic improvement.
Capacity Utilization, Industrial Productivity Charts
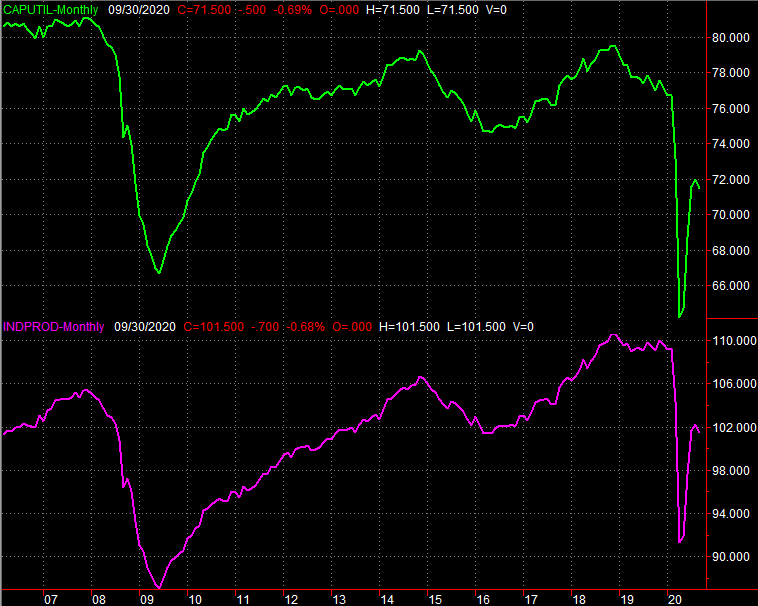
Source: Federal Reserve, TradeStation
This may only be a reflection of an unusually busy August, when factories and production facilities went into overdrive to make much of what had been missing due to shutdowns for months now. Given that the economy is supposed to be recovering well though, this slowdown is actually something of a concern in that the slowdown is happening well below pre-COVID levels.
Except, maybe it shouldn't be after all. While factories eased off last month, consumers poured it on. Retail sales with and without automobiles soared past estimates and soared past August's respectable improvement. Unemployment may still be high, but it doesn't appear to be a problem.
Retail Sales Charts
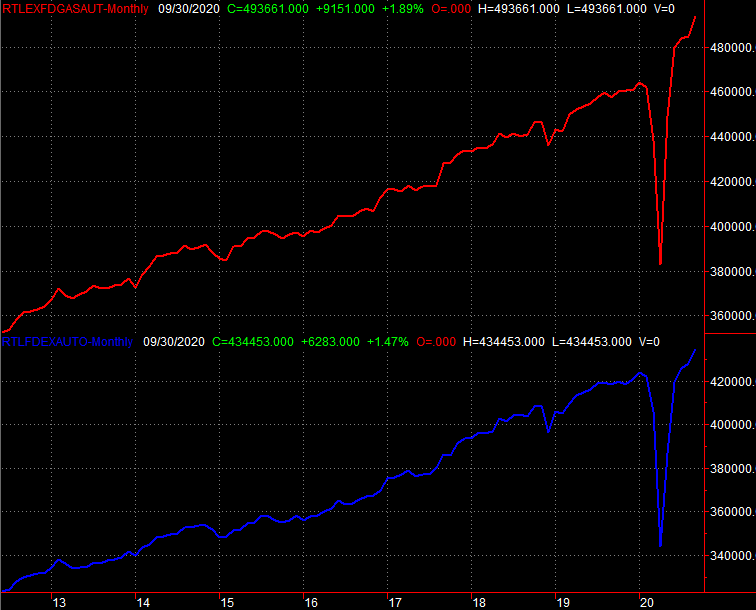
Source: Census Bureau, TradeStation
Everything else is on the grid.
Economic Calendar
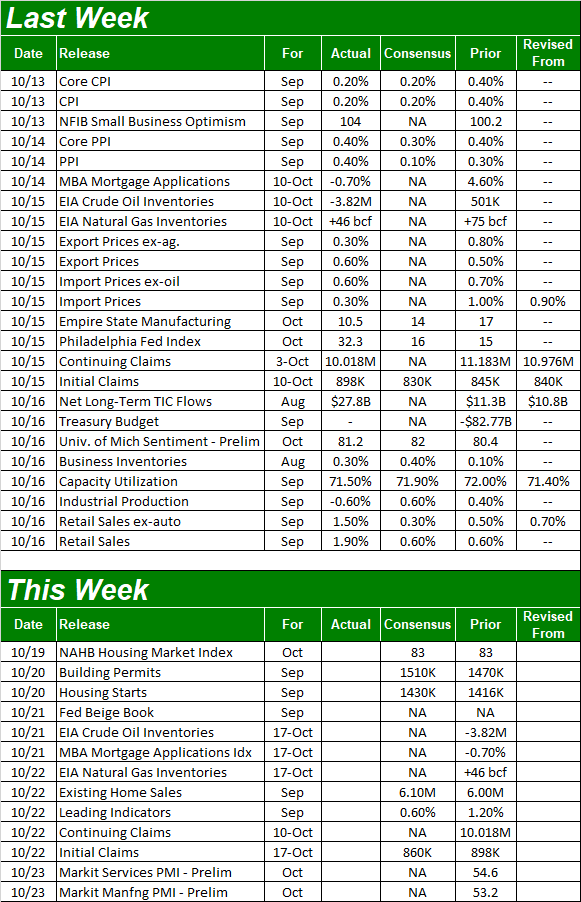
Source: Briefing.com
This week, look for housing starts and building permits on Tuesday, and on Thursday pan for sales of existing home sales.
Both have been strong... stronger than one might have expected given the circumstances. Consumers are in good enough shape (and credit-worthy enough) to take advantage of low interest rates while they're still low, and economists are expecting even more demand for real estate through last month. That's particularly true for new construction.
Building Permits and Housing Starts Charts
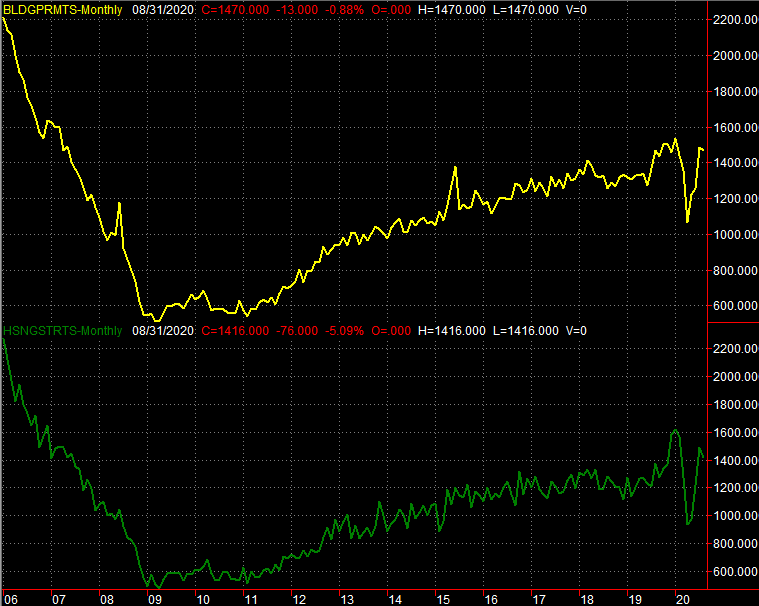
Source: Census Bureau, TradeStation
Stock Market Index Analysis
Yes, the bulls may have logged a small (0.2%) victory last week, but it could have just as easily ended up being a loss. And in some ways, last week's action was as bad as a step back. Namely, Friday's bar was telling. It was something along the lines of a gravestone doji (or upside-down hammer) where the open and close are both near the low of the day. This shape suggests the bulls started the day on an unconvinced foot, then became more bullish as the day wore in, but decided they didn't want to hold their stocks into the weekend after all. In simpler terms, the buyers changed their minds when it mattered most.
S&P 500 Daily Chart, with VIX and Volume
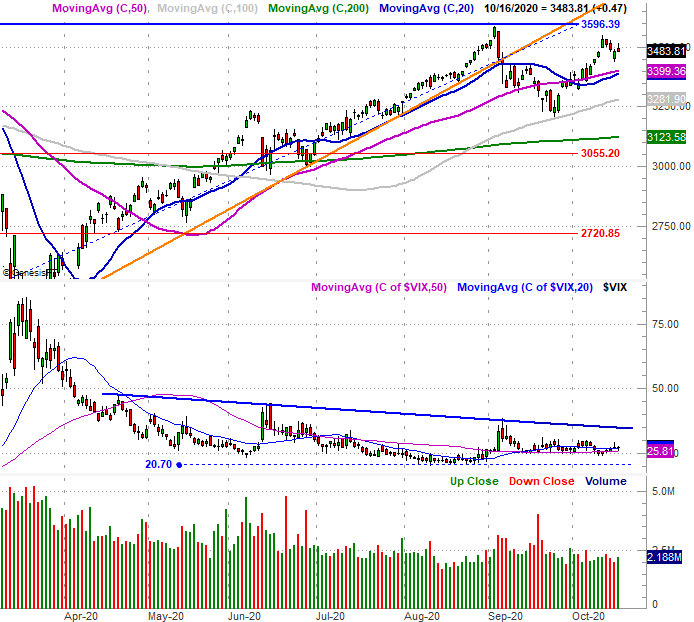
Source: TradeNavigator
You can't entirely blame them. Stocks are a little overbought from the big rebound that started to take shape in the latter part of last month and continued into the first half of October. That's a 10.6% swing from trough to peak, which is a lot for any four-week span regardless of the circumstances. You'll also notice the S&P 500's 20-day moving average line (blue) seems to be on the verge of moving above the 50-day moving average line (purple), which would be a significant bullish signal.
There are still some things wrong with this thesis though. Namely, the VIX also appears to be ready to test a thrust out of a base and above its falling resistance line (blue) that connects all the key highs since April. That's obviously not happened yet, and such a move would likely coincide with the S&P 500 breaking below its 20-day and 50-day moving average lines currently near 3400. With a big gap still left behind from September 28th's big opening gap though, there's a lot beckoning the market lower.
The same basic analysis applies to the daily chart of the NASDAQ Composite. That is, although it ended the week on a bearish foot, it's still above its 20-day and 50-day moving average lines (the former of which just crossed above the latter), and the VXN is still just moving sideways in a pretty well-defined trading range. Like the VIX though, the VXN seems to be setting up for a break to higher highs that would coincide with a breakdown for the composite itself. The challenge to that possibility of course is the fact that there's lots of support for the NASDAQ Composite too, first at the 20-day/50-day moving average line convergence at 11,250, and then the 100-day moving average line (gray) at 10,728.
NASDAQ Composite Daily Chart, with VXN

Source: TradeNavigator
The shape of last week's full-week bar bolsters the bearish argument. It was a doji, or shooting star, where the open and close are right in the middle of the high/low range. This too suggests a pivot. In this case, the pivot would be out of an uptrend and into a downtrend. Again though, there's a great deal of technical support right below the S&P 500 as well as the NASDAQ. That could still come to the rescue.
S&P 500 Weekly Chart, with VIX and Volume
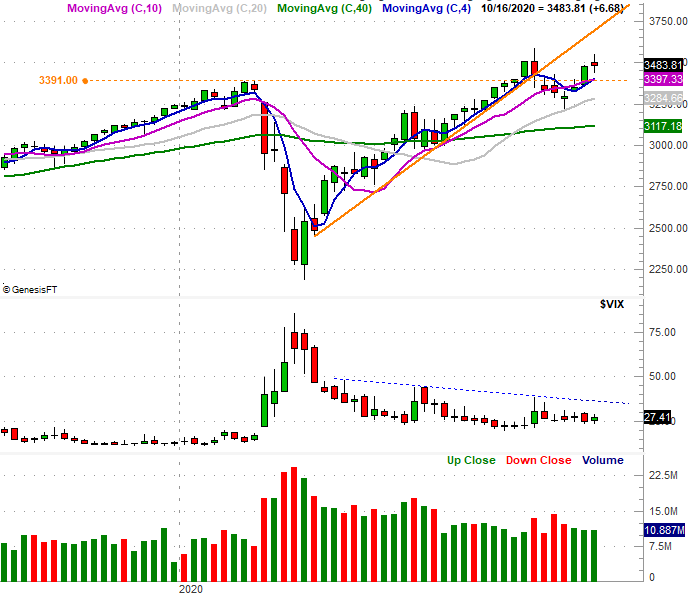
Source: TradeNavigator
That's not the end of the mixed messages.
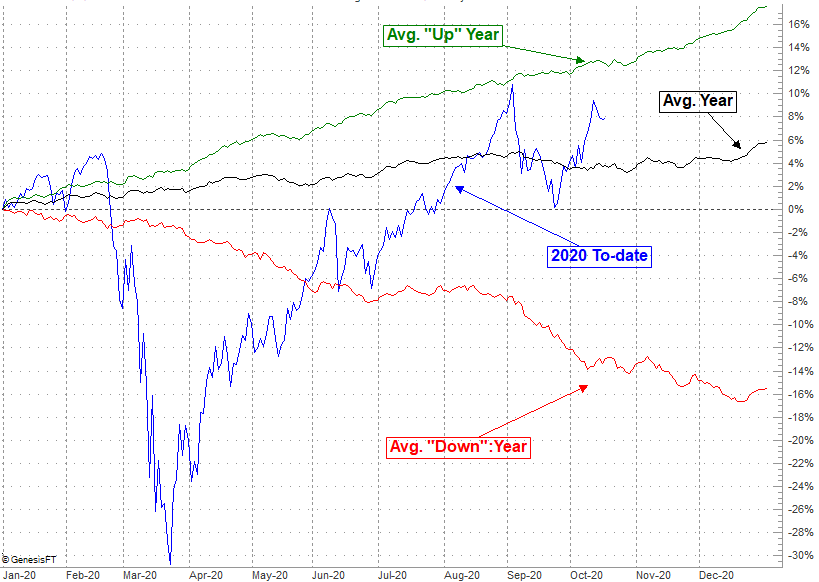
You've likely heard (including from us) that stocks, on average, begin to rally near the end of the year. This year's performance-to-date, however, is already well above the average and leaves room for a pullback. Here's the problem with averages... the extremes skew them. In this case, the market's daily-cumulative performance is skewed by clear September weakness that lingers into Q4. Not counting those years and only considering the market's typical performance during a year that logs a gain, we're actually trailing the typical performance. That is to say, in a bull market like we're in now, there's actually room for more upside despite the size of the recent rebound.
S&P 500 Daily-Cumulative Annual Performance Chart
Source: TradeNavigator
Bottom line? Anything could still happen from here. Don't be in too much of a rush to take a stand. Sometimes doing nothing can be the smartest move to make