Once again the bulls were pushed to the brink of collapse, and once again they fought their way back to safety. Last week didn't just end on a high note. It ended as record-high closes for the NASDAQ as well as the S&P 500. We're one step closer to a major technical hurdle - at least the S&P 500 and the Dow Jones Industrial Average are - but the momentum is bullish as we head into the new trading week.
We'll take a detailed look at everything below, as always. First though, let's paint a picture with the broad brush strokes of last week's economic announcements, and preview what's coming this week. Spoiler alert: This week is going to be a bit overwhelming in terms of information to process.
Economic Data Analysis
The only hard data worth mentioning about last week is the ISM Services Index update, rounding out the previous week's ISM Manufacturing Index report. In simplest terms, it was disappointing. The reading of 60.1% remains well above the make-or-break 50 level, but that number was markedly lower than June's print, as well as below expectations for a more modest contraction to 63.0%.
ISM Index Charts
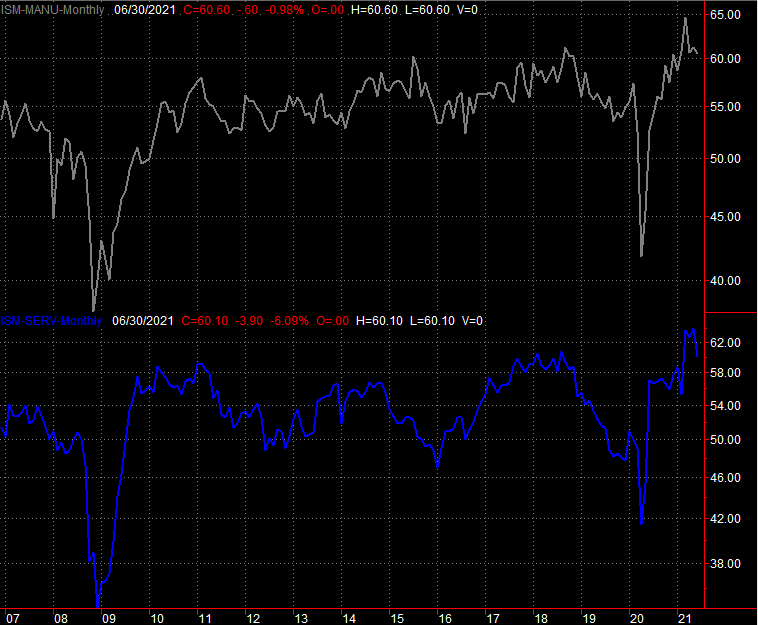
Source: Institute of Supply Management, TradeStation
Note that the ISM Manufacturing Index also fell in June, and for that matter, at least seems to have peaked in a bigger-picture sense. It's not devastating. Again, the manufacturing index also remains well above 50, coming in at 60.6% for last month. Given the backdrop of all the economic damage done by the pandemic though, one would hope for more.
While the ISM Services report was the only hard data of interest, it's not the only thing worth mentioning. The Federal Reserve also released the minutes of its most recent meeting last week. In short, the FOMC is ready to act to combat inflation, which is a reserved way of saying it's seeing the potential for significant problems on the horizon.
Everything else is on the grid.
Economic Calendar
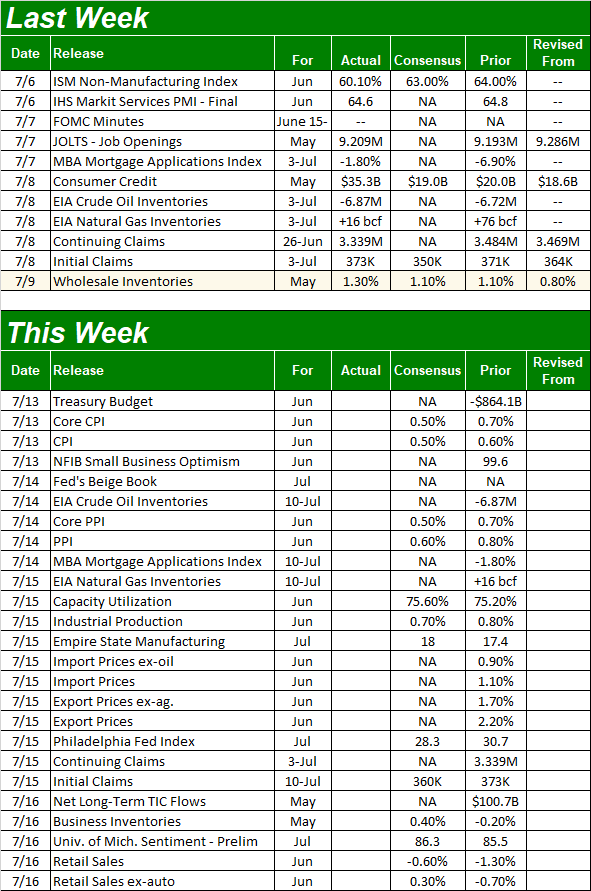
Source: Briefing.com
This week.... Just buckle up.
The fireworks start in earnest on Tuesday, when we'll get the official consumer inflation figure for June. Things should have cooled slightly from May's brisk pace of price growth, but with expectations for 0.5% price increases - on the order of 4.0%. That would be down from the prior month's pace of 5.0%, though still concerning enough to put the Fed into action. Producer inflation data will be posted the next day, and it's likely to come in just as firm.
Consumer, Producer Inflation Charts

Source: Bureau of Labor Statistics, TradeStation
On Thursday look for last month's capacity utilization and industrial productivity reports from the Fed. These aren't given a great deal of attention, but should be, as both coincide very well with corporate earnings as well as the long-term market itself. Economists are looking for modest progress on both fronts, extending uptrends that have been underway (even if choppy) for some time now. That's bullish.
Industrial Productivity and Capacity Utilization Charts
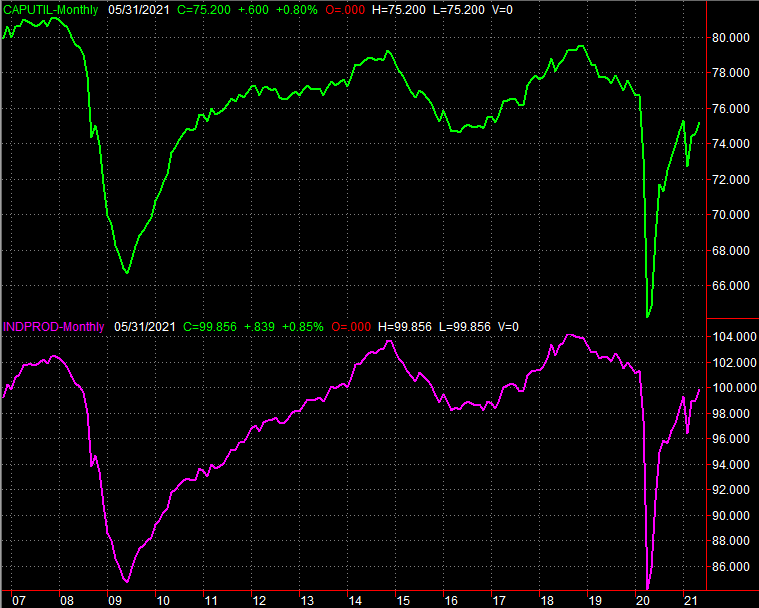
Source: Federal Reserve, TradeStation
Finally, on Friday we'll get last month's retail sales reports. Forecasters are calling for another lackluster month, though at least in June spending on everything except for automobiles should have grown slightly. Just bear in mind the outlooks are largely based on recent spending, which soared in March and April, making for tough comparisons now. The data also doesn't factor in year-ago data very well, but we're clearly spending more now than we were then. Trouble is, a "good" or "bad" figure is generally determined by comparing the actual growth to expected growth. Just be smart that day... and ready for anything.
Retail Sales Charts
Source: Census Bureau, TradeStation
Stock Market Index Analysis
As of mid-day Thursday some traders were wondering if we were finally going to pay the proverbial piper for all the gains we've enjoyed since March of last year. By Friday's close it was clear there was no reason to worry... at least not yet. The S&P 500 as well as the NASDAQ both logged record-high closes on Friday, and both have at least a little more room to continue rallying; the NASDAQ's got more than the S&P 500. Take a look. The composite's nearest ceiling is currently at 15,956 (highlighted), and rising.
NASDAQ Composite Daily Chart, with Up and Down Volume
Source: TradeNavigator
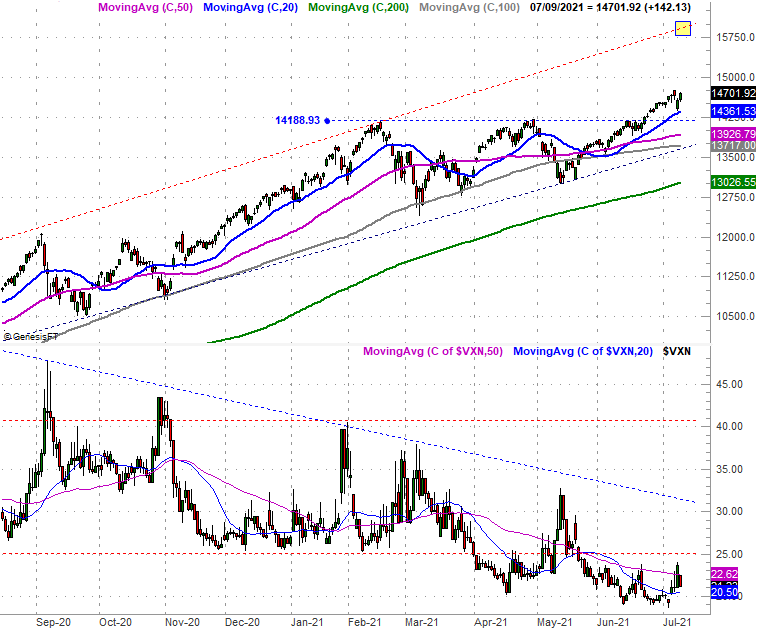
Here's the weekly chart of the NASDAQ Composite, for some added perspective. In this timeframe we can see the current bullish guidelines - particularly the upper boundary (red, dashed) - were actually established even before the pandemic-prompted pullback from early last year. The NASDAQ would ultimately need to rally 22% from May's low (when it last touched the lower edge of a long-term trading range) before finally bumping into the upper edge of the range again. But, as the weekly chart shows us, moves of this magnitude aren't really unusual.
NASDAQ Composite Weekly Chart, with VXN
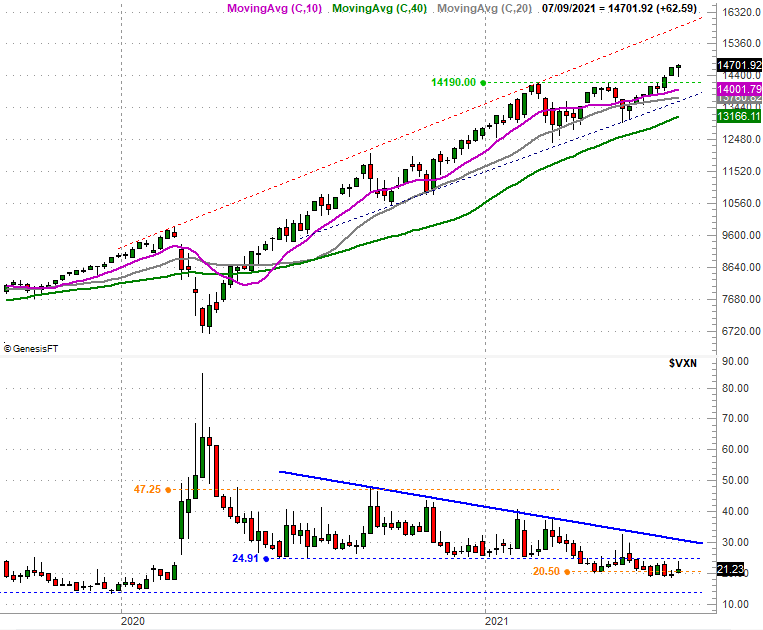
Source: TradeNavigator
You can also see the NASDAQ's Volatility Index, or VXN, has defined the 24.9 level as a newer area of resistance, testing the ceiling last week and once again failing to move above it. It's also clear that there's still room for the VXN to continue edging a little lower before reaching a more absolute floor near 13.8, where the index found support for several weeks in late-2019 and early-2020.
The S&P 500, however, isn't in quite the same sort of bullish scenario. It's above all of its potential resistance levels, but its long-term technical ceiling is within a few days' reach, at 4430 (highlighted).
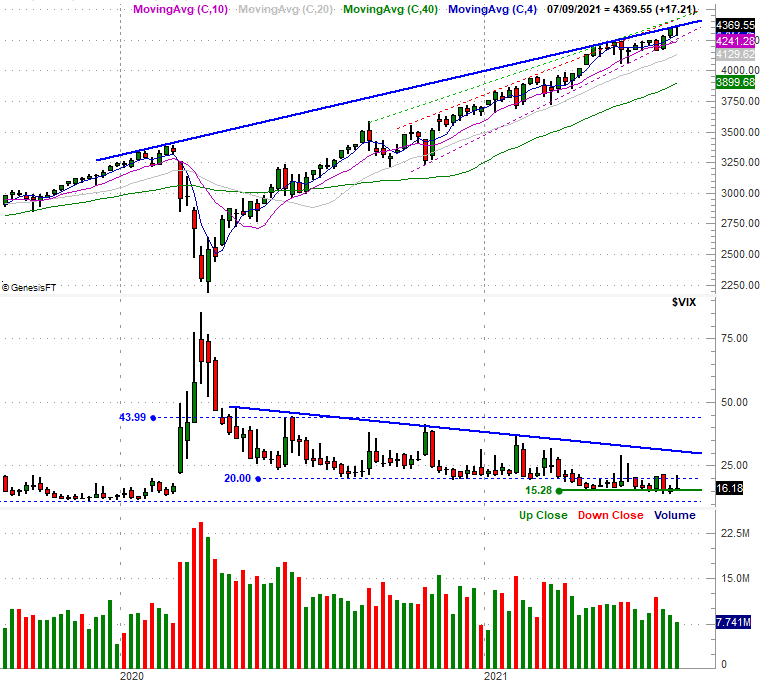
S&P 500 Daily Chart, with VIX and Volume
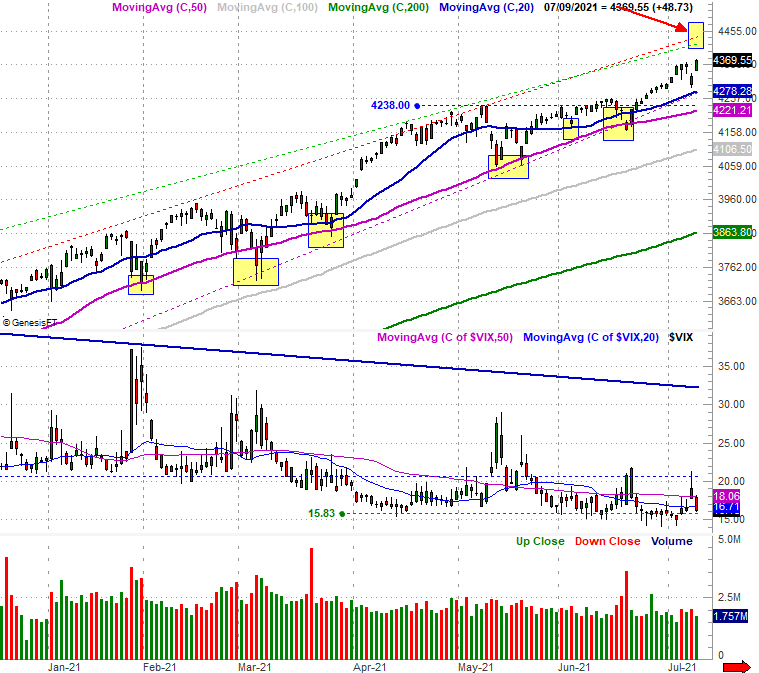
Source: TradeNavigator
Here's the weekly chart of the S&P 500, with one added element. Namely, we've added one more technical ceiling (thick, solid blue line) connecting the key peaks going back to the high right before the COVID crash suffered in March of last year. It only consists of three nodes, but one of those nodes is last week's -- and to a lesser degree, the previous week's -- highs. Traders may not know it, but this index is already bumping into a major technical ceiling.
S&P 500 Weekly Chart, with Volume
Source: TradeNavigator
Similar to the NASDAQ's VXN, the S&P 500's Volatility Index (VIX) just confirmed resistance at 20.0, and has room and reason to keep moving lower before a better-established floor at 11.0 comes into play. That's potentially bullish, but given the S&P 500's backdrop, that may not necessarily mean much right now.
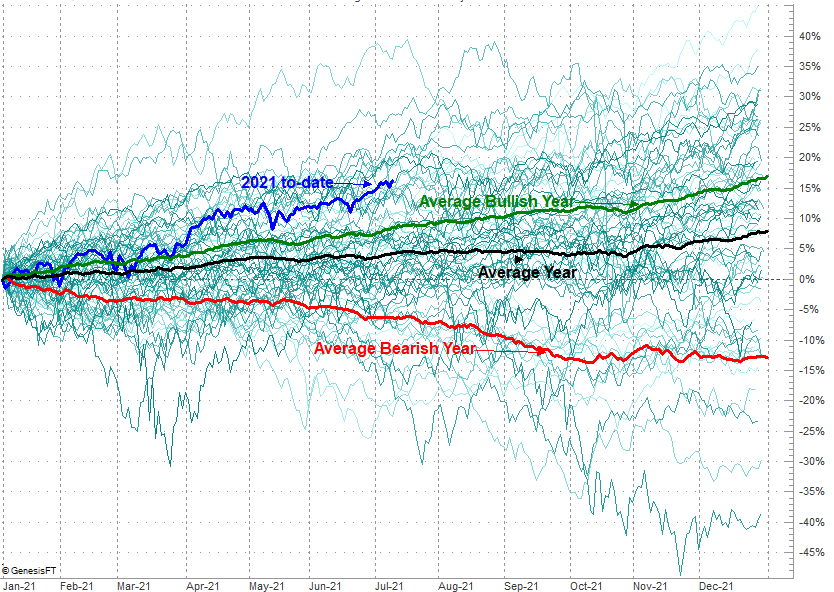
It's a mixed message to be sure. The NASDAQ has room to fly, while the S&P 500 doesn't. Given how the S&P 500 is up an incredible 16.3% so far thus year when it would normally only be up an average of 4.6% at this point (and even just up 8.7% in the average bullish year), it would be easy to assume we're due for the pullback the S&P 500 seems to say could be brewing.
Don't be too quick to jump to that conclusion though.
The chart below should look a little familiar, as we've shown it before. There's an extra dimension this time, however, that we typically don't add. All the thinner, paler blue (and unmarked!) lines behind the major to-date performances we usually plot represent each and every year's day-by-day cumulative performance for the S&P 500 going back to 1950. Obviously most of them more or less follow the overall average (black) or average bullish (green) track, but clearly there have been plenty of years that have been as bullish as this year has been; a handful have even been considerably more bullish.
S&P 500 YTD Performance Chart vs. Other YTD Performance Comparison Benchmarks
Source: TradeNavigator
The point is, never say never just because something doesn't look or feel all that likely... or even plausible. The broad market may well implode from here, but certainly not because this sort of bullishness has never been seen before.
In the meantime, just keep a close eye on all the ceilings discussed above, and all the moving average lines we didn't discuss here. They're the floors that will have to be broken if the bears are to have any hope of tipping this rally over.