Weekly Market Outlook - More to Celebrate Than it Seems, Yet Also Less
 It could have been worse. Although the market peeled back on Wednesday and Thursday of last week, on Friday the bulls held the line and push stocks back into the black... for the day, and for the week. To see traders pouring back into a top right in front of a weekend points to at least a little bit of confidence about the foreseeable future.
Besides, the major indices only stalled right where we'd expect to - and want to - see a brief break. The overall uptrend is still technically alive.
We'll hash it all out below, but first, a review of last week's economic news and a preview of this week's announcements.
Economic Data Analysis
Pretty light week last week. The ball got rolling with Monday's auto sales reports, which were alarmingly low. Passenger car sales were more or less flat, and in-line with expectations. But, now, even truck sales are slipping. Last month's annualized truck sales pace of 8.75 million units.
Note the graphic below is only partially updated. The top portion is current, indicating the total number of vehicles sold last month. The lower two portions, which indicate passenger car and light truck sales, haven't been updated since November's data due to the government shutdown. The reports should catch-up with the next regularly scheduled update.
Auto Sales Charts
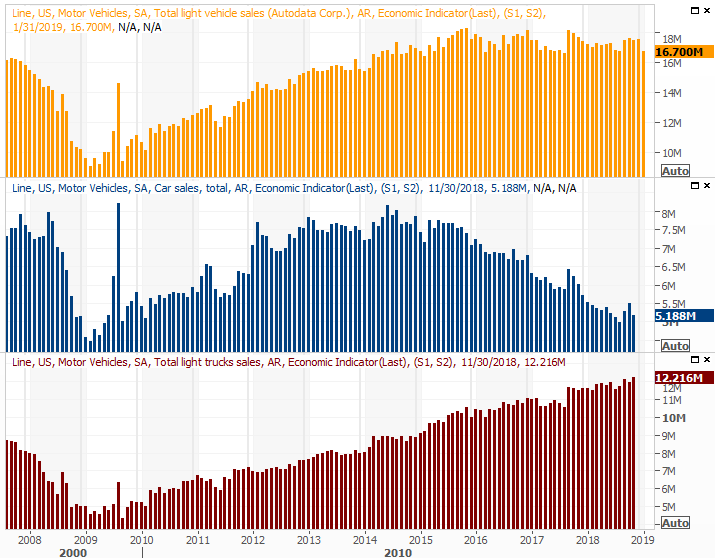
Source: Thomson Reuters
We also rounded out the ISM data with a look at January's ISM Services Index. It fell slightly, while its manufacturing counterpart actually ticked a little higher from December's plunge. Either way, both remain above the crucial 50 level.
ISM Index Charts
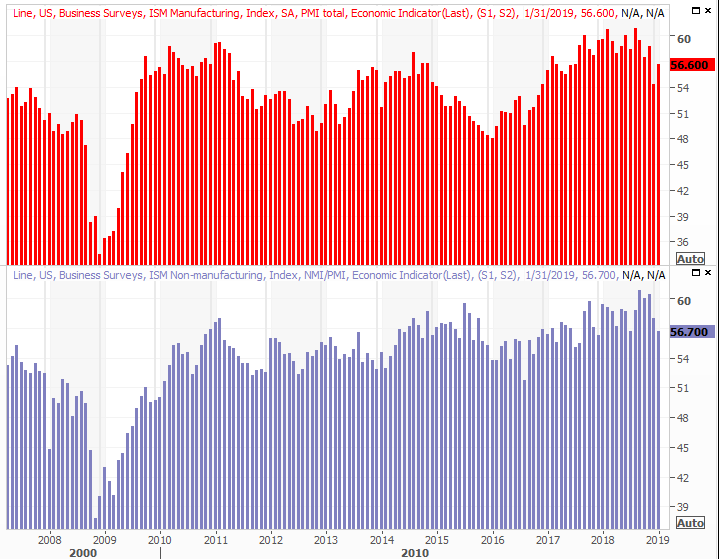
Source: Thomson Reuters
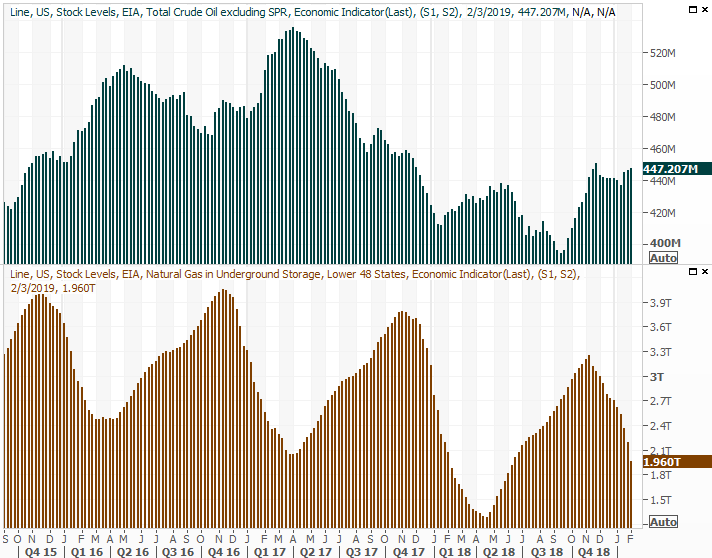
Finally, a look at natural gas and crude inventory stockpile levels. As expected, gas reserves were depleted again, particularly in response to an unusual wave of bitterly cold weather. It was going to slump anyway though, as winter winds down. Crude inventories, in the meantime, edged slightly higher for a third week. Given the global production cuts and stymied U.S. production at a time we've become a net exporter, even the modest build for a third week - and the ongoing build from Q3 - this is reason for concern regarding oil prices.
Crude Oil, Natural Gas Inventory Charts
Source: Thomson Reuters
Everything else is on the grid.
Economic Calendar
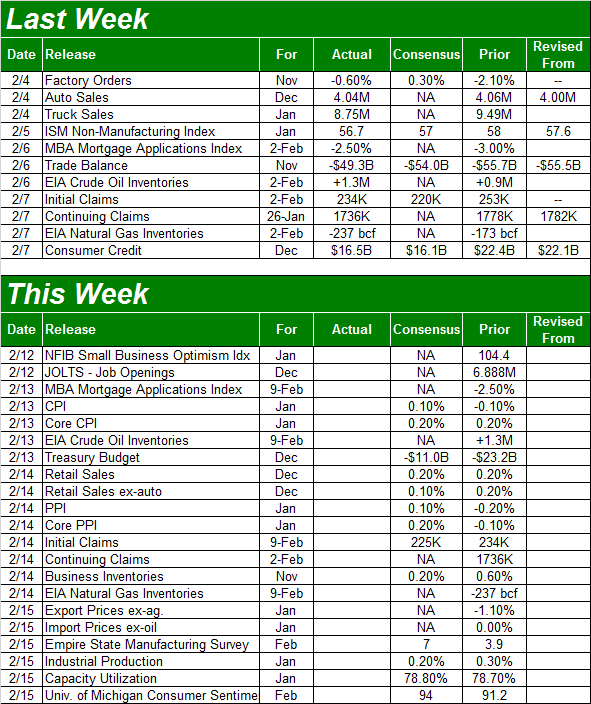
Source: Briefing.com
This week's dance card is very full, starting in earnest with Wednesday's consumer inflation report. Economists are calling for a slight increase, followed by another modest increase for businesses and companies on Thursday. The current annualized consumer inflation rate is stabilizing around 2.0%. The Fed was right - it doesn't need to be in a hurry to raise interest rates this year... at least not yet.
Consumer, Producer Inflation Charts
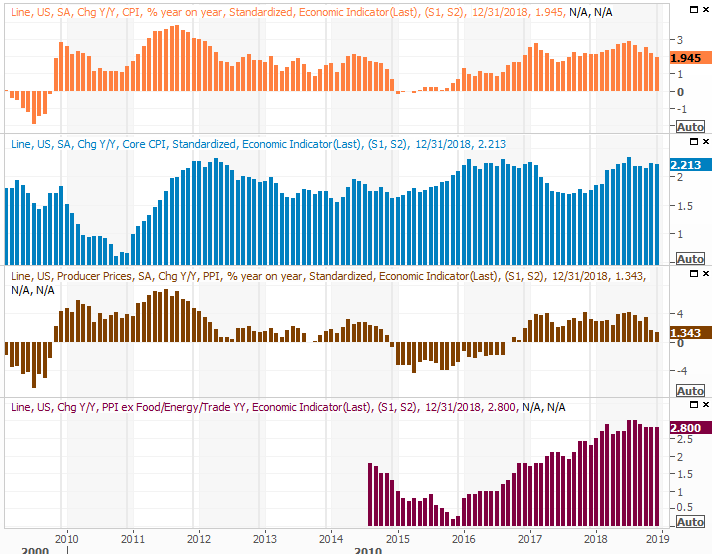
Source: Thomson Reuters
Also on Thursday we'll hear December's retail sales tallies. It's dated information at this point, though it will still be interesting to see if retailers has a solid holiday-shopping surge as the year came to close. The pros are calling for modest improvements.
Retail Sales Charts
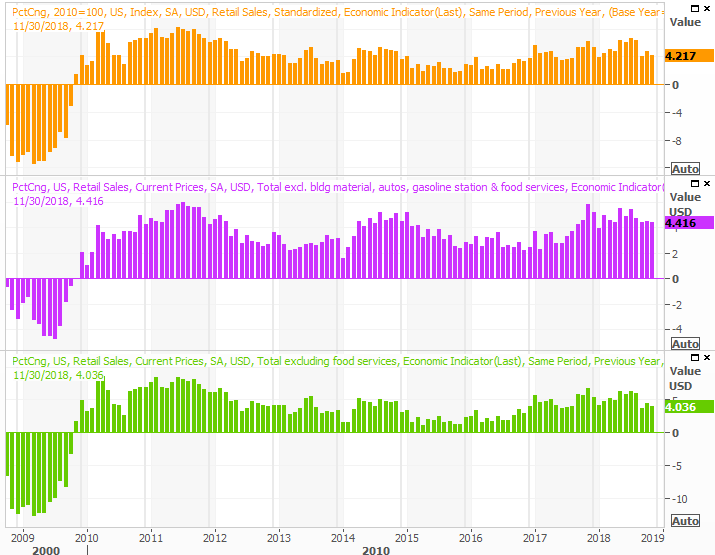
Source: Thomson Reuters
The pace of retail consumption growth is slowing, but that's not in and of itself terribly concerning. The comparisons from year-ago figures have been unusually high. But, from this point forward it's important that year-over-year sales growth at least holds steady in the 4 range.
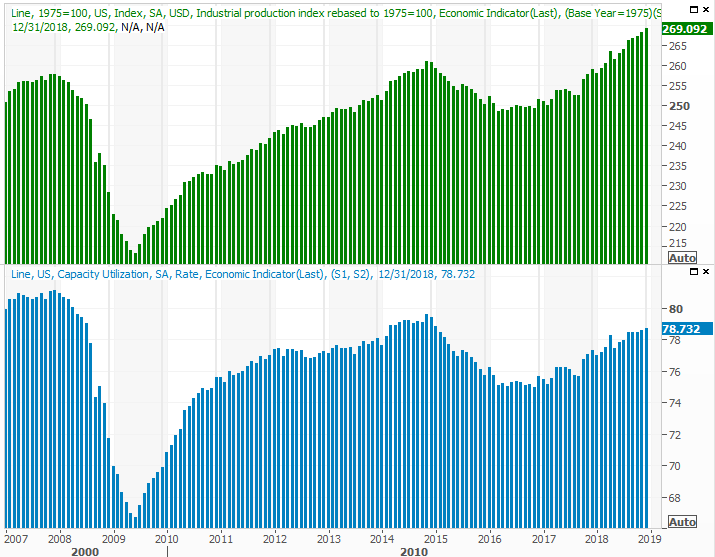
Finally, and perhaps most important, on Thursday we'll hear the Federal Reserve's update on January's industrial productivity and capacity utilization. This data coincides well with overall corporate earnings, and with the market's long-term trend. Economists are calling for another month of forward progress, extending a growth trend that's been in place since early 2017.
Industrial Productivity, Capacity Utilization Charts
Source: Thomson Reuters
Stock Market Index Analysis
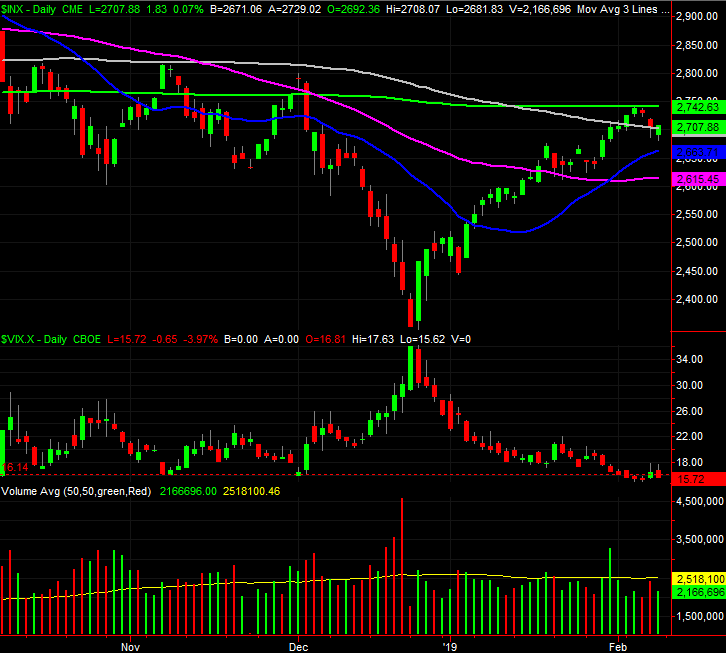
We knew the rally was on borrowed time, advancing more than 18% from December's low as of Monday... without any real break. All it took was a bump into the 200-day moving average line on Tuesday to get traders to take a little profit.
Still, all things considered, the dip was more than palatable.
S&P 500 Daily Chart, with Volume
Source: TradeStation
Indeed, despite the small stumble, the week actually ended on a high note.
See how the S&P 500 moved back above its 100-day moving average line on Friday? That's telling. The bears had every opportunity to really pull the rug out from underneath the market, particularly headed into the weekend when some traders are looking to 'lighten up' anyway. When they had to make a decision though, they actually chose to be more in than out.
In retrospect, it's possible the brief blip was only caused by the encounter with the 200-day moving average line; traders may be acting on the belief that it will be its usual make-or-break level. Pushing past it was and is always a process anyway. It's rarely a singular event.
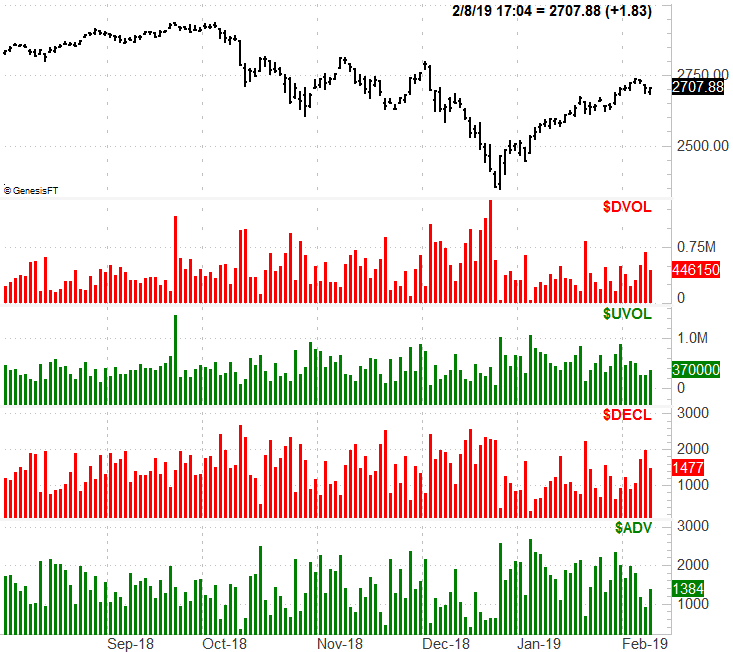
There are some red flags, however, that imply things actually are NOT as healthy as they might seem in light of Friday's recovery. That is, there were more stocks losing ground than gaining ground, and the volume of falling stocks outweighed the volume behind rising names. It wasn't as bearish as the breadth and depth from Thursday, but still lopsided toward the bearish side of the fence.
S&P 500 Daily Chart with Breadth and Depth
Source: TradeStation
That can happen, by the way, when enough of the right stocks find a tailwind. A couple of names mustered huge, high-volume gains on Friday, making stocks look a bit healthier than they truly are.
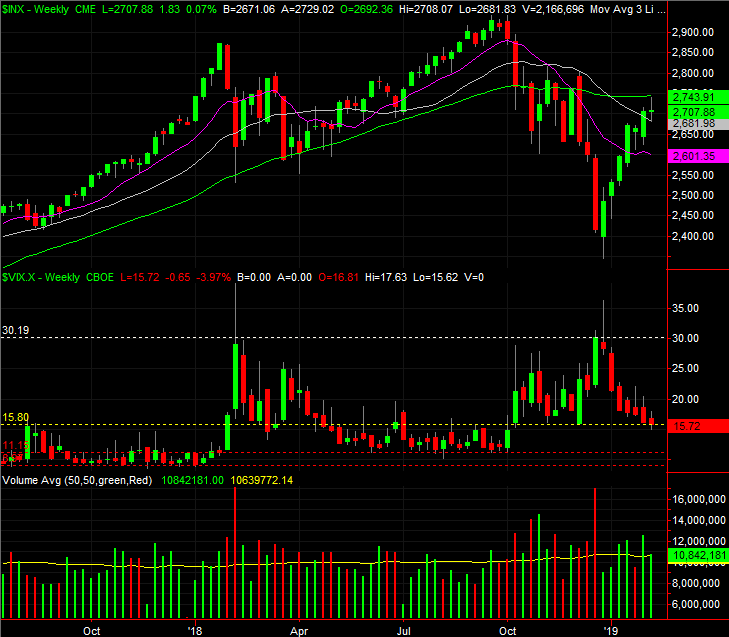
Zooming out to the weekly chart of the S&P 500 doesn't tell us a whole lot more, but it does offer perspective. As wild as the rebound has been, it's only unwound a little more than half of the September/December meltdown. There's still room to continue rising (though the index would clearly have to hurdle the 200-day moving average line first).
S&P 500 Weekly Chart, with Volume
Source: TradeStation
Something the weekly chart really underscores though... the VIX is working to break below a modest floor around 15.8 (yellow, dashed), and there's room for it to keep falling before finding a more absolute floor around 10.0.
Yet another detail only the weekly chart reveals: Last week's bar for the S&P 500 is technically a doji bar, where the open and close for the week are both right at the middle of the high-low range. Those often indicate a pivot, which in this case would be a pivot out of an uptrend and back into a downtrend. That's not a possibility to blindly bet on though.
The 'right' move here is to let the market bounce around between the 200-day moving average line and the 50-day moving average lines, regroup, and then make a decision about its next direction. Those levels are 2742 and 2615, respectively, and the NASDAQ's same moving average lines are playing the same roles of support and resistance until further notice. Breaking out of that range could take a while, but it's worth the wait.