The good news is, the market ended the week on a high note, ending Thursday's meltdown with a small gain on Friday that at one point early in the session was going to be another down day. The bad news is, even with that semi-bullish intraday reversal most of the major indices didn't log a meaningful gain for the week. In fact, a glance at the weekly chart waves more red flags than green ones, defying the bullishness being hinted at by the daily chart.
We'll compare and contrast the two timeframes' messages in a moment. First though, let's recap last week's biggest economic announcements, and preview what's coming this week... not that there's a lot on the dance card.
Economic Data Analysis
Yes, we got last month's jobs report on Friday. First things first though. In order of appearance...
The party started in earnest on Tuesday, with a look at home prices. They were up - again - according to Case-Shiller as well as FHFA. Just bear in mind that last month's reports were both for January, before we started to see interest rates tick higher and pending home sales slow down.
Home Price Charts
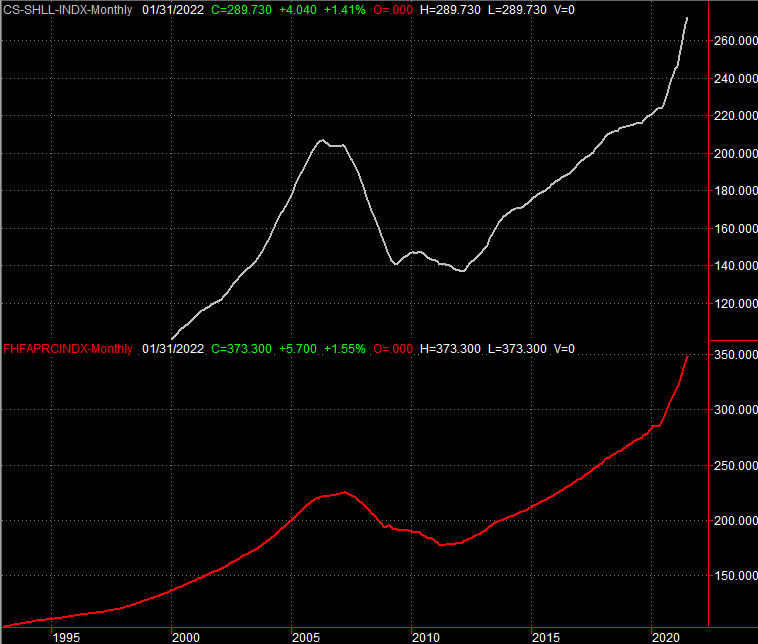
Source: Standard & Poor's, Case-Shiller, FHFA, TradeStation
Also bear in mind that both of these home price indexes measure sales prices only, but don't consider the number of sales. It's entirely possible things have changed dramatically in the meantime in a way that's not even being reflected in this already-delayed data.
We also got the Conference Board's consumer confidence number for March on Tuesday. As could have been expected, it fell, though not as much as was feared. At 107.2, it's still relatively high.
Consumer Sentiment Charts

Source: Conference Board, University of Michigan, TradeStation
Note that the Conference Board's consumer confidence score is much healthier than the University of Michigan's look at sentiment.
The third estimate of Q4's GDP was dialed back from the second estimate... from 7.0% to 6.9%. The contraction isn't a big deal, however, as everything's a guess at this point, and 6.9% growth is still plenty significant.
The big Kahuna, of course, is March's jobs report posted on Friday. It was solid, with the addition of 431,000 new jobs. That fell from February's tally of 750,000, and missed expectations of 475,000 new (net) payrolls. It was still enough to drive the unemployment rate from 3.8% to a multi-year low of 3.6% though, which is good enough given the current backdrop.
Payroll Growth and Unemployment Rate Charts
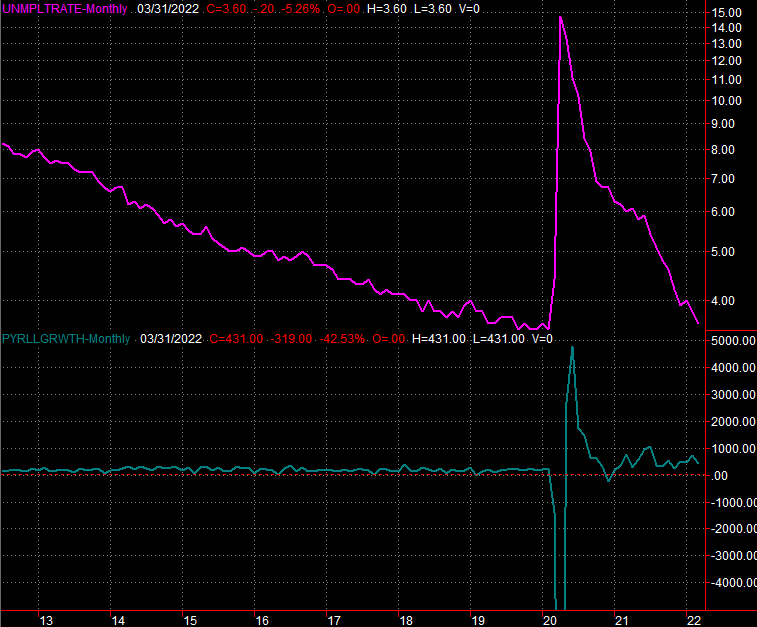
Source: Institute of Supply Management, TradeStation
Everything else is on the grid.
Economic Calendar
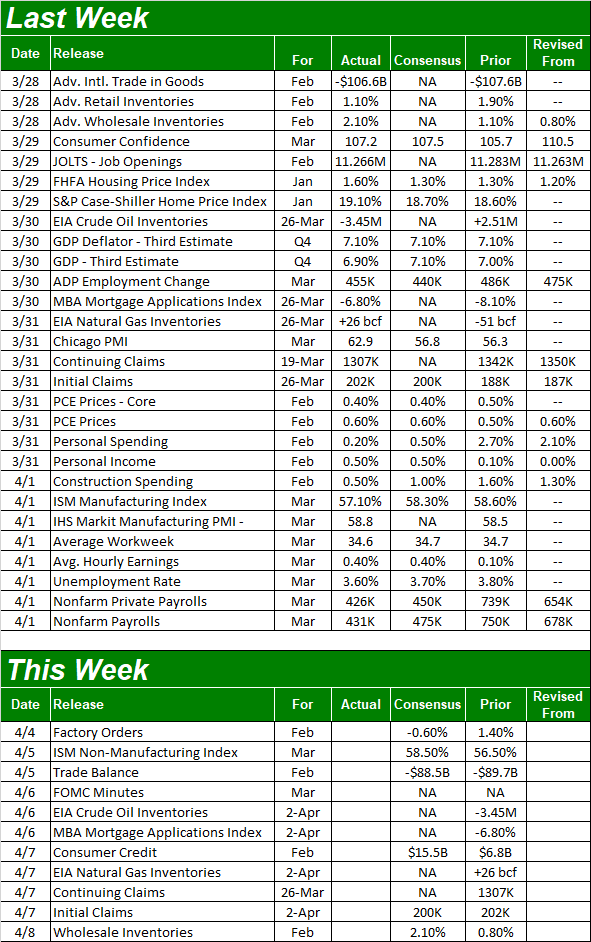
Source: Briefing.com
This week is light, although there are a couple of items to look out for. The first of them is Tuesday's ISM Services Index, rounding out the ISM Manufacturing Index update we got last week. The manufacturing measure peeled back a bit, but remains well above the critical 50 mark. Economists, however, believe the non-manufacturing measure from the Institute of Supply Management will actually tick higher for March,
ISM Services and Manufacturing Index Charts
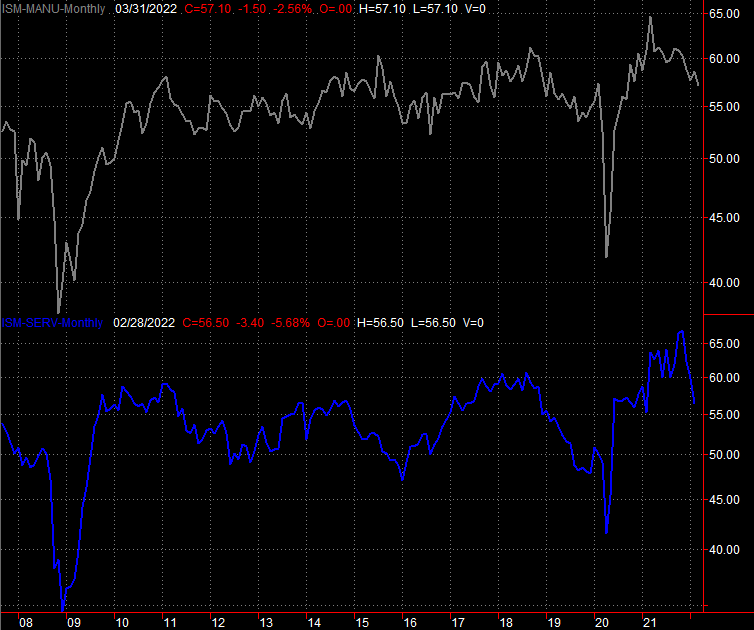
Source: Institute of Supply Management, TradeStation
The only other thing to put on your calendar for this week is Wednesday's release of the minutes from the most recent meeting of the Federal Reserve's Open Market Committee. It's unlikely it will reveal anything we don't already know, however. That is, the Fed knows it must move cautiously but meaningfully to curb what's turned into uncomfortable levels of inflation.
Stock Market Index Analysis
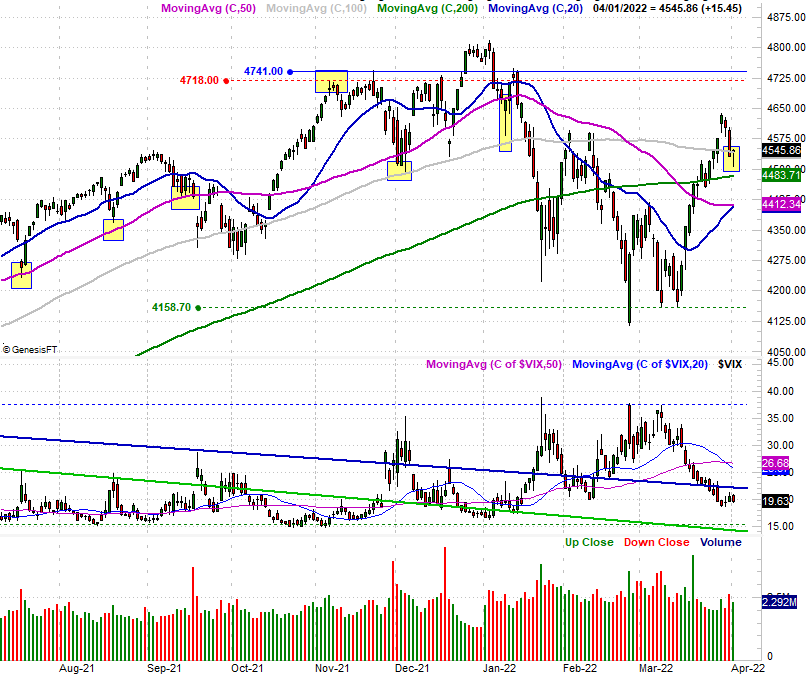
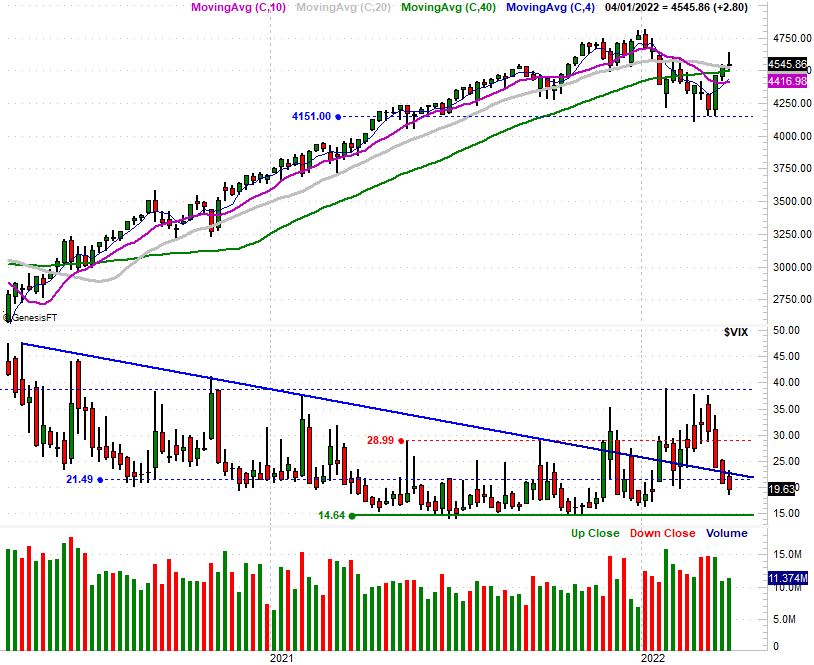
Let's start this week with the good news most evident on the daily chart of the S&P 500. That is, although it briefly fell back under its 100-day moving average line (gray) at 4542 on Friday, by the time the closing bell rang it was back above that key line; the 200-day moving average line (green) was hurdled a couple of weeks ago. This intraday reversal on Friday following Wednesday's and Thursday's drubbing suggests there are still bulls and buyers out there.
S&P 500 Daily Chart, with VIX and Volume
Source: TradeNavigator
It's not all good news though. As the same daily chart shows us, there's still not a lot of buying volume behind any rebound efforts, but there was more than a little volume behind Thursday's month-end pullback.
Matters turn even a little more alarming when we zoom out to the weekly chart of the S&P 500. In this timeframe we can see that, even though the index closed above all of its important moving average lines, the shape of last week's bar is a gravestone doji. That just means the open and close are near one another, and near the bottom of a tall high-to-low range. These shapes typically mark a transition from a net-buying to a net-selling environment; the weekly timeframe also cleans up any "noise" that might make the daily chart a little misleading.
S&P 500 Weekly Chart, with VIX and Volume
Source: TradeNavigator
The weekly chart, on the flipside, also shows us there's a little more room for the VIX to keep falling before it bumps into an absolute floor around 15.0.
The chart of the NASDAQ Composite looks similar, but not identical... in a bad way. Namely, whereas the S&P 500 managed to get back above its 100-day moving average line and now sits well above its 200-day average, the NASDAQ didn't, and isn't. Indeed, it almost looks as if the composite found resistance at its 100-day moving average line (gray) at 14,600 when it was tested on Tuesday and Wednesday.
NASDAQ Composite Daily Chart, with VXN
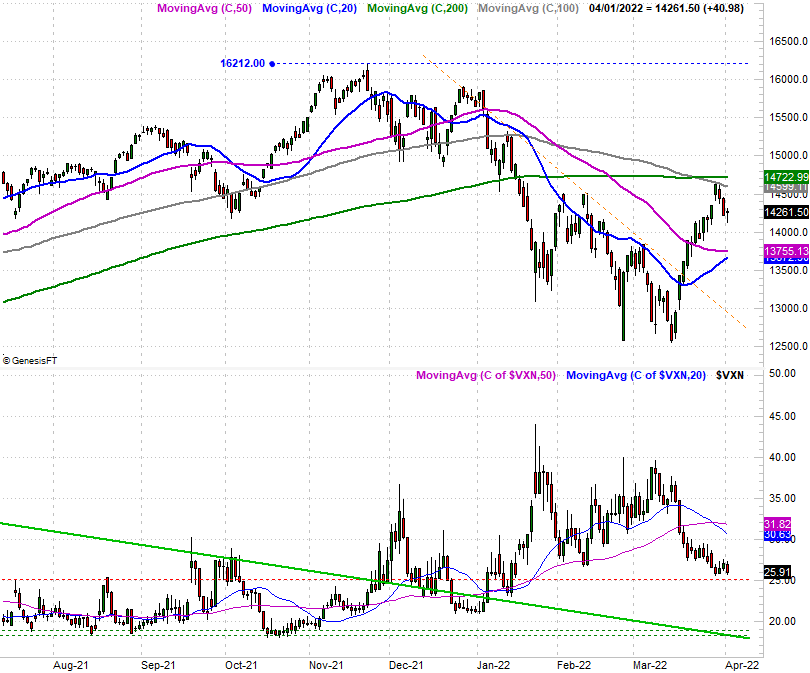
Source: TradeNavigator
Zooming out to a weekly chart of the NASDAQ Composite doesn't tell us much more about the interplay with these moving average lines, but it does show us the same gravestone doji pattern the S&P 500 gave us last week. On the other hand, it also shows us that -- like the VIX -- the VXN has room to keep moving lower. That's ultimately bullish for the market.
NASDAQ Composite Weekly Chart, with VXN
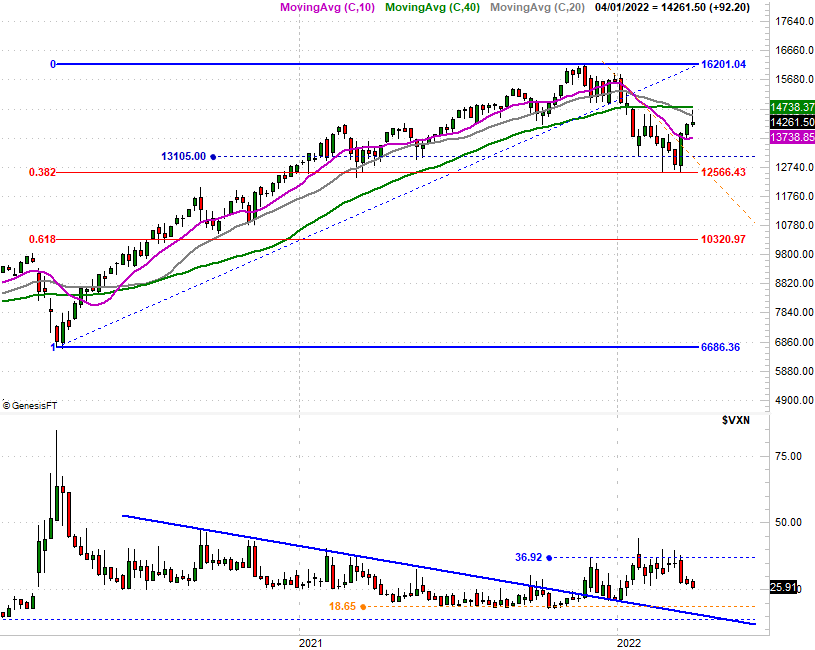
Source: TradeNavigator
How do we rectify the seemingly opposing messages? We don't.
While it's tempting as a trader to always ask yourself which direction the market is heading right now, sometimes, the market isn't moving decisively enough in any direction to make a major, committed bet on a trend. This is one of those times. While the market has been kind enough to draw some clear lines in the sand, it's yet to cross them. Good traders will wait for the right, high-odds opportunities to take a position. Here in no-man's land, we can't actually weigh the odds.
Translation: You may be best served right now by waiting on the sidelines, doing nothing.