Weekly Market Outlook - Last Week's Setback Was Just a Well-Deserved Breather

We all innately knew the market was playing with fire, so to speak, by virtue of an incredible rally that's been underway since March of last year. The S&P 500 fell 1.0% last week, snapping a three-week winning streak.
Don't sweat or fret just yet though. Even with last week's stumble all the major indices remain well above critical technical support. The rally is still intact. It's just being tested again. Given how overextended the broad market is though, it would be wise to look carefully at this particular test.
We'll do that below, but first, let's review last week's economic announcements and preview what's coming this week. Note that last week was a good news/bad news situation to the extreme.
Economic Data Analysis
Inflation is soaring. We caught a glimpse of this reality in June with May's inflation data. But, it accelerated in June. The annualized inflation rate now stands at 5.4%, and 4.5% not counting food and energy prices. Those are the highest levels we've seen in years. Producers' (factories and assembly plants) costs are soaring even more, now 7.3% higher than they were a year ago. On a core basis, the annualized PPR rate stands at 5.5%. Again, those are multi-year highs.
Consumer, Producer Inflation Charts
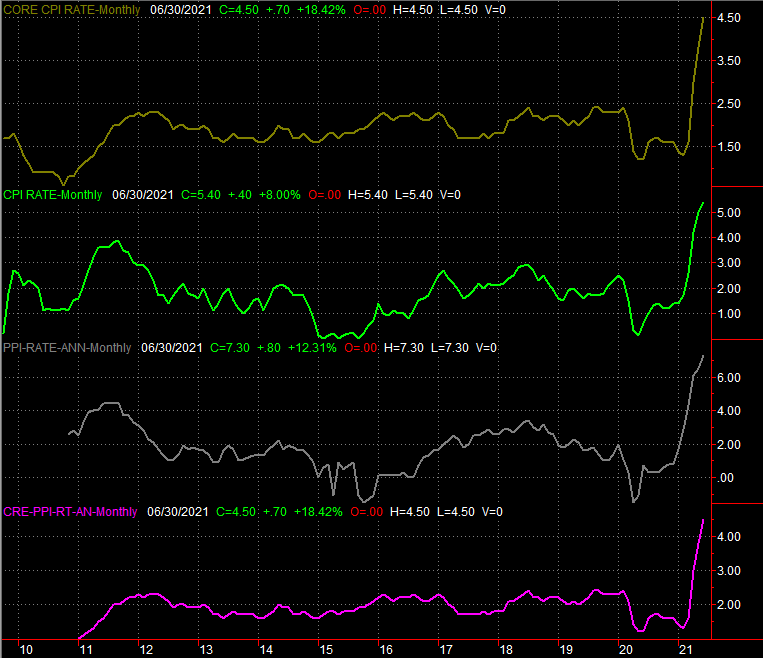
Source: Bureau of Labor Statistics, TradeStation
The Federal Reserve is admittedly cautious about the scope of price increases, and bear in mind, the annual rates are largely in comparison to prices in the early days of the pandemic. Nevertheless, this is frothy, and seemingly uncontrolled. This inflationary pressure could evolve into a problem for the market in a hurry. It depends quite a bit on traders' moods, and psyches.
Higher prices, however, didn't prevent consumers from spending. Rather than contract as expected, retail sales grew in June, and grew even more not counting automobile sales. In fact, retail spending on physical goods (excluding restaurants) reached a record high.
Retail Sales Charts
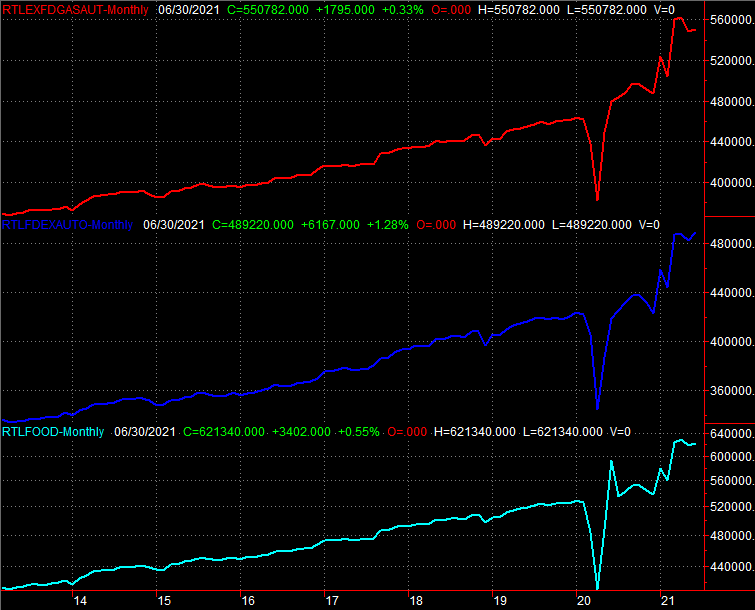
Source: Census Bureau, TradeStation
And, despite their higher costs, the country's factories aren't slowing down either. Utilization of our prediction capacity inched forward to a pandemic-high of 75.4%, and likewise, industrial production itself hit its highest levels sense COVID swept across the world.
Industrial Productivity and Capacity Utilization Charts
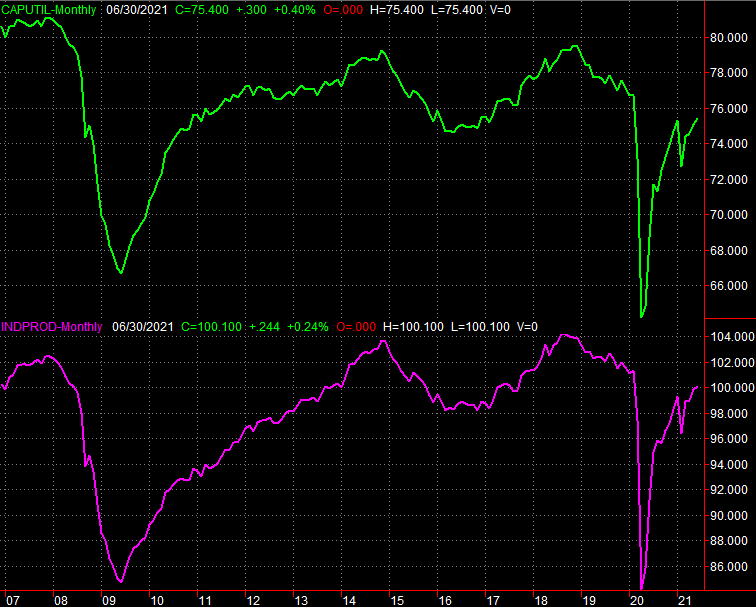
Source: Federal Reserve, TradeStation
Everything else is on the grid.
Economic Calendar
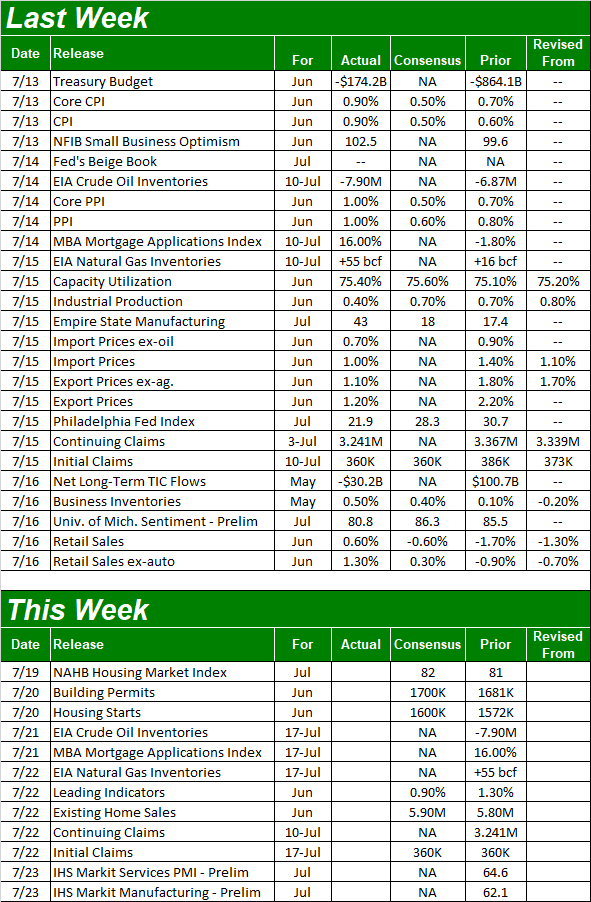
Source: Briefing.com
This week is lighter, but kicks off a wave of real estate data.
Building permits and housing starts numbers will be released on Tuesday. Economists are ca;ling for a slight improvement of May's numbers, which would be a welcome turn after something of a slowdown in recent months... at least from permits. Of course, even modest progress here might be better than the overheated pace of permits we were seeing earlier this year. More modest growth is more sustainable.
Housing Starts and Building Permits Charts
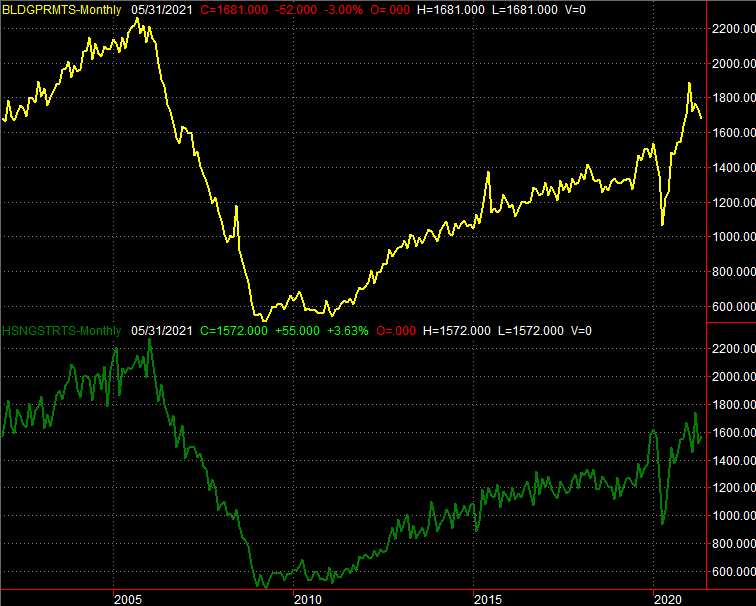
Source: Census Bureau, TradeStation
We'll also hear June's existing home sales figures on Thursday. Analysts believe the pace quickened just a bit, to an annualized figure of 5.9 million. That would be a welcome sign too, as these numbers have been falling steadily since November of last year. (Ditto for new home sales, which will be reported next week.)
New, Existing Home Sales Charts
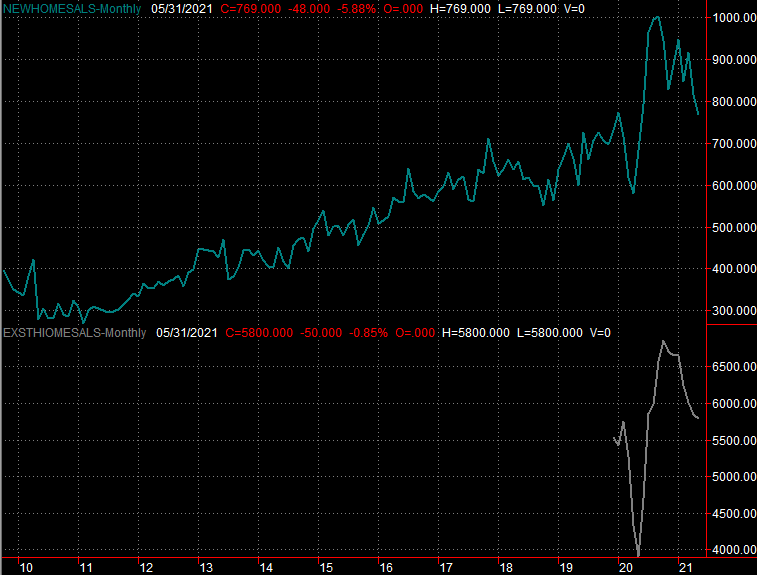
Source: National Association of Realtors, Census Bureau, TradeStation
Do bear in mind a lack of inventory has been something of a bottleneck, though that bottleneck is now starting to widen. The number of existing homes for sale has improved from February's 1.03 million to 1.23 million in May. That's still relatively low compared to last May's 1.55 million, but it's progress nonetheless.
Stock Market Index Analysis
We'll start this week's analysis with a zoomed-in view of the S&P 500, largely to illustrate that most of last week's damage was done on Friday, but also to illustrate why. A technical ceiling (orange) that was somewhat established in April and May came back into play, and if anything, was firmed up. Also notice the Volatility Index (VIX) logged a pretty good "up," pushing up and off a floor at 15.80 (green, dashed) that was starting to crumble.
S&P 500 Daily Chart, with VIX and Volume
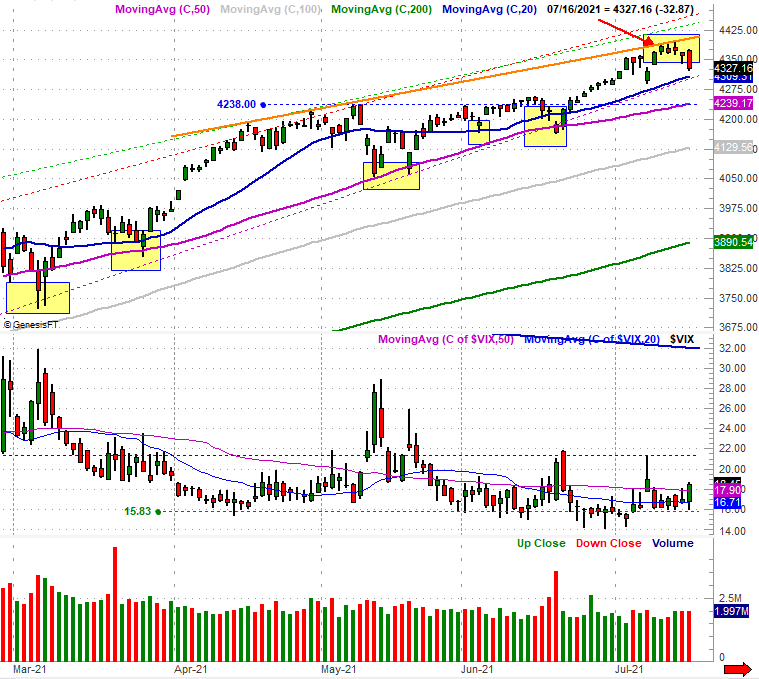
Source: TradeNavigator
Still, it's not as if the bears dealt a death blow. The S&P 500 remains above all of its key moving average line (blue) at 4309, and remains above the straight-line support (light blue) that connects all the key lows going back to March. And as you can see, that's just a small sampling of the lines the index is still above. In the same vein, the VIX may be positioning for a run higher, though it remains under a key technical ceiling at 21.3. It would have to hurdle that line first before we could even consider the prospect that this is the beginning of the long-awaited correction.
The weekly chart of the S&P 500 puts this all in perspective. That's not the curious thing to note of the weekly chart though. The S&P 500 has been moving forward pretty consistently since March of last year, but it's been doing so within a fairly narrow trading range that's getting narrower every week. Eventually it's going to run out of room to maneuver altogether, which will effectively force traders to decide which side of the range the market is supposed to be on.
S&P 500 Weekly Chart, with Volume
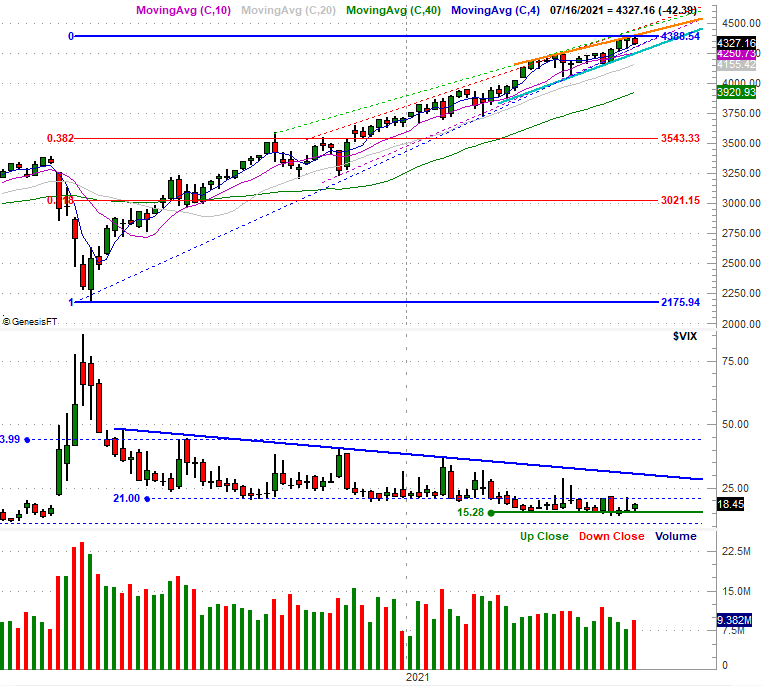
Source: TradeNavigator
If it's the underside, that opens the door to a sizeable correction. How far that correction might dig in is difficult to say, but the 38.2% Fibonacci retracement at 3543 would mark about a 20% correction. That's above average, but the rally since early last year has also been (well) above average.
All the same, keep an eye on the VIX. It needs to clear the weekly chart's falling resistance line (blue) currently at 31.0 before we can seriously entertain major bearish prospects.
The NASDAQ Composite's charts look more or less the same as the S&P 500's, though with one minor exception. The composite lost a lot of ground the last three days of last week, to log nearly a 2% setback for the full trading week. That selloff dragged the NASDAQ below its 20-day moving average line (blue) by Friday's close, as you can see on the daily chart below.
NASDAQ Composite Daily Chart, with Volatility Index
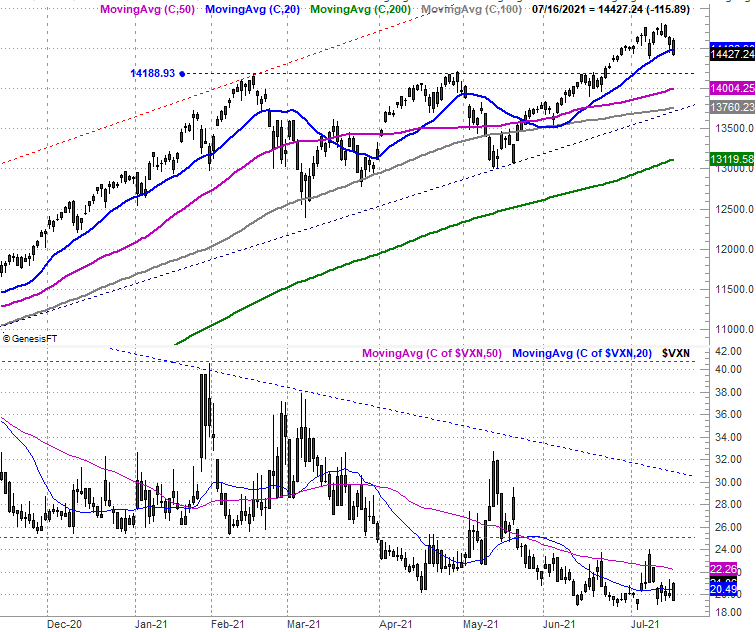
Source: TradeNavigator
Still, that's not a red flag to worry about. We've seen this happen plenty of times since February, and none of those setbacks started any major selloffs. The key here is the rising support line (dashed) that connects all the key lows since June of last year (see the arrows). As long as the composite holds above this level, its long-term rally remains intact, as you can see on the zoomed-out long-term daily chart below.
NASDAQ Composite Daily Chart, with Volatility Index
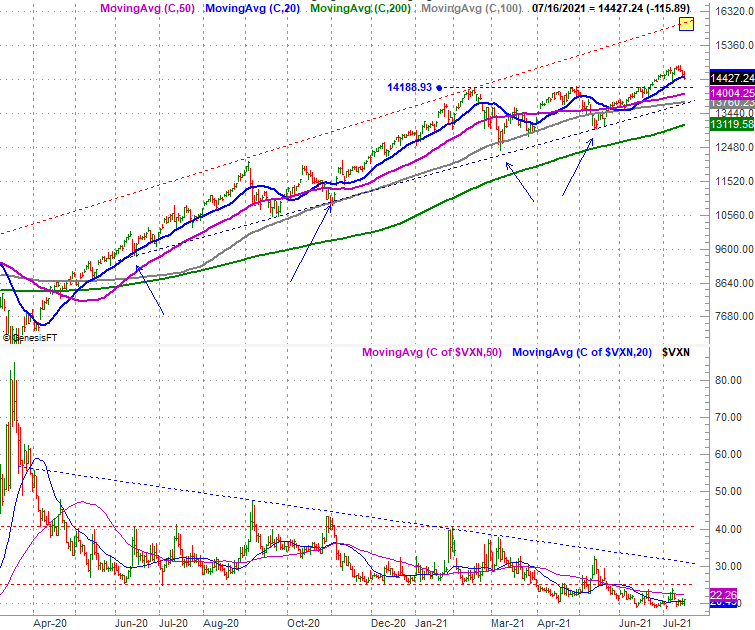
Source: TradeNavigator
Like the S&P 500's Volatility Index, the VXN inched a little higher last week, but remains well below the critical technical ceilings that would signal a more serious correction was taking hold.
Simply put, the rally is still alive. Given how we ended last week on a low note don't be surprised if the bears are still growling as we kick this week off. In light of the positive sentiment and the likelihood that Q2 earnings outlooks are at levels meant to be topped, the bullish mindset should persist. We're still prepared for a pullback that's long overdue, but there's still no technical reason to suspect it's upon us.