Weekly Market Outlook - Last Week Was Good, Except For The Part That Wasn't
The market's downtrend underway since early February was quelled last week, but not decisively. Some of the indices were able to fight their way back above technical resistance. Others were not. The one index we wanted to see achieve the feat though -- the NASDAQ Composite -- did the job. This gives the bulls just a bit of an edge.
Nevertheless, we need all the indices to participate in the effort and make technical progress sooner or later. That could happen as soon as this week if it's going to happen (although it doesn't necessarily have to happen this week).
We'll dissect it all below. First, however, we need to look at last week's wave of economic announcements and preview what's due this week.
Economic Data Analysis
It was a big week, with several critical economic reports coming out.
One of them is February's inflation data. Tuesday's consumer inflation numbers confirm the pace of prices increases continues to slow, but at 6% (annualized) it's still rather high. It remains to be seen just how will people can absorb their persistently higher costs. The same goes for the nation's factories and producers. The producer price inflation rate now stands at a multi-month low of 4.5%, but that leaves these costs still considerably higher than they were a little over a year and a half ago.
Inflation Rate Charts
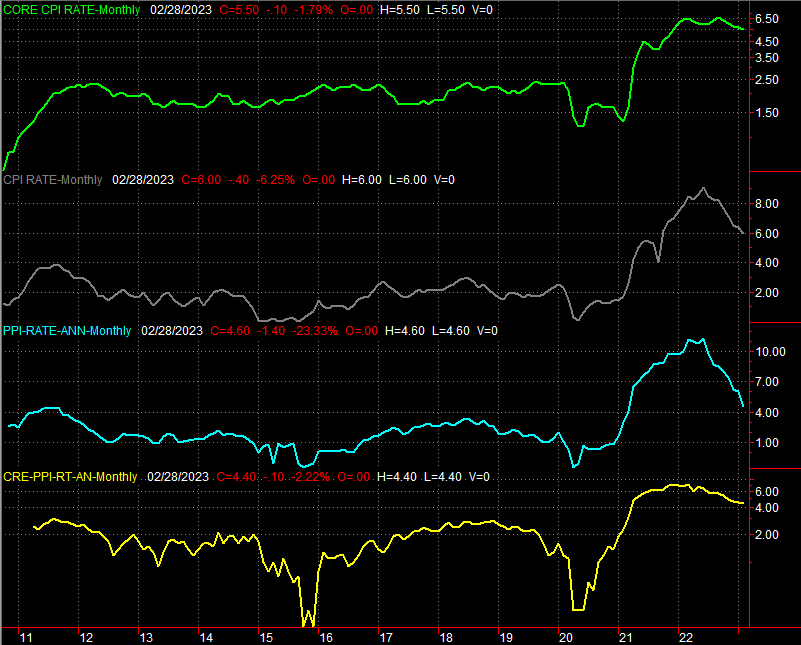
Source: Bureau of Labor Statistics, TradeStation
The direction of the year-over-year inflation rates is encouraging. The Federal Reserve, however, may still feel as if it needs to put in a bit more work to keep things moving in this direction... perhaps enough to drive prices lower a bit (although that can be problematic for the economy as well). As it stands right now, the fed futures market is saying there's a 62% chance the FOMC will raise rates by a quarter of a point this week, while there's a 38% chance it will leave rates right where they are.
Retail sales fell a bit last month, with or without auto sales factored in. Even so, the bigger trend is still encouraging.
Retail Sales Charts
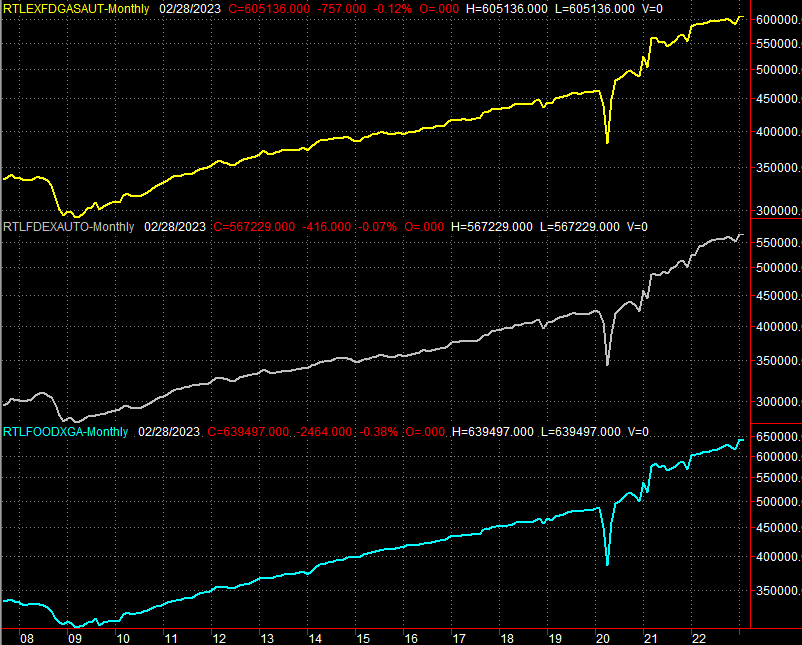
Source: Census Bureau, TradeStation
On Thursday we heard February's housing starts and building permits data. It was surprisingly strong, and much better than expected. It looks like a wave of buyers took advantage of the short-lived dip in interest rates from a few weeks back. As such, it's hard to say last month's big jumps in starts and permits marks the beginning of a real estate recovery.
Housing Starts and Building Permits Charts
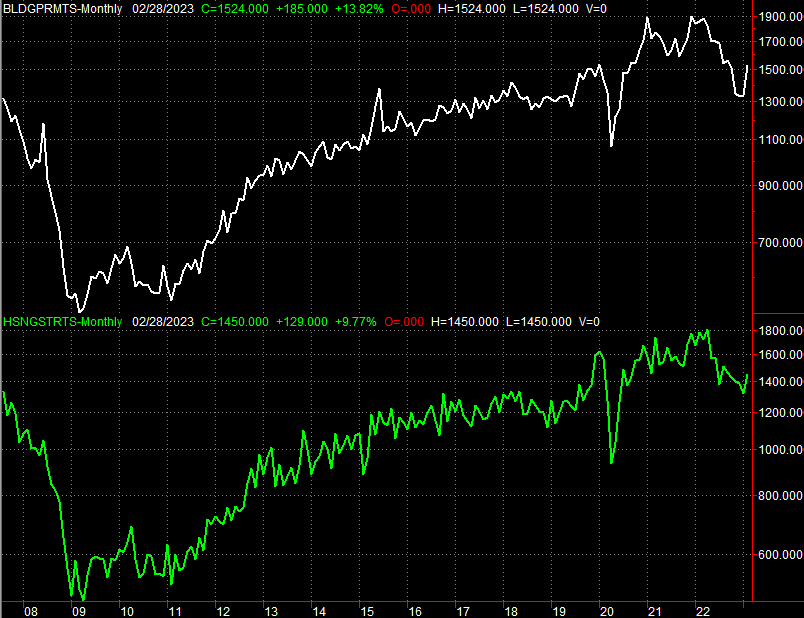
Source: Census Bureau, TradeStation
Last but not least, on Friday we heard from the Fed about February's industrial production and capacity utilization. Both were basically even with January's numbers, which would be ok had economists not been calling for respectable improvements for each. Both could be better here, rather than leveling off following last year's lull.
Industrial Productivity and Capacity Utilization Charts
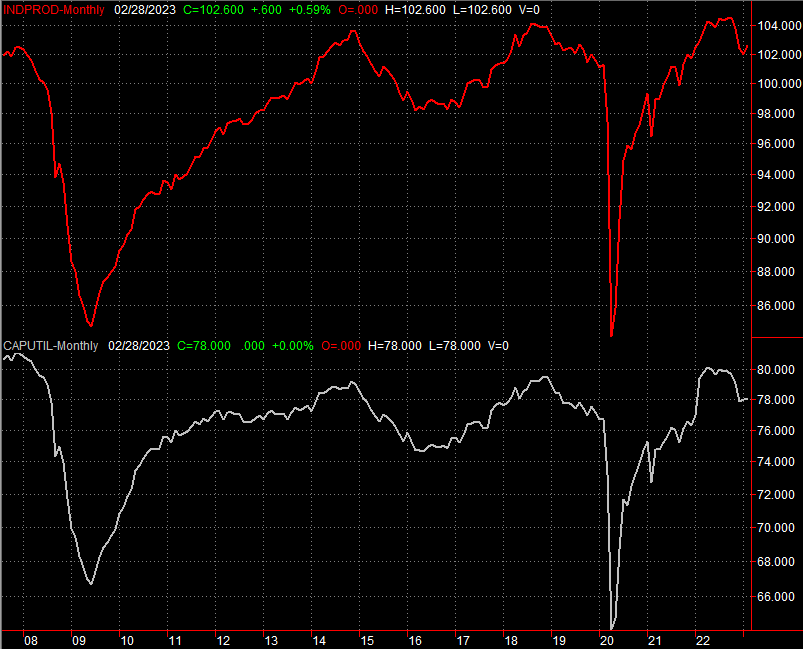
Source: Federal Reserve, TradeStation
Everything else is on the grid.
Economic Calendar

Source: Briefing.com
This week isn't going to be as busy, but we will hear a couple of important data nuggets. In addition to Wednesday's decision on interest rates, look for February's existing home sales report on Tuesday, and new home sales data on Thursday. We should see a small improvement of sales of existing homes, paired with a slight decline on sales of new houses. Both measures, however, are relatively poor.
New, Existing Home Sales Charts
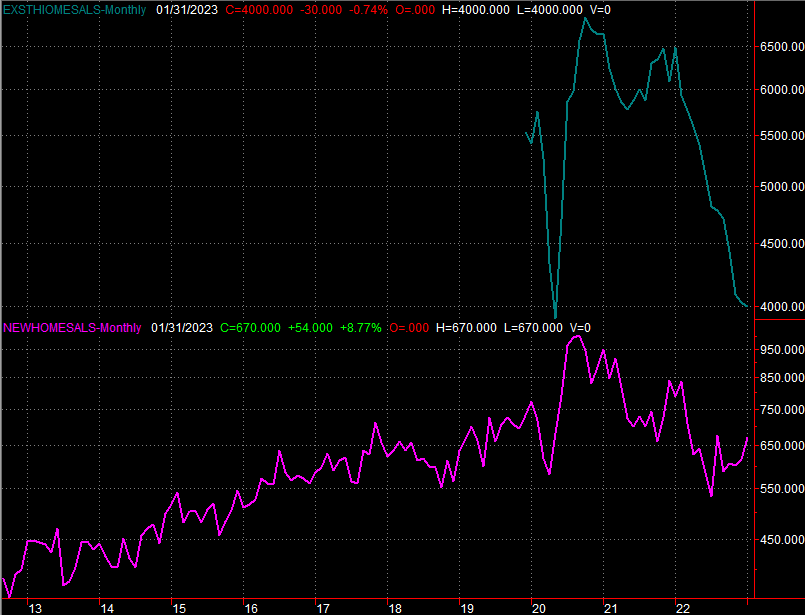
Source: National Board of Realtors, Census Bureau, TradeStation
At least there's a smidgen of hope for homebuilders, who are seeing sales bounce back from last year's lull.
Stock Market Index Analysis
We'll start with the good news... the NASDAQ Composite managed to fight its way back above all of its potential technical resistance lines last week. Take a look. Thanks to Thursday's rally (and Friday's effort to hold on to Thursday's gain), the index is now back above all of its key moving average lines.
NASDAQ Composite Daily Chart, with VXN
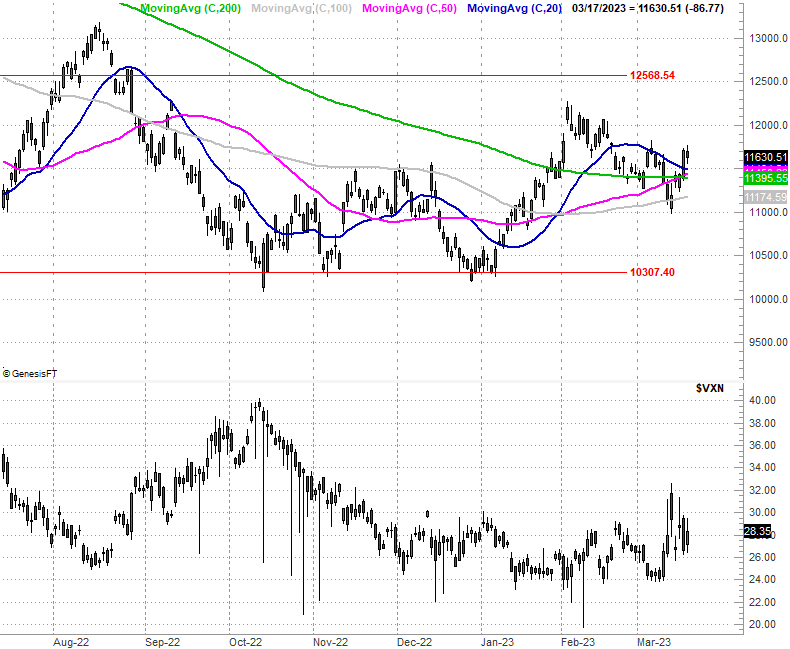
Source: TradeNavigator
Also notice the 50-day moving average line (purple) crossed above the 200-day moving average line (green), giving us a so-called "golden cross" that's supposed to portend more bullishness.
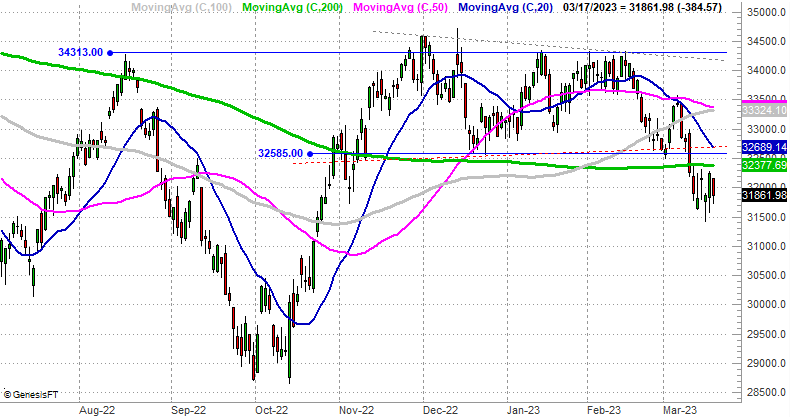
The bad news is, the S&P 500 wasn't able to do the same deed. It briefly traded above its 200-day moving average line on Thursday, but peeled back under that long-term line on Friday. It may have been the approach toward the 20-day moving average line (blue) that spooked the buying effort. (Note how the 20-day moving average line was a ceiling back in early March as well.)
S&P 500 Daily Chart, with VIX and Volume

Source: TradeNavigator
The Dow Jones Industrial Average is also still in a heap of technical trouble despite the fact that it managed to stop its bleeding last week. It's still trading below all of its key moving average lines.
Dow Jones Industrial Average Daily Chart
Source: TradeNavigator
Here's the catch: We have to take last week's action -- and particularly the last couple of days from last week -- with a grain of salt. It was a triple-witching day, where monthly and quarterly options expire, forcing traders to either let them expire, roll them over, or exercise them. Expirations can induce a lot of activity (for better and worse), which is why we saw such a volume surge on Thursday and Friday.
More to the point, not that we were going to be able to anyway, but we certainly can't jump to any conclusions about the market's current direction based on last week's action. We could start this week out easily moving in either direction.
That's why we'll want to take a step back here and make a point of keeping the bigger-picture in mind. A refreshed look at the weekly chart of the NASDAQ Composite will do the trick. From this perspective we can see that perhaps we shouldn't even be worrying about figuring out the market's current direction at all. Either way, we're still squarely trapped between 61.8% and 38.2% Fibonacci retracement lines (a retracement of the bull run between early 2020 and late 2021).
NASDAQ Composite Weekly Chart, with VXN

Source: TradeNavigator
So, maybe the smart-money move here for now is just doing nothing and letting the indices prove their direction by supplying considerably more evidence than is possible right now.