Weekly Market Outlook - Knee-Jerk Rebound Leaves More Questions Than Answers
As quickly as the market was up-ended on Monday, it made a hard turn on Tuesday. By the time the closing bell rang on Friday, a surprisingly strong November jobs report prompted the market back into the black for the week. Stocks got a bullish kicker from renewed hopes that a trade deal with China would end up getting done sometime soon after all.
It's an amazingly flawed rebound, with not one but two gaps left behind. On the flipside, this is the time of year when stocks are reliably bullish. The gaps may not matter... at least not yet.
We'll weigh the good and the bad against one another below, as always. First though, let's run down last week's economic news and preview what's going to be announced this week. There are some hard-hitters for both weeks.
Economic Data Analysis
Last week was pretty busy from the start, kicking off on Monday with a look at last month's ISM Manufacturing Index, with the ISM Services Index being posted on Wednesday. The manufacturing measure fell a little -- and a little more than expected -- but more than that remains below the 50 level. The services index (non-manufacturing) also fell, but remains above 50. Either way, neither is proving particularly impressive.
ISM Index Charts
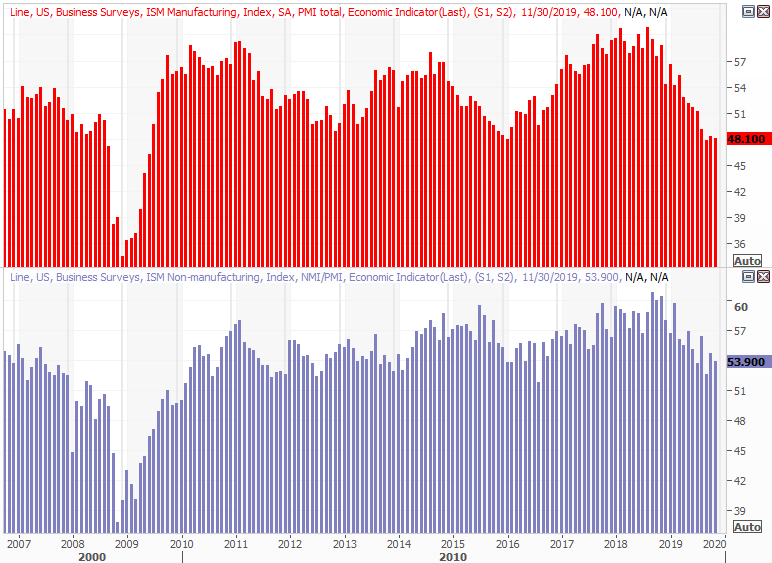
Source: Thomson Reuters Eikon
Again, keep in mind that the ISM Indices are based on a survey, or poll, and not rooted in actual numerical data. It's possible that corporate purchasing managers are being influenced be headlines without actually seeing a measurable decline in demand.
On Tuesday, November's automobile sales numbers gave investors a glimmer of hope. Sedan/car as well as truck purchases were up a bit from October's levels, and more important, holding steady rather than peeling back following 2015's "peak auto."
Automobile Sales Charts
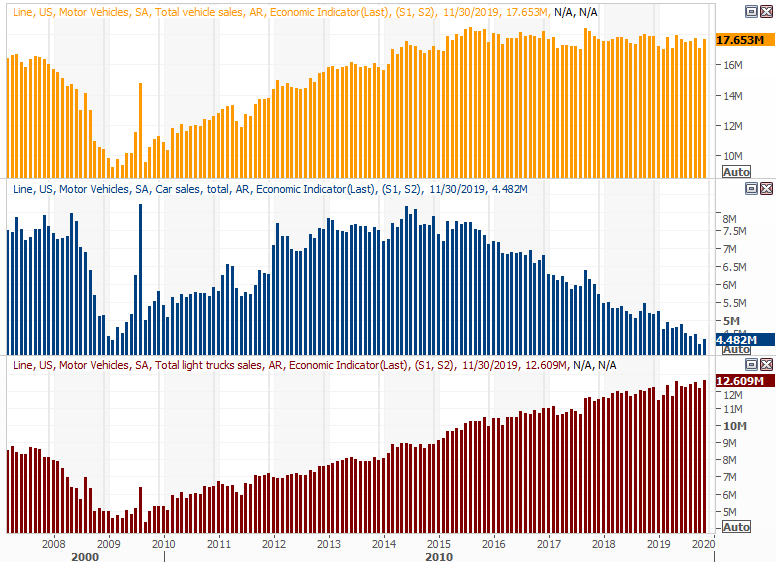
Source: Thomson Reuters Eikon
It's not as encouraging as forward progress, but it does suggest consumers are feeling confident enough about their job security and incomes to buy new automobiles. In that same vein (and we'll look at this in more detail later in the month), the first look at the University of Michigan Sentiment Index showed another nice increase in optimism.
The biggie for the week was of course Friday's jobs report for November. Payroll growth was far better than expected, driving the unemployment rate back down to a multi-decade low of 3.5%.
Payroll Growth, Unemployment Rate Charts
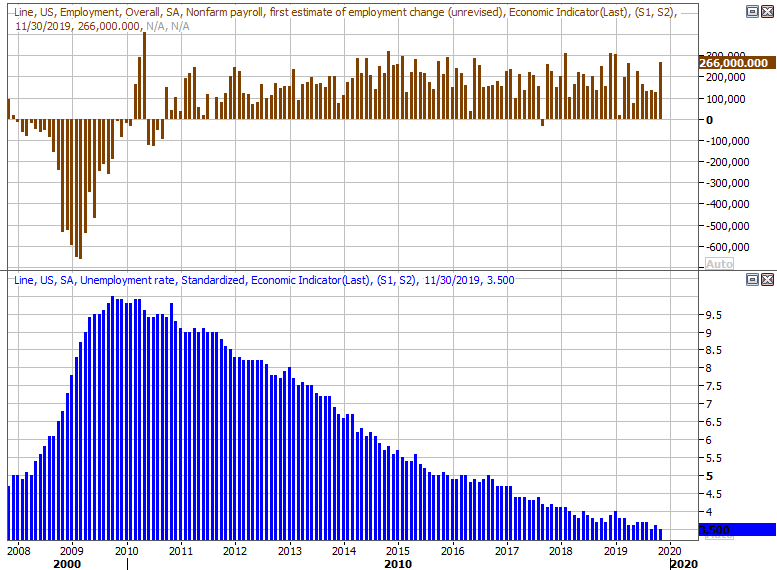
Source: Thomson Reuters Eikon
That strength wasn't a stroke of mathematic luck either. All the other related indicators of employment strength were up, as discussed in detail at the website: https://www.bigtrends.com/education/markets/yes-the-november-jobs-growth-was-really-that-strong
Everything else is on the grid.
Economic Calendar
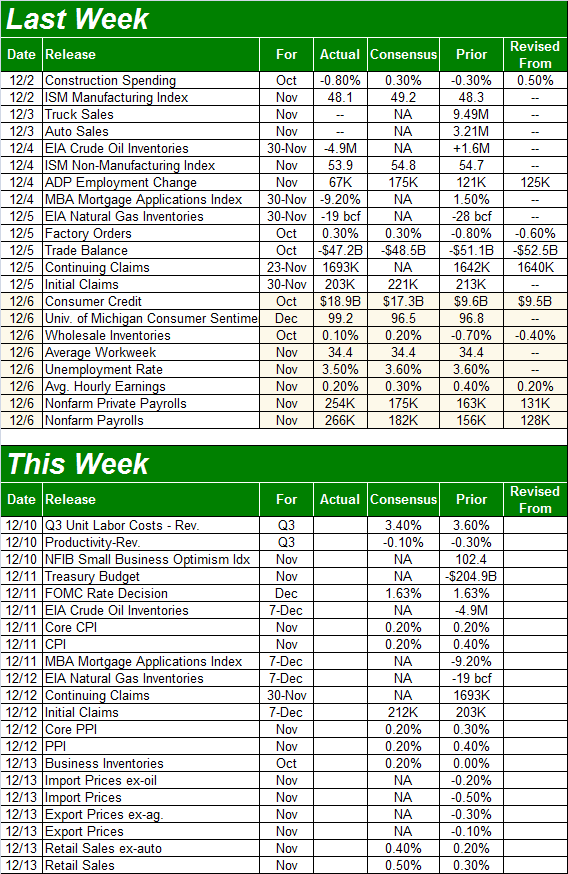
Source: Briefing.com
This week is going to be a pretty big one too, with the Federal Reserve slated to make a decision regarding interest rates. As of the most recent look traders are betting there's a 99% chance the FOMC won't change a thing, opting to keep the target rate between 1.5% and 1.75%.
Whether or not the Fed is going to feel the same next month will at least partially depend on the inflation reports slated for Wednesday and Thursday. The good news? Whether talking about consumer or producer inflation, economists are looking for more of the same tepid, tamed inflationary pressure despite low interest rates being a prospective cause for inflationary pressure.
Inflation Charts
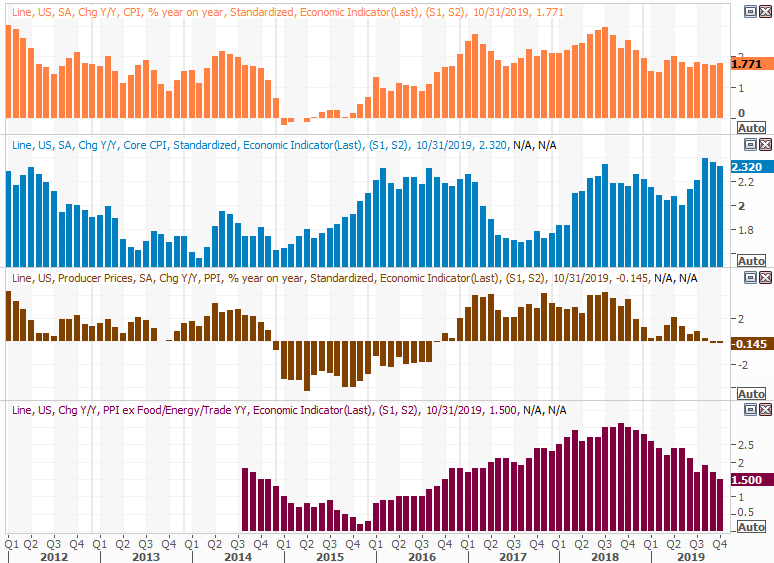
Source: Thomson Reuters Eikon
Perhaps the biggest news of the week will be reported in Friday. That's when last month's retail spending report is due, once again hinting at just how strong consumers are feeling here. Forecasters are looking for a good month... even better than October's. And, given the early jump on holiday shopping, the optimistic forecasts aren't out of reach.
Retail Sales Charts
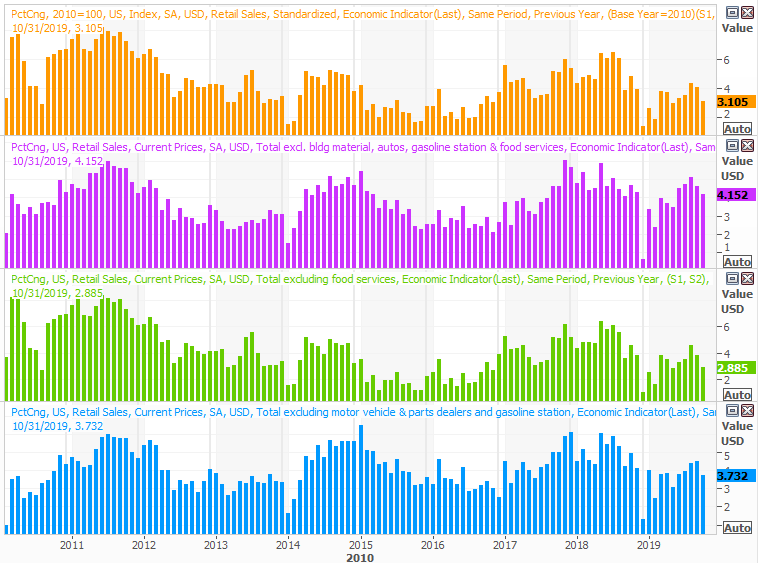
Source: Thomson Reuters Eikon
Stock Market Index Analysis
We're starting this week's analysis with a bigger-picture view via the weekly chart of the S&P 500, because perspective is needed to fully appreciate last week's tumble and immediate bounceback (a bounceback that only adds to the confusion).
And yes, the market did bounce back last week from a very rough start. It was only a 0.1% gain. But, at the low point on Tuesday it was down a little more than 2.2%, struggling to hold onto its oversized gain from late September... a 10.4% gain. At the high from two weeks ago, the S&P 500 was up 34% from last December's low. Granted, last December's bounce started with the advantage of coming out of a major setback. Still, that's a lot of ground to cover in less than twelve months.
S&P 500 Weekly Chart, with VIX
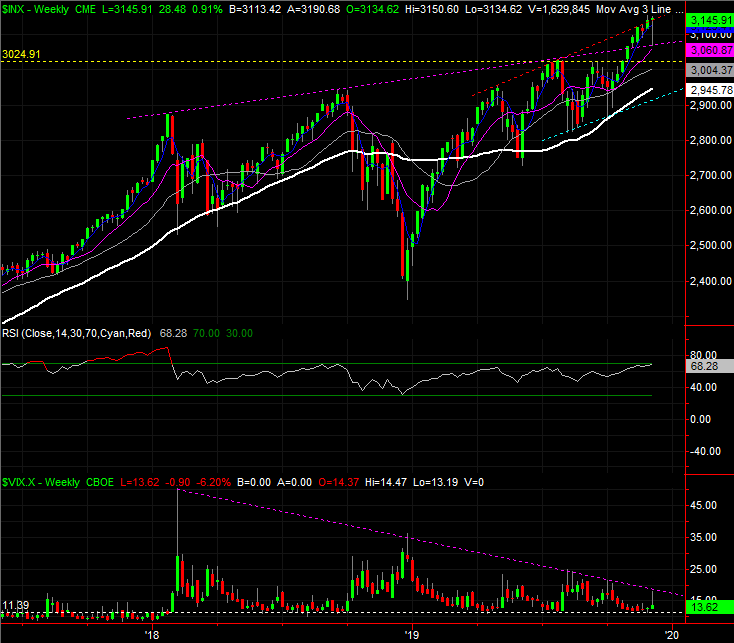
Source: TradeStation
The long-term look at the weekly chart also gives us something else we've been waiting on for a while... a clue from the VIX.
As one would expect, it's been trending lower since the early 2018 bottom, but with no clear framework. That framework has emerged. It's the falling purple, dashed line plotted across all the major highs going back to February of last year. The broad market may be overextended and due for a pretty significant correction -- the RSI indicator is now as high as it was in September of last year, right before a big selloff. But, the VIX is going to have to break above its technical ceiling before the S&P 500 is going to be in a confirmed, corrective downtrend.
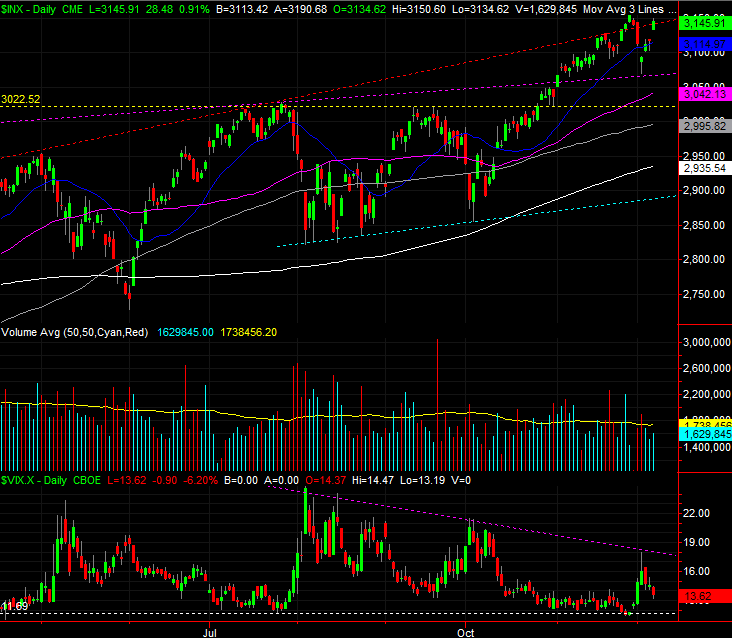
Now, zooming into the daily chart of the S&P 500 we can see the problem with planning on a pullback... there's a ton of potential support below where the index is here. It starts with the 20-day moving average line (blue) at 3115 and ends at the 200-day moving average line (white) at 2935. Those lines and the 50-day and 100-day moving average lines are all prospective floors.
S&P 500 Daily Chart, with VIX and Volume
Source: TradeStation
Odds are the floors made by all those moving averages will be tested again. The market is overbought with two major gaps in the rearview mirror. And, while traders seem intent on making another Santa Claus rally this year, there's not a lot of room left to keep moving higher. There's a catch though. That is, there's a huge disparity between where the upper floor is and where the lowest one is. The VIX could punch through its ceiling and it still wouldn't be a market killer. The S&P 500 will remain in a technical uptrend until it falls under the support line connecting the August and October lows, plotted as a light blue line. Don't mistake a stumble for the beginning of a bear market.