Weekly Market Outlook - It's 'Put Up or Shut Up' Time for the Bulls
 In case you were wondering, last week was the worst week for stocks since March. It's also worth noting that the drubbing in question from March also sparked a rather significant rally. Will this time turn out any different? It's tough to say, though given that we're neither fundamentally nor economically any worse off now than we were then, we have to be open-minded despite the hysteria.
On the other hand, if enough traders simply refuse to believe stocks can do anything but sink from here, they'll drive stocks lower. But, there's a goofy hint that says traders aren't actually as bullish as they're acting.
We'll talk about that in a moment. The first thing we need to get out of the way is a look at last week's economic news. It ended with a look at November's jobs data, which is always interesting.
Economic Data Analysis
Most of the reports from last week were overshadows by the Presidential funeral and a stunning selloff in stocks. But, a handful of last week's news is most definitely worth backtracking for.
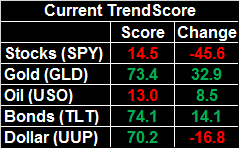
The week got going with a look at November's ISM Manufacturing Index, which was up from October's score of 57.7, and better than that 57.2 reading the pros were modeling. Indeed, the score of 59.3 rekindles hope that manufacturing businesses aren't slowing down. On Wednesday we got an ISM Services Index score of 60.7, which actually extends a renewed uptrend towards multi-year highs.
ISM Index Charts
Source: Thomson Reuters
Note that both numbers came in better than expected, suggesting economists may be underestimating the nation's economic strength.
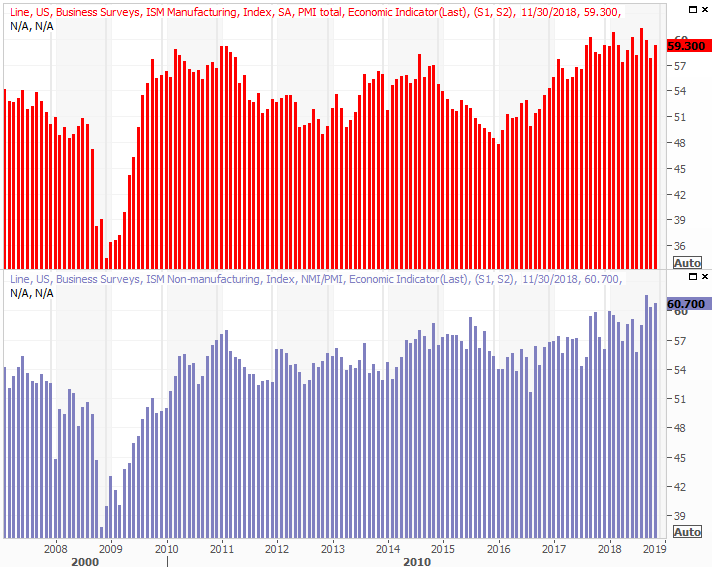
November's auto sales remained firm. While car sales fell a bit as the post-hurricane reimbursed purchase wave slowed, truck sales were actually up a bit. The overall pace of 17.5 million may point to stabilization at that level.
Automobile Sales Charts
Source: Thomson Reuters
Last week's biggest news, of course, was the November jobs report. Unemployment didn't change, coming in again at a multi-year low of 3.7%. Though payroll growth slowed to only 115,000 new jobs, that's not a function of a limited number of positions as it is a limited number of applicants. It's also a function of a huge month of hiring in October. That count, already strong at 237,000 with the first reading, was actually revised up to 250,000.
Payroll Growth, Unemployment Rate Charts
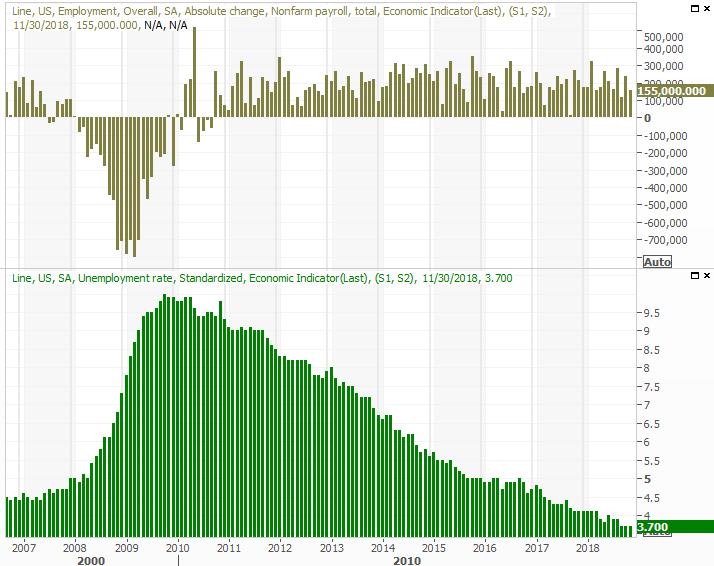
Source: Thomson Reuters
The full story of November's employment picture is available at the website: https://www.bigtrends.com/stocks/november-jobs-report-is-better-than-is-sounded/
Everything else is on the grid.
Economic Calendar
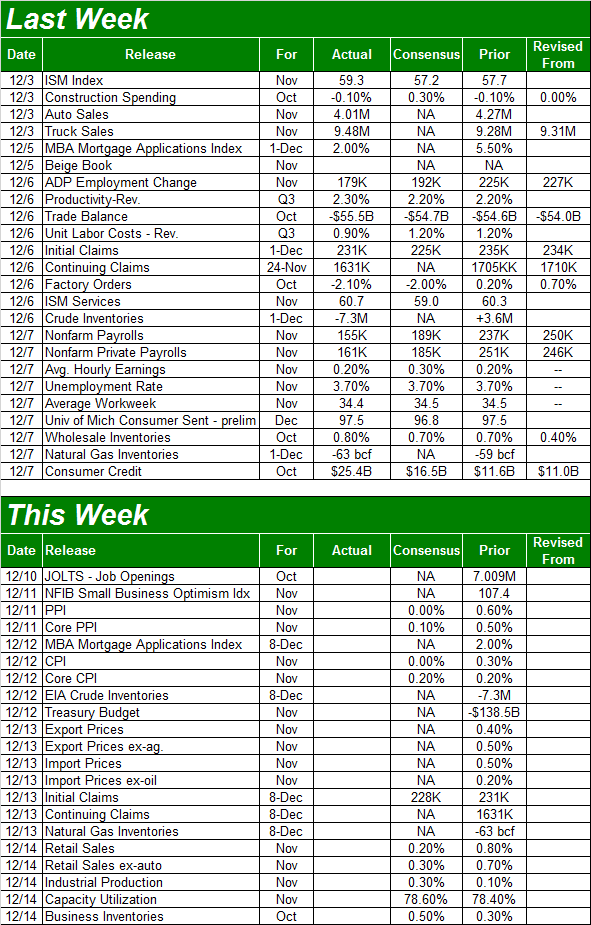
Source: Briefing.com
This week is going to be just as busy, with just as many hard-hitting items in the queue.
Among the week's most-watched items will be Tuesday's producer inflation report, followed by Wednesday's consumer inflation news. Investors have been unsure as to just how committed the Federal Reserve really is to its previously-suggested rate-hike agenda, the last month's inflation data will be the last - but most important - data nugget to process before that decision is made. Economists are expecting things to cool off just a bit, again, hinting that things have finally stabilized and the FOMC doesn't have to be quite so aggressive. We'll see.
Producer, Consumer Inflation (Annualized) Charts
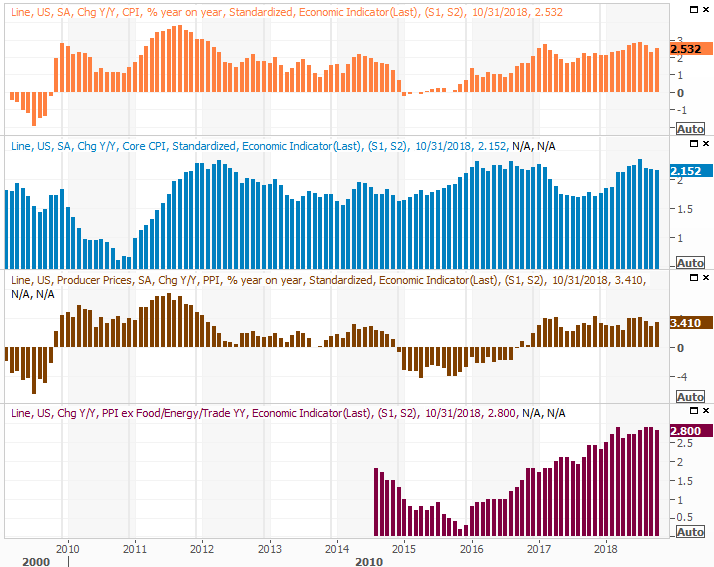
Source: Thomson Reuters
Friday is a huge day. We'll hear last month's retail sales data, which should give us an indication of how confident consumers are here. It's an especially important report for retailers and makers of consumer goods, as November is a rather busy shopping month. Economists are calling for a slowdown, with or without cars. But, the outlooks feels like numbers being established to top.
Retail Sales Charts
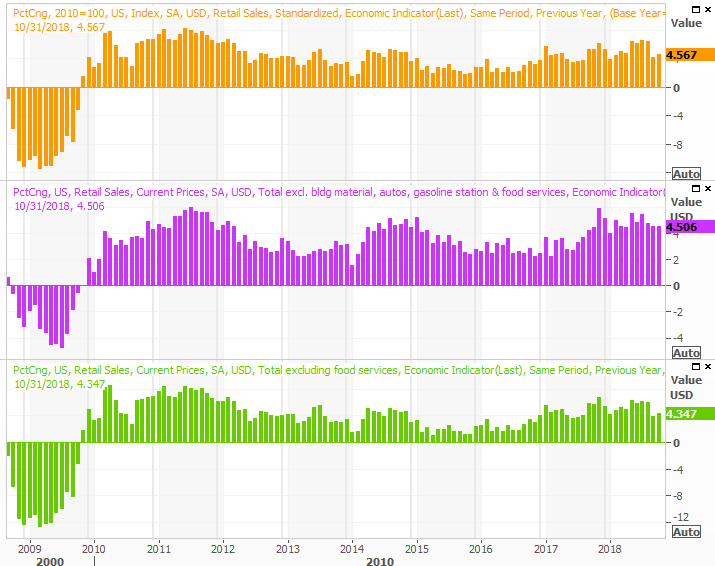
Source: Thomson Reuters
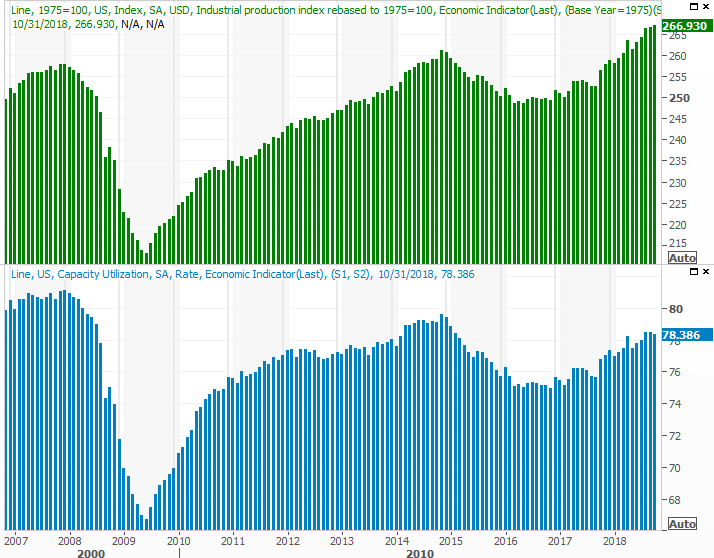
Also on Friday keep your eyes open for last month's capacity utilization and industrial productivity figures.
The correlation between the economy, the market, corporate earnings and industrial activity is amazingly strong, so in most regards this information can be used as a long-term market barometer. It won't fend off short-term swings, but it will indicate the bigger trend. Whatever the case, the pros are calling for another modest improvement, extending a progressive trend that's been in place since
Capacity Utilization, Industrial Productivity Charts
Source: Thomson Reuters
Stock Market Index Analysis
Is it possible things could get so bad that they're actually good for the market? It's a question most traders will be asking themselves as the new trading week kicks off. Last week's meltdown was the biggest we've seen in months, and the market is hanging by a thread. But, from a contrarian point of view, things literally can't get any worse... when the backdrop is still one characterized by economic and earnings growth.
That's the long way of saying valuations don't support lower lows, but with investors terrified right now, reason doesn't matter. One more bad day could fully convince traders that there's nowhere to go but down now. They'll act accordingly.
The fundamental flaws in the bullish argument are that the VIX has yet to really surge to unusually high levels, and we've yet to see a decisive crash day marked by a volume surge that suggests a washout. The key flaw with the bearish argument is, while Friday was ugly, there wasn't a lot of volume behind the move. This may not really be a majority opinion.
S&P 500 Daily Chart, with Volume
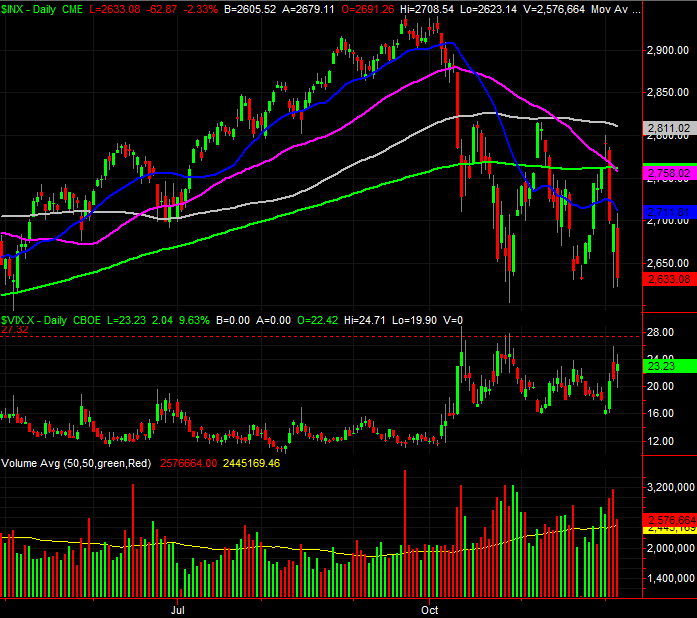
Source: TradeStation
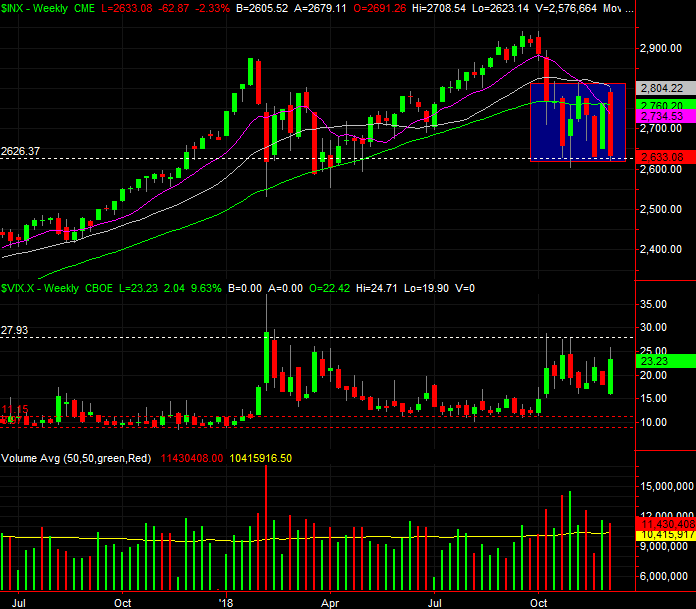
Zooming out to a weekly chart is actually quite telling, for a change.
Take a look. The market has tried to rally a couple of times since October's pullback, but both times has answered with a huge dip. This action isn't remarkably different than the kind of trading we saw in February and March, but it's not exactly the same either. Since late October, the S&P 500 has been stuck in a well-defined box, and this time, the 200-day moving average line (green) isn't acting as a support line. It was shattered as a floor weeks ago.
S&P 500 Weekly Chart, with Volume
Source: TradeStation
Still, rule nothing out.
This really is an unusual time for the market, and a dangerous one. Cash balances (compared to exposure to equities) are as high as they've been in nearly three years. That's superficially bearish, but bullish in the sense that once traders realize they need not be so scared they'll pour back into stocks.
There's a chance, however, that things look so grim to so many people right now that most investors will simply refuse to buy back in even though they've got good reason to.
And then there's the so-called death cross, where the S&P 500's 50-day moving average line crosses below the 200-day average. It just happened, which is also bearish. The track record of death crosses is miserable though. https://www.bigtrends.com/stocks/the-truth-about-fridays-death-cross/
In most cases the market is higher within three months of a death cross. Almost the only times a death cross is bearish three and six months later is when we're in a bear market that's caused by a recession. We have neither of those conditions right now... at least not yet.
Simply put, sentiment has hijacked the market, but sentiment can stop and turn on a dime. That can be a good thing or a bad thing, as we've seen several times just since October.
In this instance we're actually inclined to lean bullishly, even in the absence of a true capitulation. But, we're also willing to warn that this week's action could get started on a stunningly bearish foot, with the sellers following through on Friday's drubbing. The irony is, is an early setback is harsh enough and finally drives the VIX sharply higher, that will be the capitulation we haven't seen yet. The tough part about that possibility is that it will feel like you're catching a falling knife.
The other possibility is a decided rebound effort. But, until the S&P 500 Index actually breaks back above all of the moving averages plotted on the daily chart, that bounce effort will remain vulnerable.
Unless you're nimble or thinking very short-term, this may all be something you want to watch from the sidelines.