Weekly Market Outlook - It's Now or Never For Year-End Bullishness
 Though Thanksgiving was last week, investors had little to be thankful for. In just four (well, three and a half) trading days, the S&P 500 managed to lose 1.2%, essentially retesting the lows made in late October. Hopes that the rebound effort that got going on in early November would actually go somewhere have been soundly dashed.
That doesn't mean they should have been. In most regards, little has changed about the health of the economy or corporate earnings. Most of what changed has been the change between investors' ears... not that such a change isn't enough to do serious damage.
Still, don't rule out a quick renewals of the uptrend that petered out last week.
We'll take a technical look at the market below, as always. First though, let's run down last week's economic reports and preview this week's announcements. There are a couple of biggies in the queue.
Economic Data
The holiday break meant we didn't get our normal flow of economic announcements, though we still got a few, and several regarding the real estate sliver of the market. On Tuesday we saw a slight uptick in housing starts and a slight dip in building permits. And, on Wednesday we heard October's sales of existing homes perked up to a pace of 5.22 million.
Housing Starts and Building Permits Charts
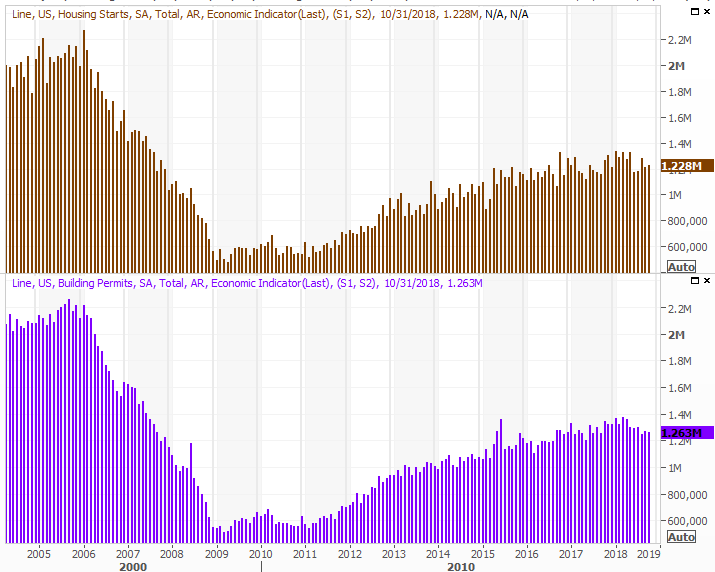
Source: Thomson Reuters
New, Existing Home Sales and Inventory Charts
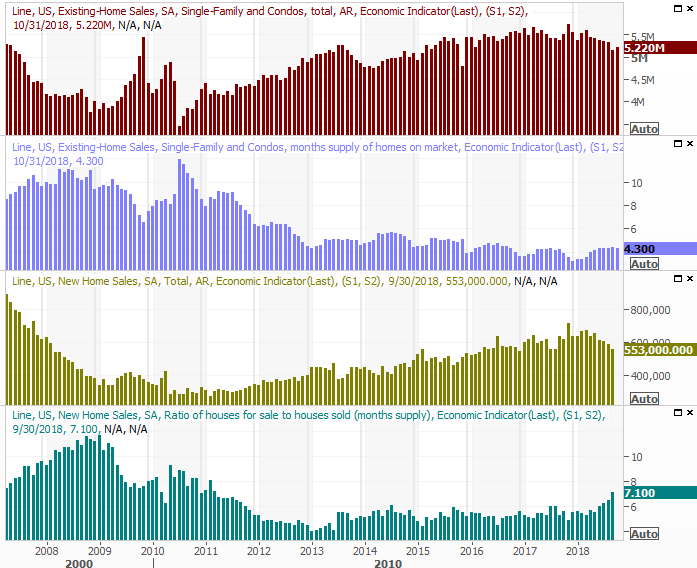
Source: Thomson Reuters
Though encouraging, it's difficult to say the real estate and construction market is truly better... and it's still in desperate need of 'better.' We'll round out the picture this week with a look at October's new home sales on Wednesday. The pros are calling for an improvement, though like existing home sales, one good month won't alter the bigger trend. It would take at least three months to get the sector back on a firm footing, and with mortgage rates still just a bit off of recent multi-year highs, somehow it doesn't feel like the real estate arena is healthy.
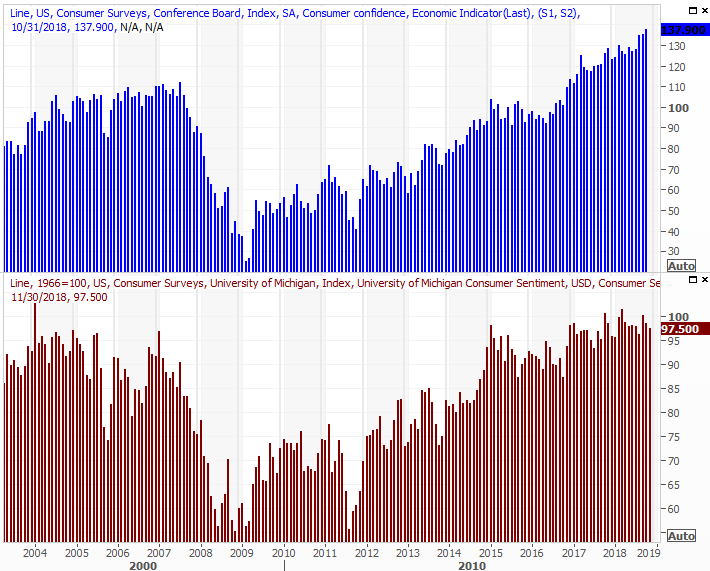
Also note we got the third and final look at November's Michigan Consumer Sentiment reading, rolling in at 97.5. That's down a bit from the second estimate, lower for the third month in a row. Still, the measure suggests firm confidence.
Consumer Sentiment Charts
Source: Thomson Reuters
On Tuesday of this week we'll get the Conference Board's look at the same consumer sentiment. This alternative measure has continued to trend higher, reaching a new multi-year high of 137.9 in October. Economists are calling for a slight dip this time around, but it's still at levels rarely seen, and at levels that coincide with strong consumer spending.
Everything else is on the grid.
Economic Calendar
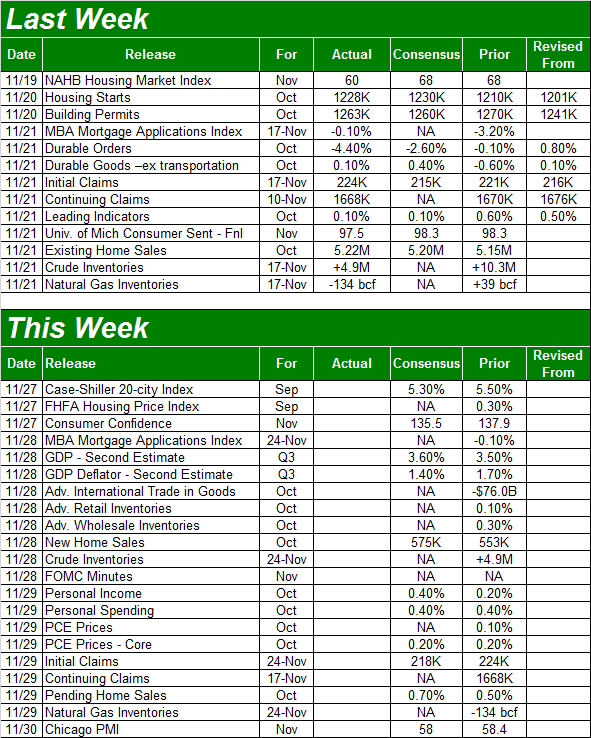
Source: Briefing.com
This week will be a little busier, and more than that, it will really round out the snapshot of the real estate industry.
On Tuesday look for the Case-Shiller Index and the FHFA Housing Price Index reports. Both are only for September - not October. Nevertheless, they'll help paint a picture using some broad brushstrokes. Each is trending higher, but both have been slowing. Look for more slowing this time around too.
Home Price Index Charts
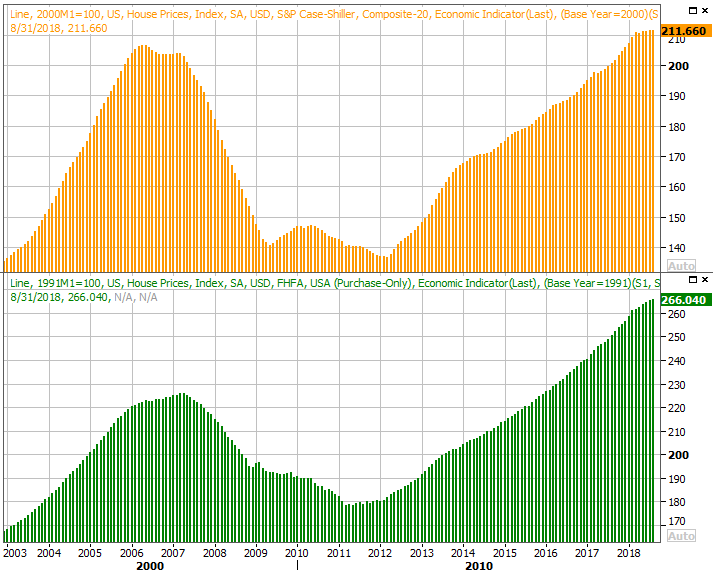
Source: Thomson Reuters
The other biggies in the queue for this week are Tuesday's second (of three) look at Q3's GDP growth rate and the release of this month's FOMC meeting minutes. It's not one that's a scheduled opportunity to raise interest rates, and it's not likely the Fed will impose one off the schedule. All the same, there's much to be gleaned from the meeting's language. Next month's scheduled decision is still likely to end with another quarter-point hike.
Index Analysis
For the record, the S&P 500 is now down 10.4% from its late-September peak. It's actually been lower, but Friday's close of 2632.56 is the index's lowest weekly close since April.
From a momentum trader's perspective, it's clearly bullish. Not only did the S&P 500 fall 1.2% last week, it's the second week of setback, with the latter being a bigger stumble than the former. The selling is accelerating.
There's a cogent bullish argument though... one that begins with the fact that nobody can really identify the true reason for last week's selling (maybe there isn't one). Earnings are still growing will, and we actually saw more Q3 earnings beats than we normally would. The bullish case ends with the reality that we're no well into a bullish time of year and well behind the normal November/December strength.
That's the long way of saying we can't rule out a bullish reversal here, and chalk up last week's weakness to the calendar and a goofy set of circumstances.
Take a look. The market got off on the wrong foot last week, and finished on the wrong foot too. Removing Wednesday's and Friday's unusual activity, the selling volume has been above average too, and the index is well below off its key moving average lines again. Also notice that all of the key moving average lines are also now sloped downward.
S&P 500 Daily Chart, with Volume
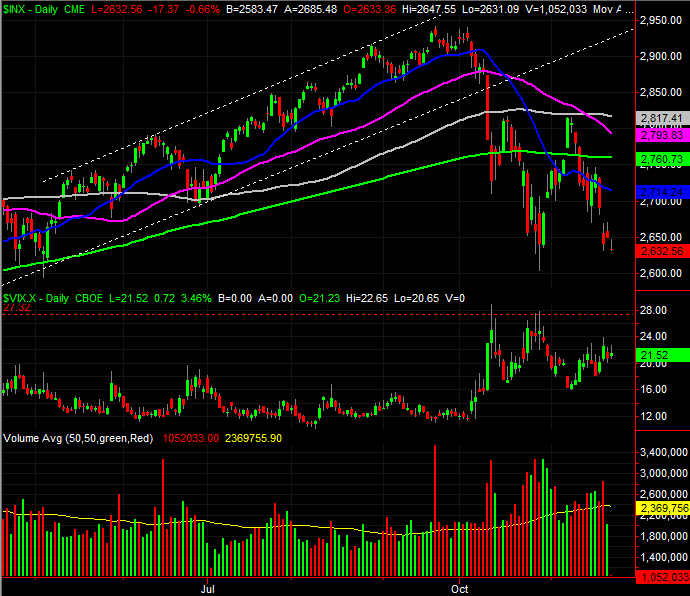
Source: TradeStation
Zoom out to the weekly chart of the S&P 500 and you'll get a lot more perspective on the whole shebang. For starters, you'll see this correction looks an awful lot like the one we saw in February and March. You'll also recall that some of the same "the sky is falling" chatter we're hearing now was also circulating then. The VIX also, curiously, didn't break to new multi-week highs even though stocks as a whole haven't been this seemingly risky in weeks.
S&P 500 Weekly Chart, with Volume
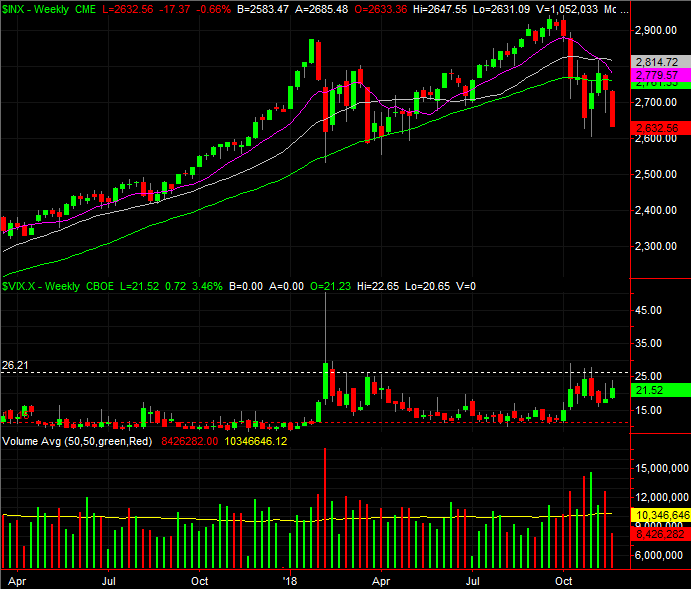
Source: TradeStation
The bad news is, the NASDAQ's corrective move is much bigger than the one it suffered in February and March, and the NASDAQ Composite tends to lead the market. Indeed, this is the first time the composite has been below its 200-day moving average line (green) since mid-2016. There's nothing in particular about the chart to suggest the bottom has to be in.
NASDAQ Composite Daily Chart, with Volume
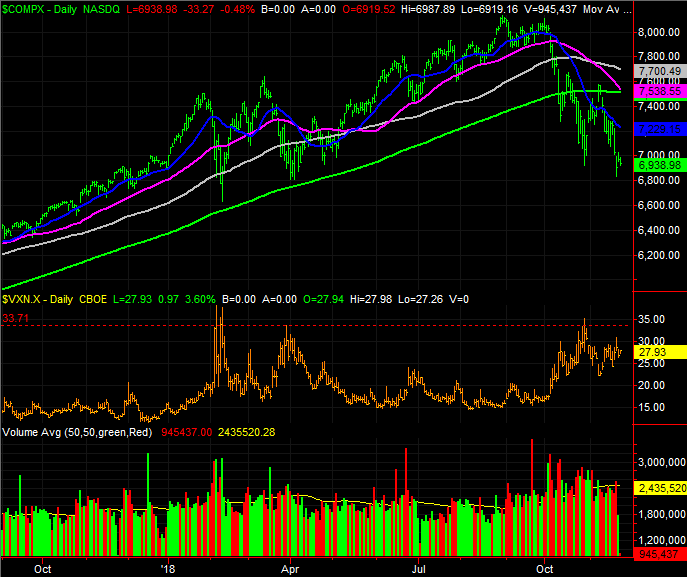
Source: TradeStation
Nevertheless, we still have to respect the distinct possibility that last week's trouble was purely a situational one, where the market was still overbought because October's tumble wasn't a true capitulation and we still had more panic-based selling to induce. Or, maybe it was largely driven by raw disinterest headed into the holiday.
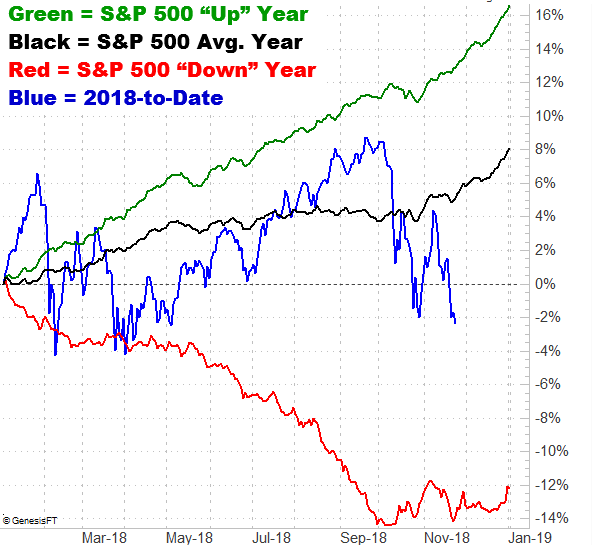
It's not an idea randomly pulled out of a hat. As the graphic below illustrates, this is a bullish time of year... even in a bad/losing year. The pullback since September is very unusual, leaving the S&P 500 well oversold at a time when things are not only hot, but are about to accelerate. December's average performance is a 1.5% for the S&P 500, and it dishes out a gain about 80% of the time.
S&P 500 YTD Performance, vs. Average
Source: TradeNavigator
Or, maybe this year is that once-every-50-years exception to the norm, where we lose ground at year-end even though previous losing years have still been at least breakevens.
How we're actually going to end the year has a lot to do with how we start this week out. Most investors know there's no rational reason for the selling, but most investors also know there doesn't have to be a rational reason. If the bears are committed, they're going to pounding the market lower again soon enough. We're reaching a point where the bulls are going to want to stop putting up any kind of fight.
Even so, if-and-when the market takes yet another tumble, be sure to be ready to by when panic selling reaches a fevered pitch.
Conversely, be willing to stagger back into new long positions if stocks are able to hammer out a slow, methodical turnaround move from here. We suspect that's in the cards, but confidence in the market's foreseeable has been quite ruffled this past week. A lower low could spark another wave of selling. It's going to take a well-paced move back above the 50-day and 200-day moving averages to get stocks back on a truly firm footing. Doing so will be more of a process than an event.