Weekly Market Outlook - Is This the Meltup Many People Were Predicting?
Another week, another again... this one the biggest of the week so far. Not only are the bulls not backing down, they're gathering steam. It's an uncomfortable advance to be sure, with would-be profit-takers keeping their finger on the 'sell' button, knowing this hype-driven rally could crumble without notice. They also know, however, that the defiance of the odds has become the new norm. Betting on a breakdown has been a bad bet for a long, long time now.
We'll weigh it all below, after a review of last week's and this week's economic announcements.
Economic Data
All in all it was a light week in terms of economic news. The only items of real interest was the first reading (of three) on Q4's GDP growth rate, and December's home sales data. Also of interest was last week's further decline in crude oil inventories... a saga we've been watching for a while now, only because oil has been such a great trade of late.
But, first things first - last month's home sales. They were... ok. Sales of existing homes fell to a pace of 5.57 million, falling short of the forecasted 5.7 million. New home sales rolled in at 625,000, also down from November's pace, and also rolling in less than predicted.
New and Existing Home Sales, Inventory Charts
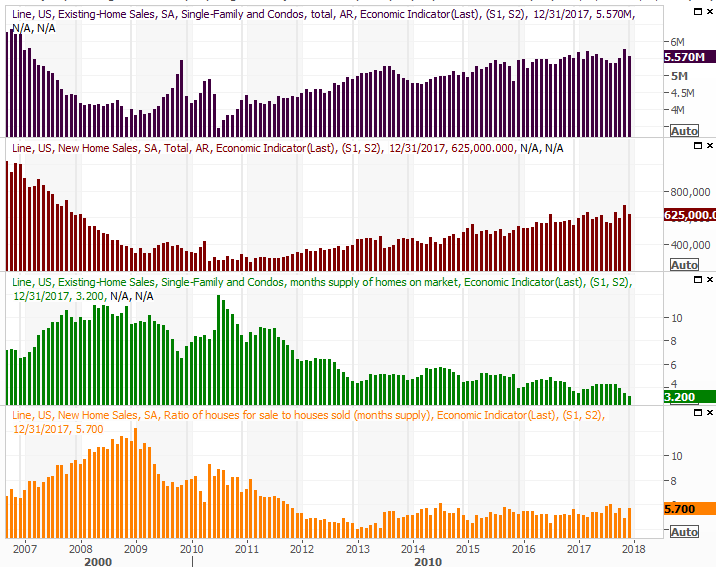
Source: Thomson Reuters Eikon
Bear in mind, however, that November's activity made for an unusually strong comparison, perhaps prompted by then-proposed changes in the deductibility of mortgage interest from taxes due, and maybe spurred by relocations after two devastating hurricanes just a couple of months earlier. A lack of inventory may still be holding purchases down as well.
Crude oil stockpile levels continued to dwindle - a trend we predicted would persist weeks ago. That said, though we anticipate that supplies will continue to fade to reflect the capacity many drillers and explorers shuttered months ago, the pace of the decline should start to slow soon. At that point, the oil price rally should start to level off, if not pull back.
Crude Oil and Natural Gas Inventory Charts
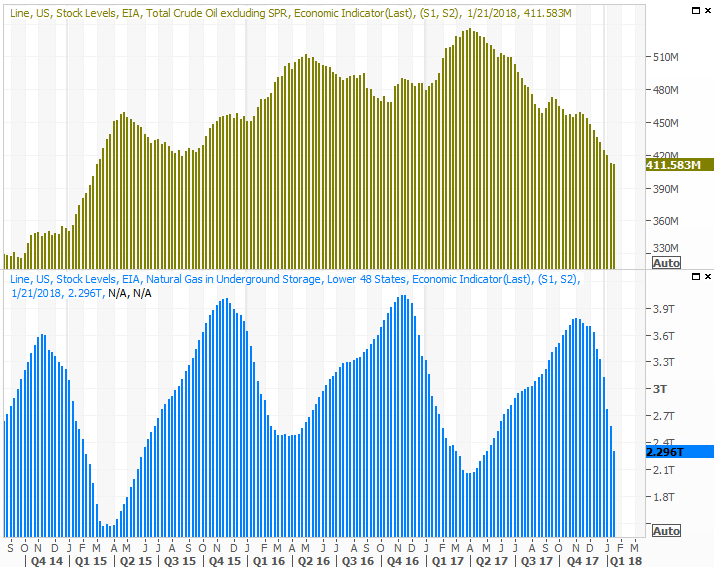
Source: Thomson Reuters Eikon
As for Q4's GDP growth pace, the advance of 2.6% was not only short of the expected 2.9%, but down from Q2's and Q3's. It's superficially disappointing, but know that a large degree of imports worked the GDP figure lower. In terms of economic activity in the United States, that figure of 2.6% may slightly understate the nation's actual economic activity.
GDP Growth Charts
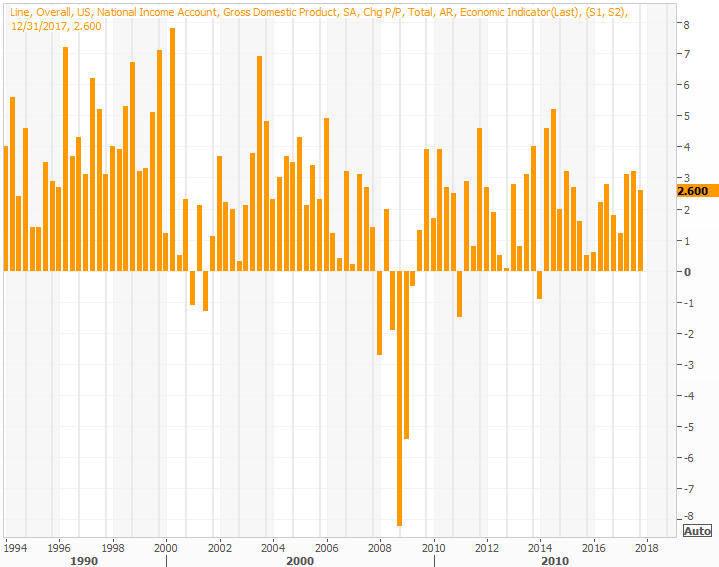
Source: Thomson Reuters Eikon
Everything else is on the grid.
Economic Calendar
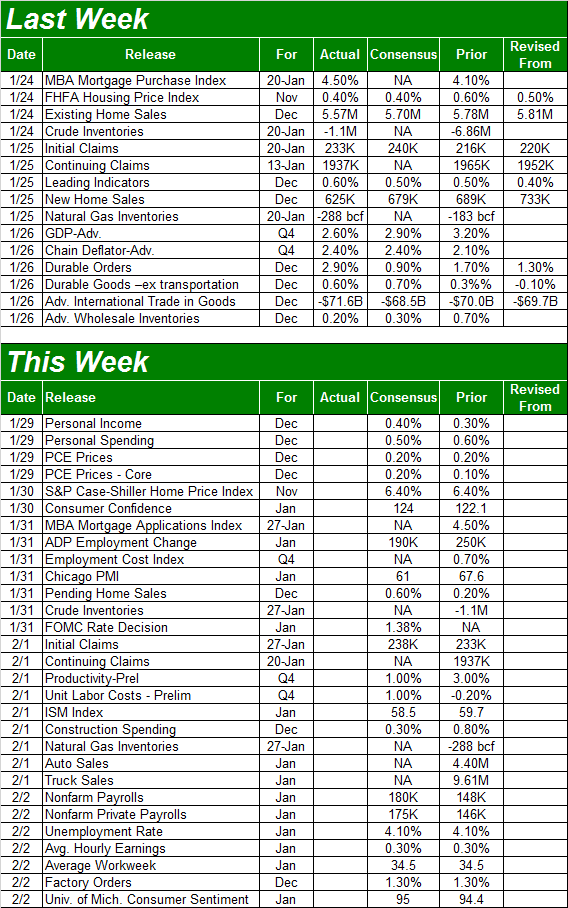
Source: Briefing.com
This week is going to be overwhelmingly busier, starting with Tuesday's consumer confidence figure from the Conference Board. We heard last week that January's second reading of sentiment - as measured by the Michigan Sentiment Index - was 94.4 (down from December's 95.9), though we'll get the third and final reading at the end of this week. Whatever's in the cards for the month, there's no way of saying consumers aren't generally feeling better and better, in step with economic and corporate profit growth.
Consumer Sentiment Charts
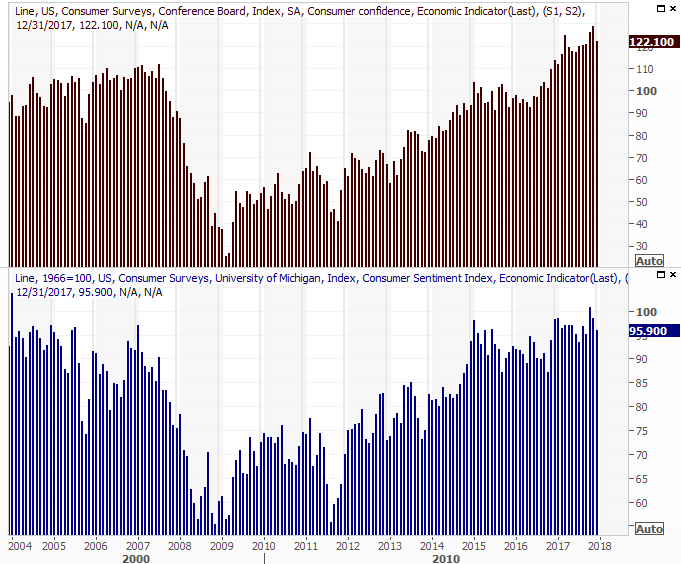
Source: Thomson Reuters Eikon
On Tuesday we'll get January's total auto sales. You'll recall they were in a downtrend until immediately after hurricanes Harvey and Irma, which prompted strong sales for the next three months as reimbursement checks started to show up. It remains to be seen, however, how long that upside will last. We suspect not much longer, if longer at all.
Auto Sales Charts
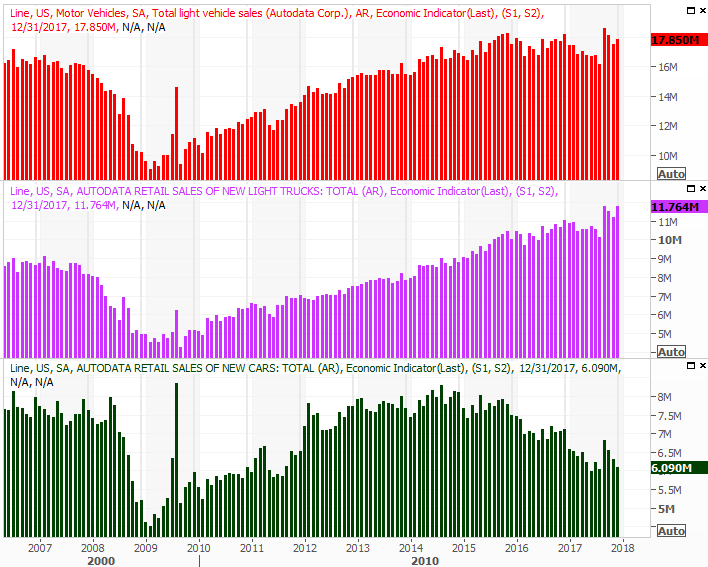
Source: Thomson Reuters Eikon
There's no chart for it, but bear in mind the FOMC will be making an interest rate decision on Wednesday. Though the consensus is that we'll see three rate hikes this year, nobody really expects this to be one of them.
The big Kahuna, of course, will be Friday's look at the January's employment report. Though we added 148,000 new jobs (net) in December, that wasn't quite enough to push the unemployment rate lower than November's 4.1%. Then again, that level of unemployment is about a structurally and mathematically low as we can go.
Unemployment Rate, Payroll Growth Charts
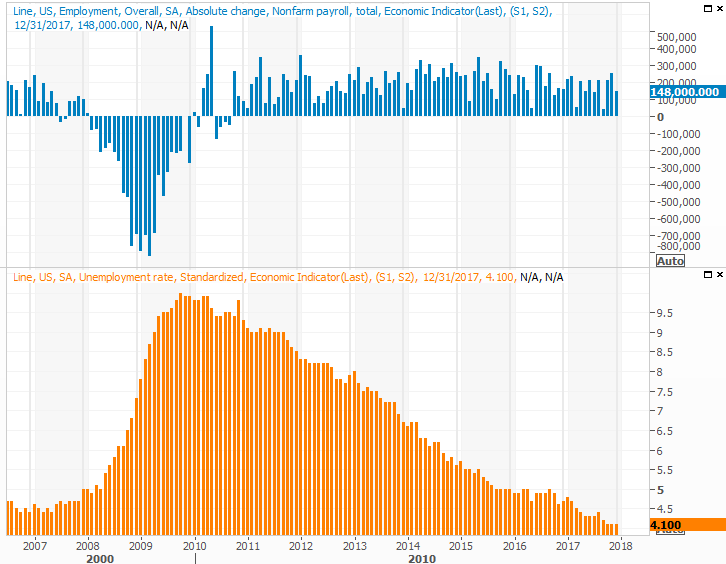
Source: Thomson Reuters Eikon
Index Analysis
Amazing. Just amazing. There's no other way of saying what the market is doing here. Stocks are off to the best start to a new year they've seen in decades, with the S&P 500 up 7.4% since the end of 2016. Even more amazing is that, as of Friday, the rally is still accelerating.
S&P 500 Daily Chart, with VIX and Volume
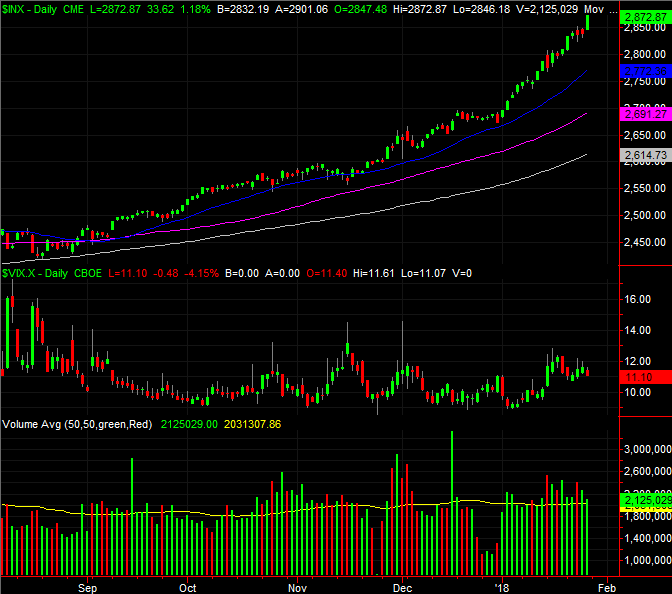
Source: TradeStation
It's daunting to be sure, but until anyone is willing to start taking profits and stand in front of the train (which means overcoming the fear of missing out), the downside risk is nothing more than just that... a risk, rather than a reality.
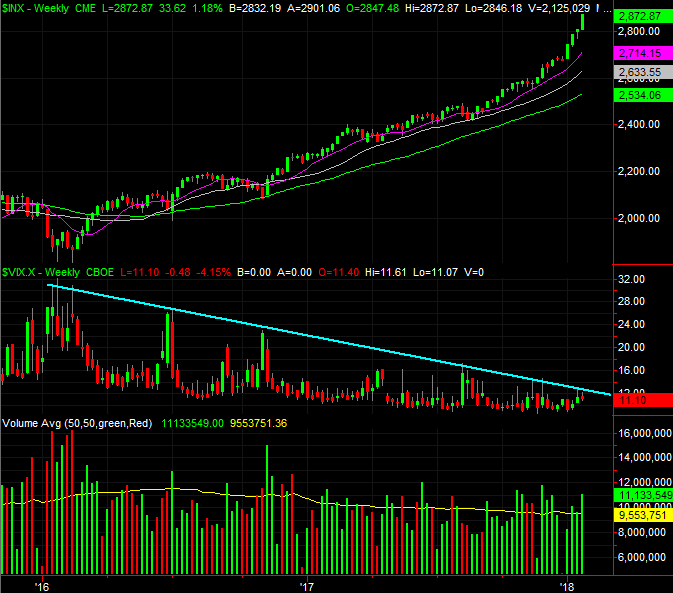
Zooming out to a weekly chart of the S&P 500 doesn't tell us anything new, but it does put the whole thing in perspective. Not only have we made the longest streak without a 3% correction the index has ever enjoyed, it's moved well beyond the normal pace of gains. This looks like a setup for some profit-taking, regardless of "value."
S&P 500 Weekly Chart, with VIX and Volume
Source: TradeStation
There's something else helpful that pops up on the weekly chart though. It's on that graphic we can once again see that the VIX has been pressured lower by a falling resistance line that extends all the way back to the peak from early 2016. Until it breaks the market can - and likely will - keep chugging. If and when the VIX's technical ceiling is broken though (in a manner that's built to last), that may well be the sign that stocks are in trouble and will finally dish out the first meaningful correction in months.
Thing is, that may be the only sign that stocks are finally tipping over in a way that merits action... and even then we'd struggle to trust such a move would really go anywhere.
For the record, if-and-when the market does start to crumble, the moving average lines on the charts above will be the make-or-break lines to watch. There's no other context to work with here as we venture deeper into uncharted waters.
The toughest parting about playing this game of chicken - and that's what this really is - is knowing when to flinch. That's the quirky part about this meltup currently underway.