Weekly Market Outlook - Is This Conviction or Are We Just Unrealistically Optimistic?
Against the odds, stocks managed to reverse the weakness from a couple weeks ago and log a gain last week. In fact, most of the major indices ended the week at all-time record highs, looking for more.
 It's certainly a good sign, even if the bullishness is playing out at a time of year -- the month of September -- when it shouldn't be; this month is usually a loser. And, interestingly (and maybe alarmingly), traders don't have much trepidation about buying into an overbought and overvalued market. That confidence, of course, could come back to haunt all the new bulls.
We'll take a closer look at that red flag below, right after we slice and dice last week's and this week's economic news.
Economic Data
Last week was an average week in terms of the amount of economic news we got, but the importance of some of the reports was sky-high. Problem: The commerce shut-downs caused by hurricane Harvey may have skewed all of it. Take all the numbers with a grain of salt. That said...
If you were worried about a lack of inflation (or waning inflation), don't. It perked about again last month, for consumers as well as companies. The annualized consumer inflation rate stands at 1.94%, up a bit from July's level, which was up a bit from June's reading. Though still 'tame' in the grand scheme of things, the odds of a rate hike from the Fed edged a little higher. Traders are now betting -- mostly -- on a December rate hike of 0.25 basis points. They're pricing in a 55% chance of an increase then.
Producer and Consumer Inflation Charts
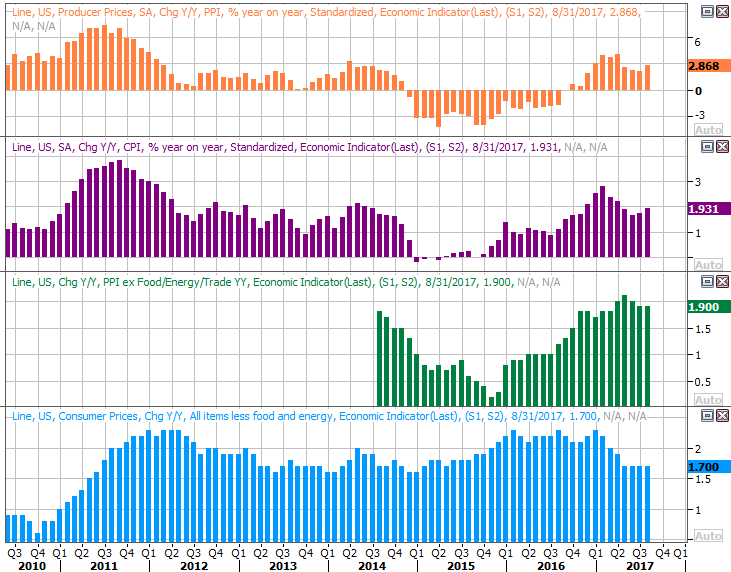
Source: Thomson Reuters Eikon
We also got August's retail sales data last week. It wasn't exactly fantastic, falling 0.2% overall, but only gaining 0.2% when taking auto sales out of the equation. Nevertheless, aside from the impact of Harvey (which can be good in some ways too... ask Lowe's), the more relevant year-over-year comparisons are still showing strong progress.
Retail Sales Growth Charts
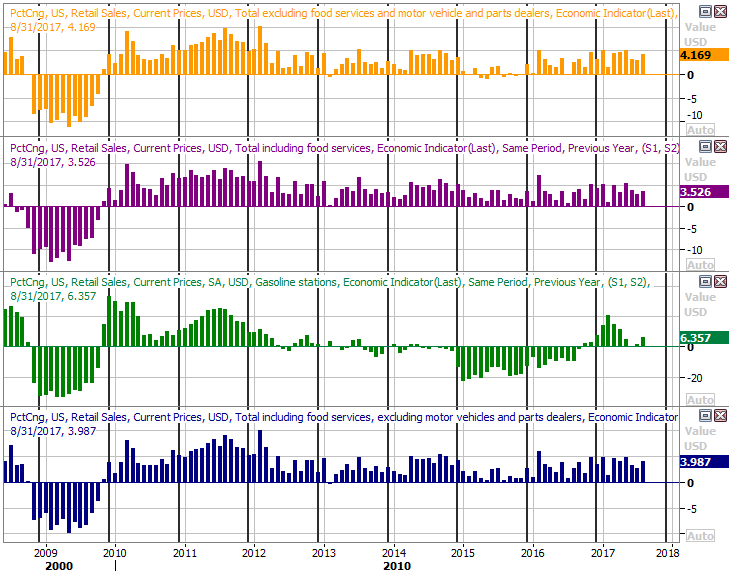
Source: Thomson Reuters Eikon
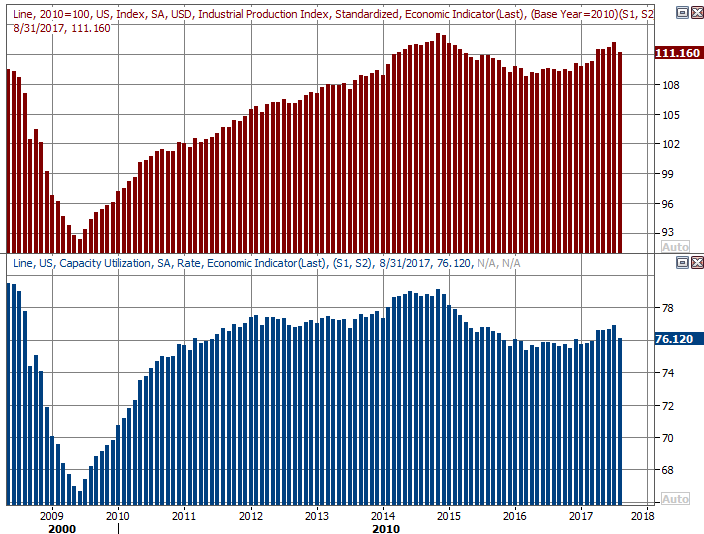
Finally, last month's capacity utilization and industrial productivity both fell, but again, we know the approach of Harvey may have had a great deal to do with it.
Capacity Utilization and Industrial Productivity Charts
Source: Thomson Reuters Eikon
Either way, we're seeing a broad degree of improvement here, and have been since . One month doesn't make or break that bigger-picture move. If it turns into three or four months though (and we don't think it will), that's when we worry.
Everything else is on the grid.
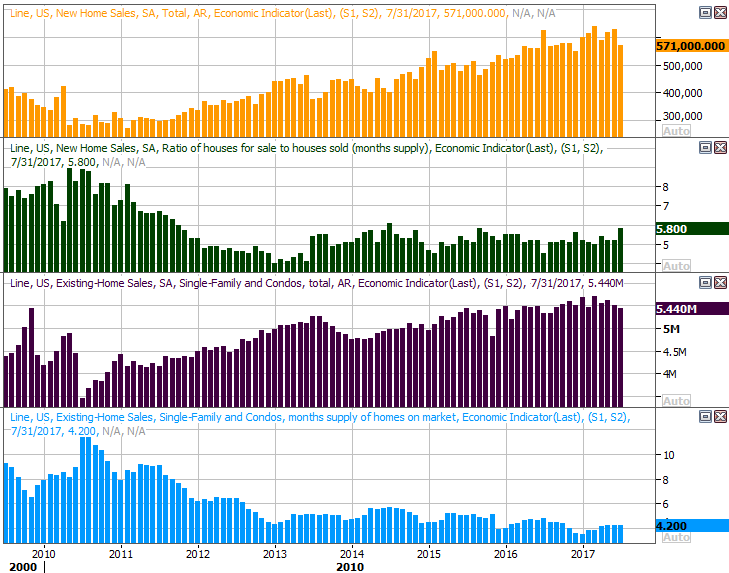
Economic Calendar
Source: Briefing.com
This week is going to be relatively busy as well, particularly for real estate and homebuilding stocks.
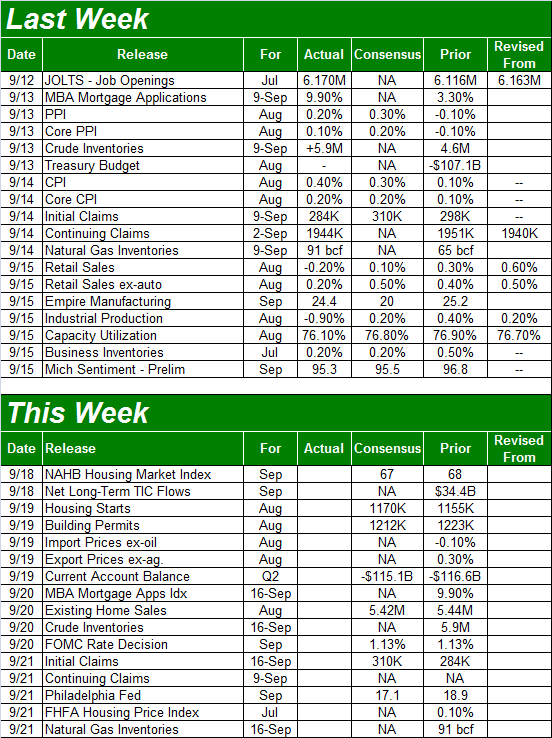
The balls gets rolling on Tuesday with September's housing starts and building permits, which should more or less be in line with July's levels. Though one flat month isn't the end of the world, this has become more than one month's worth of stagnation.
Housing Starts and Building Permits Charts
Source: Thomson Reuters Eikon
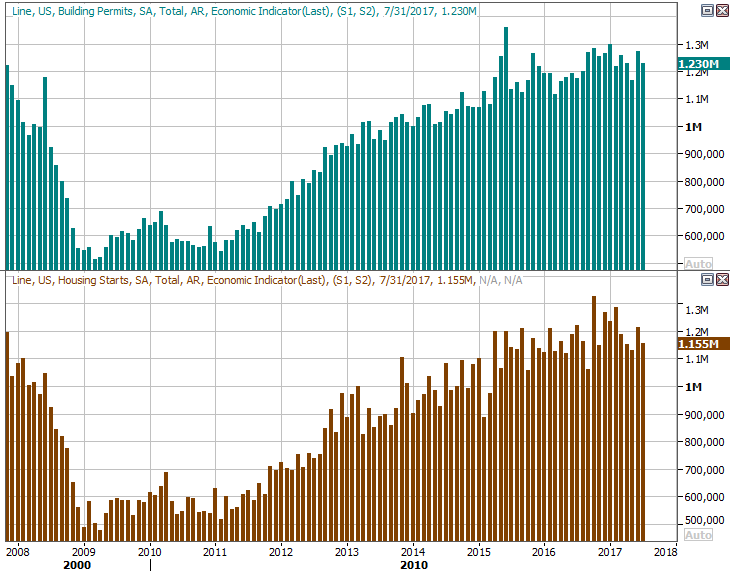
On Wednesday we'll hear about last month's existing home sales, though we won't get August's new home sales figure until next week. Whatever the case, we certainly could use some help here after a rough July. Some of the blame for the tepidness was a lack of inventory, but that excuse rings a little hollow. There was an inventory surge of new homes in July, and we've been selling a fair amount of existing homes (until the past couple of months) with no less inventory than we have now.
New and Existing Home Sales Charts
Source: Thomson Reuters Eikon
Bear in mind the starts/permits data plays a factor in next week's new home sales report, and indirectly even plays a part in existing home sales figures.
Of course, the highlight will be Wednesday's interest rate decision from the FOMC. The odds suggest there will be no rate hike, but the Fed's verbiage will be interesting all the same.
Index Analysis
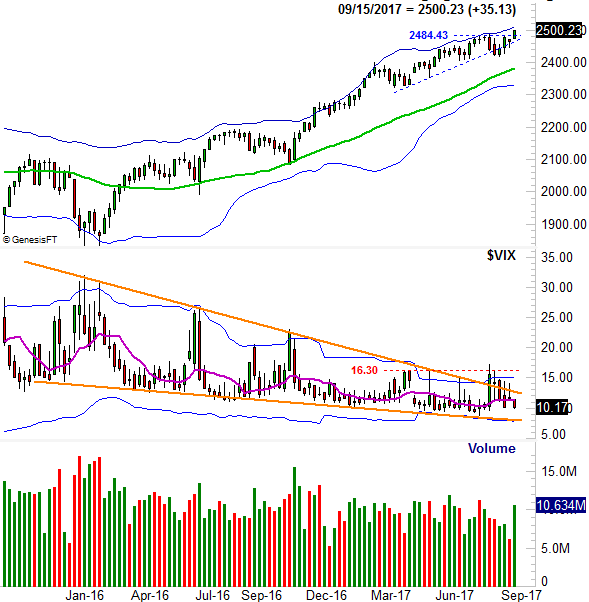
Against the odds, and in defiance of the calendar, something motivated the market to all-time highs last week. More interesting is how the Friday surge that got the S&P 500 over the hump that was developing in the middle of the week unfurled on suspiciously high volume. The VIX also traveled to a multi-week low, suggesting there's little doubt about the market's uptrend being sustained.
S&P 500 Daily Chart
Source: TradeNavigator
If that bugs you, that's because it should bug you.
That's not to say the market won't continue to higher anyway. Indeed, stocks have been defying the odds for months now. This is now the second-longest stretch for the market without a 3% correction... now around 220 days. That's crazy, but no crazier than the fact that the last time we had the all-important 10% correction was in February of last year.
The weekly chart of the S&P 500 puts everything in perspective.
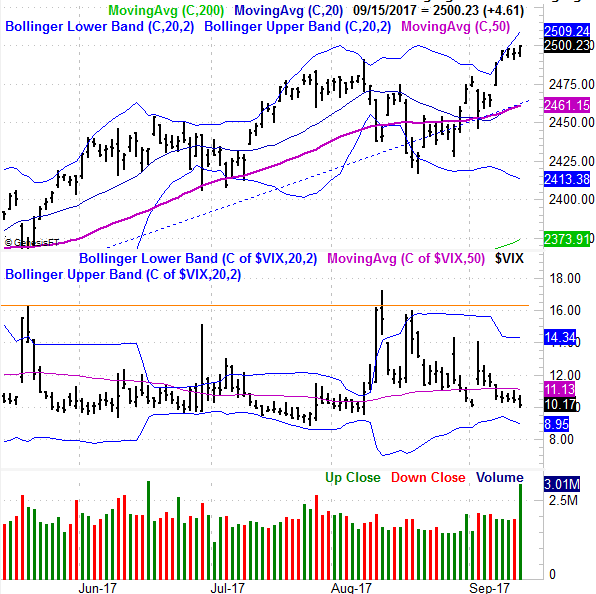
S&P 500 Weekly Chart
Source: TradeNavigator
The VIX technically has room to move lower before reaching the lower edge of that falling converging wedge (orange), leaving the door open to the possibility of stocks being allowed to move higher.
Interestingly -- and this may be even more telling than it seems on the surface -- the NASDAQ Composite failed to clear a key technical hurdle at 6461 last week despite the gain. Maybe it doesn't matter yet, especially in light of the fact that the VXN broke below a key support level of its own... investors have little doubt about the market being able to make further upside. Of course, that degree of optimism could be a major red flag in itself. (If only the market were behaving rationally right now!)
NASDAQ Composite Weekly Chart
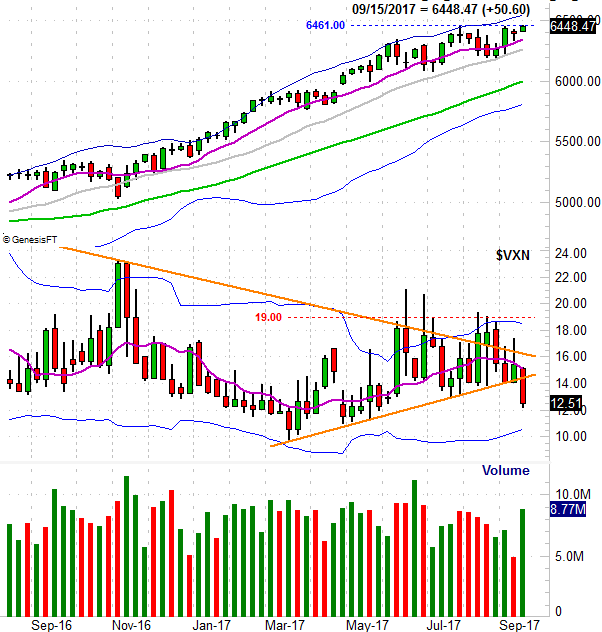
Source: TradeNavigator
This is, almost needless to say, an annoying conundrum. The trend is your friend, so we want to follow this bullishness as long as that's the direction the undertow is pointed. There's something unrealistic about this bullishness though.
This might put things in perspective, particularly with the third quarter's earnings season just around the corner -- the S&P 500 is trading at an estimated (factoring in Q3's earnings projection) trailing P/E of 27.1. The forward-looking P/E of 17.7 is a little more palatable, but not necessarily trustworthy. The same pros that are projecting per-share profits of $140.98 for the S&P 500 for the next four quarters were also the same pros that were at one time expecting a per-share profit of $133 for 2017. It's only on pace to earn $127 this year.
Point being, the earnings growth projected for next year may or may not become a reality.
Whatever the case, until the S&P 500 breaks under its 50-day moving average line at 2461 and/or the NASDAQ Composite pulls under its 100-day moving average line currently at 6247, there's no reason to entertain the bearish likelihood.