Weekly Market Outlook - Indecision (Still) Abounds
 It was an all-too-familiar refrain. Stocks drop hints that they're finally ready to roll higher in earnest, and just when it looks like they're moving, they rollover. The S&P 500 basically broke even last week, and ended the week pointed lower.
It's not the end of the world. The market is taking two steps forward for every one step back. It's progress. It's such slow progress, however, that investors may be ready to head to the sidelines for a while.
One of these times, though, the market's not going to catch itself before a small pullback turns into a big one.
We'll look at the whole shebang below (as always), but first let's review last week's economic news and preview this week's economic announcements.
Economic Data
Though most eyes were on earnings reports last week, there were a trio of economic data reports worth a look.
The party started early on Monday with a look at June's retail sales. The pros thought they would grow nicely, and they did. With cars, consumer purchases were up 0.5% month-to-month, and stripping automobile sales out of the picture retail consumption was up 0.4%. On an annualized basis, consumerism is not only up, it's accelerating as people increasingly let go of their recent pay raises.
Retail Sales Charts
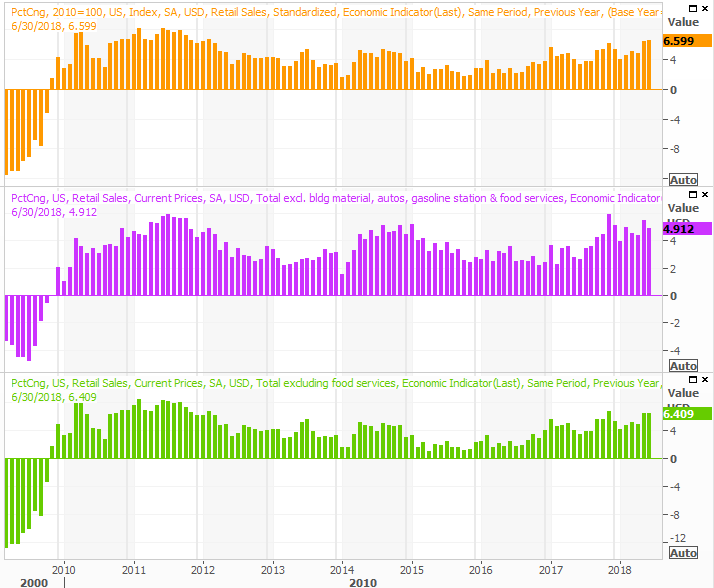
Source: Thomson Reuters
The Federal Reserve's capacity utilization and industrial activity report on Tuesday was similarly compelling, even if capacity utilization wasn't quite as firm as expected. It still improved from 77.7% to 78.0%, while industrial production was up 0.6% after sliding 0.5% lower in May. Both continue to trend higher quite nicely.
Industrial Productivity and Capacity Utilization Charts
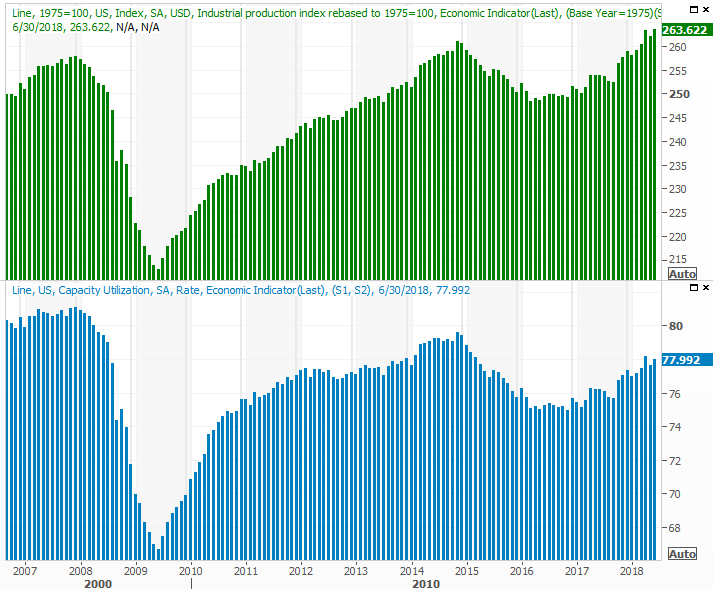
Source: Thomson Reuters
Finally, on Wednesday we got June's housing starts and building permits numbers. They weren't good. They weren't awful, but this is a metric where we needed to see a revival, and we got anything but. Starts fell from 1.337 million to 1.173 million, and permits fell from 1.301 million to 1.273 million.
Housing Starts and Building Permits Charts
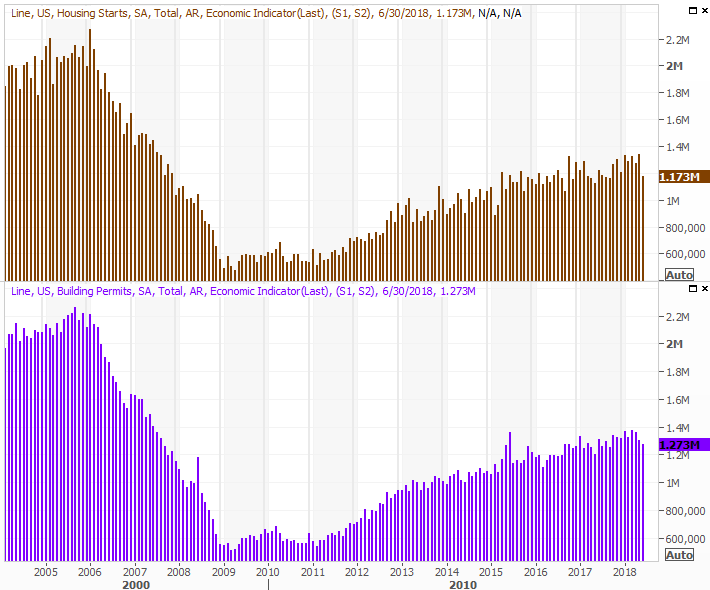
Source: Thomson Reuters
Everything else is on the grid.
Economic Calendar
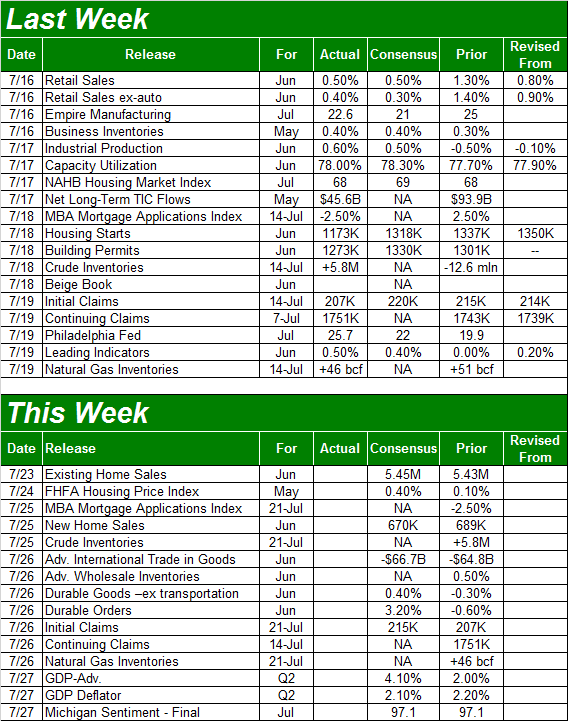
Source: Briefing.com
The housing market will get a chance to at least partially redeem itself this week.
Last month's existing home sales report will be posted on Monday, followed by Wednesday's new home sales announcement. In light of the sudden dip in starts and permits, we'll also be curious to see what the housing inventory situation looks like. They're still scarce by historical standards, but have perked up a bit in recent months. Is it possible builders are afraid of overproducing like they did in 2007, and are retreating before we even get close to a repeat of that debacle. [Or, maybe it's a lack of absolute inventory that's holding home sales back.]
Economists are more or less looking for sales numbers like the ones we saw for May.
Existing and New Home Sales Charts
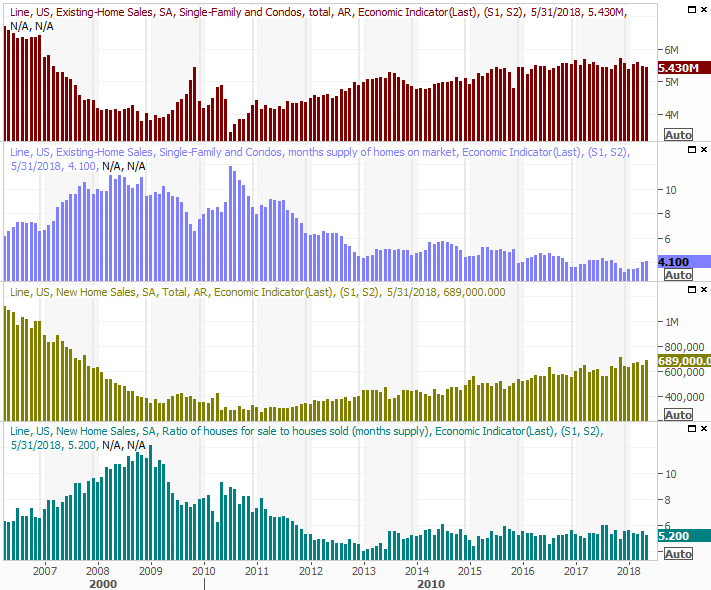
Source: Thomson Reuters
Notice we'll also hear from the FHFA about home prices on Tuesday, augmenting the bigger real estate outlook.
On Friday we'll hear the first (of three) estimates about Q2's GDP growth rate. The consensus is forward progress of 4.1%. It's a big number, and not just big because the year-ago comparison is weak. The economy really has been accelerating that much.
Quarterly (Annualized) GDP Growth Charts
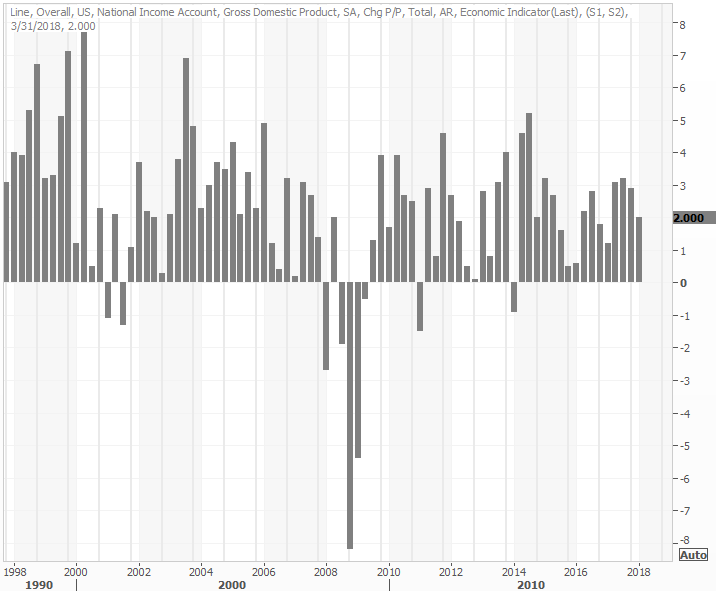
Source: Thomson Reuters
Notice we'll get the third and final Michigan Sentiment Index reading on Friday, but we're going to hold off on looking at it until next week when we get July's consumer confidence score from the Conference Board. Both have been in broad uptrends, however, and we don't foresee any changes to this trend this month.
Index Analysis
Last week we cautioned that the NASDAQ Composite was approaching a technical resistance level that could quell the rally. Sure enough (and almost as if scripted), the index kissed that ceiling, and started to peel back. It's not yet in a full-blown downtrend, but the precision with which the rally started to roll over it telling.
NASDAQ Composite Daily Chart, with VXN and Volume
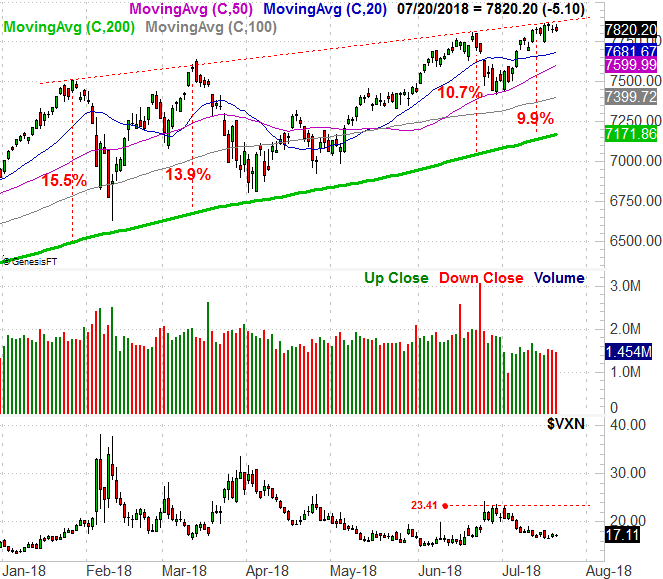
Source: TradeNavigator
A couple of lower lows from the NASDAQ this week could get that selloff move started in earnest.
Ditto for the S&P 500. Though it didn't start to weaken at a clear technical ceiling last week, it's still clearly weakening. It ended the week with a nearly-imperceptible gain, and the weekly doji bar suggests a pivot out of an uptrend unto a downtrend is possible.
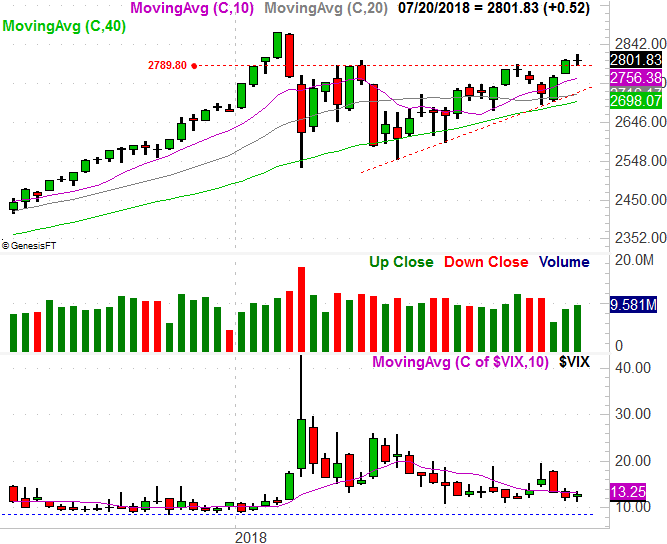
S&P 500 Weekly Chart, with VIX and Volume
Source: TradeNavigator
Now, drill down deeper into the daily chart of the S&P 500 (below). We've even stripped out all of the Bollinger bands and moving average lines - except for the 200-day moving average line - so we could clearly see the fairly well-defined channel that's framed the S&P 500's action going back to April's low. As was noted above, the upper edge of that zone wasn't even tested last week before the market started to weaken. The broad premise still stands though... this is still a back-and-forth game. The market is no stranger to lulls, and there's no particular reason we'll sidestep the trend this time around.
S&P 500 Daily Chart, with VIX and Volume
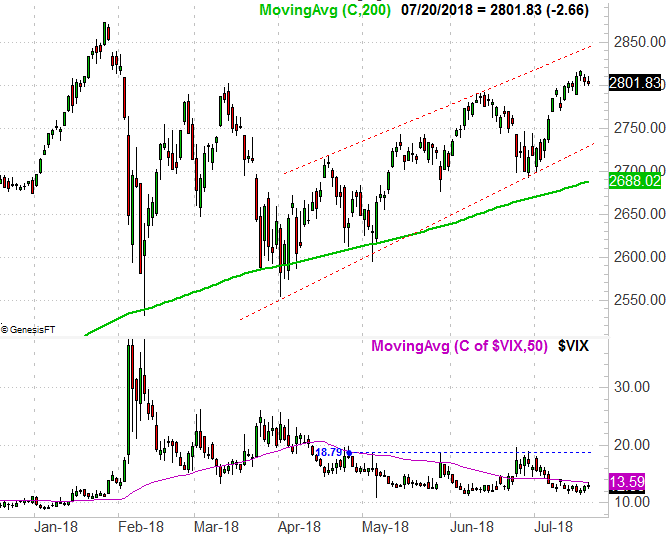
Source: TradeNavigator
Also know that while this July has been unusually bullish, the move only gets the market back to where it would normally be by this point in the year. And, not only is August a dead month for the market, it leads into a losing month of September.
That's a two-month span though, and doesn't necessarily have to mean the market's going to weaken and pull back right away.
S&P 500 YTD Gain vs. Average
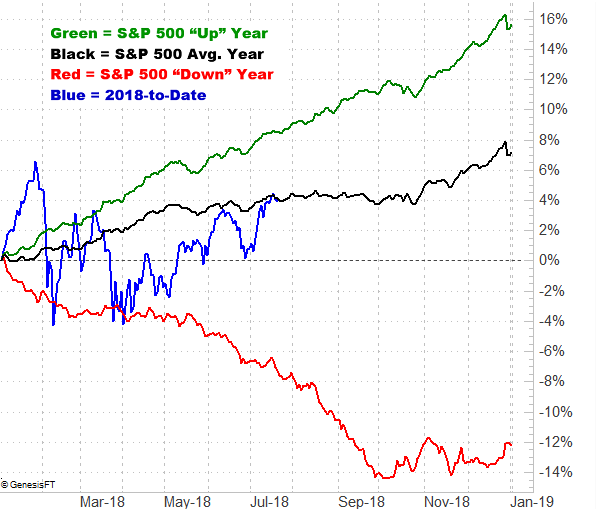
Source: TradeNavigator
The point is, we have to assume we're still in a market environment that's prone to mild reversals, rooted in indecision.
Whatever the case, we're not going to worry about anything until we see two very specific things happen. One of them is the S&P 500 breaking below the lower edge of the channel that's been guiding it higher since April. The other is the VIX breaking above its recent ceiling at 18.8. There's a pretty good chance both would happen right around the same time. Anything less, and we'll just plan on more meandering.