Weekly Market Outlook - Hurdles Ahead But We've Got the Speed We Need
 When the year-end rally fizzled out early this year, and then completely shattered on Thursday, investors were understandably concerned. When push came to shove as the week came to a close though, it was the bulls doing all the shoving. Ignoring the risks, the buyers drove the S&P 500 up by a whopping 3.4% on Friday, leaving the index at its best close in two weeks. The reversal is in respectable, even if not rock-solid, footing.
Better still, other clues point to more bullishness ahead... as long as politicians are able to stay out of the way.
We'll look at the reversal effort below. First, however, let's recap last week's economic news, which included a surprisingly encouraging jobs report for December.
Economic Data Analysis
The holiday further reduced the already limited number of economic announcements to sift through last week, but a handful of the ones we heard were hard-hitting.
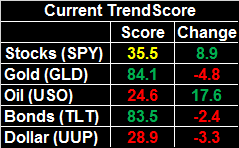
The party started in earnest on Thursday, with last month's ISM Manufacturing Index rolling in notably lower than expected. The measure fell to a multi-month low of 54.3.
ISM Index Charts
Source: Thomson Reuters
It's reason for concern, though not a reason to overreact just yet. The lull may be the result of a combination of factors like seasonality, weather and politics, most of which are transient. Manufacturing data outside of the ISM circle actually still shows respectable strength. Hiring within the manufacturing sector, for instance, remains quite firm.
This week's ISM non-manufacturing index report may round out the look at the economy through this lens. The pros are calling for a slight December lull, but the index is still at robust levels.
Also on Thursday we heard about December's automobile sales. Not bad. They didn't lurch forward, but the annualized pace of 17.55 million is steady with the readings seen for the prior couple of months.
Automobile Sales Charts

Source: Thomson Reuters
It may have been a year-end sales push, and we may still be seeing the benefit of insured replacements related a rough hurricane season. As it stands right now, however, automobile demand is decent even if not red hot.
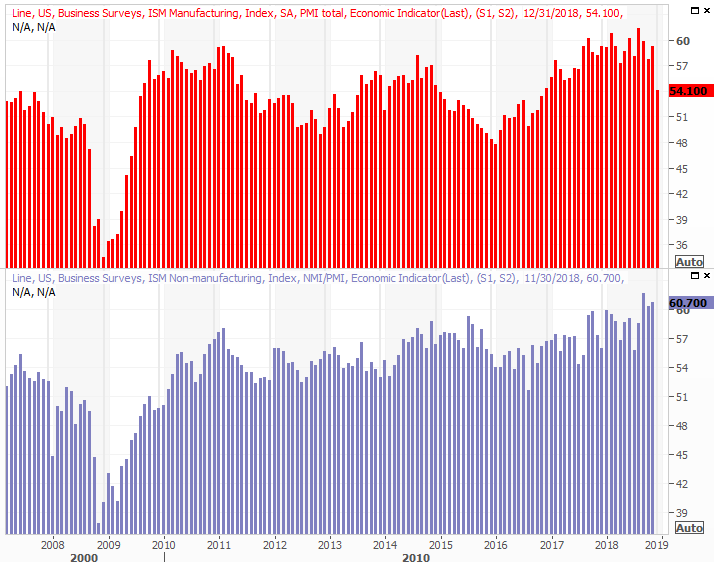
Last week's big Kahuna, of course, was the December jobs report. The 312,000 new jobs created last month was impressive, but confused by the increase in the unemployment rate from 3.7% to 3.9%.
Unemployment Rate, Job Growth Charts
Source: Thomson Reuters
We've got a fully-detailed analysis of the jobs report posted at the website, which we gave a grade of A-. Check it out here: https://www.bigtrends.com/education/markets/jobs-report-decembers-rising-unemployment-rate-isnt-a-concern
Everything else is on the grid.
Economic Calendar
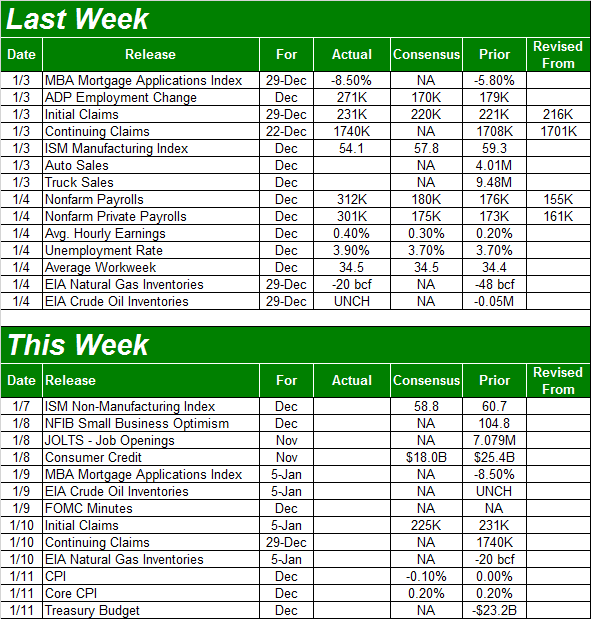
Source: Briefing.com
This week is going to be relatively tame. Aside from the ISM Services Index, on Wednesday look for the minutes from the most recent meeting of the Federal Reserve's governors. It won't involve a decision about rate hikes, but it will shed some light on what and how the Fed is thinking here.
On Friday we'll get half of the look at last month's inflation picture, with the consumer inflation report. As of the latest look the annualized inflation rate stands at 2.2%, on a core and non-core basis. More than that though, it seems to be abating, and economists are looking for more easing for December. The FOMC need not be in any big hurry.
Annualized Inflation Charts
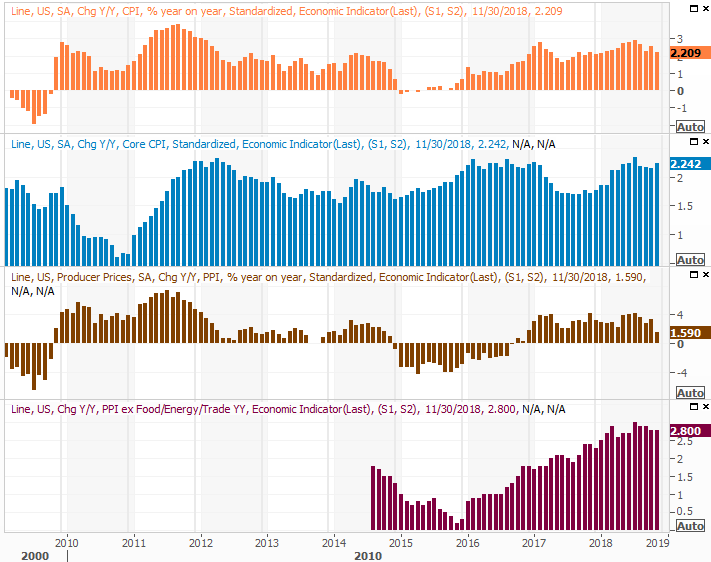
Source: Thomson Reuters
The producer price inflation data will be posted next week, they we've seen more slack on that front than on the consumer front.
Stock Market Index Analysis
We mentioned a couple of weeks ago that the steep selloff offered hints of a capitulation... even if artificially driven. That idea holds a little more water after last week.
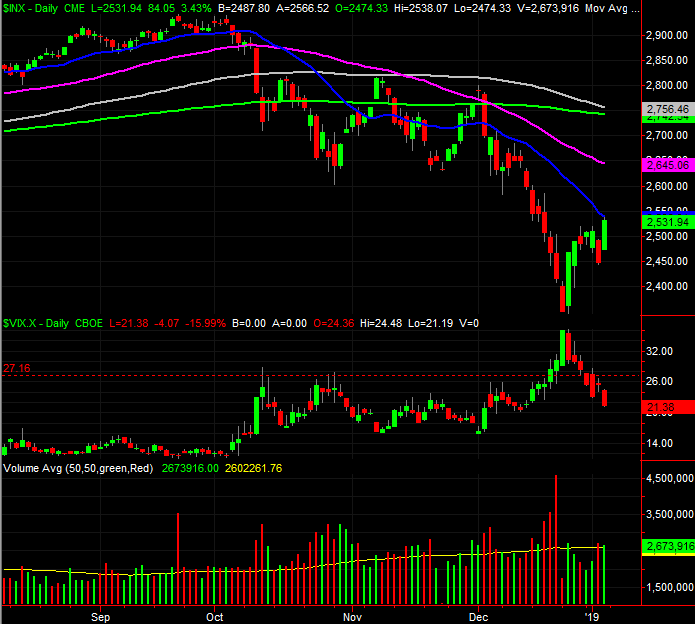
Stocks still aren't over the proverbial hump. In fact, after last week's 1.8% advance following the previous week's 2.8% advance, there's fair amount of profit-taking potential on the table. Notice on the daily chart of the S&P 500 that the index approached the 20-day moving average line (blue) without actually pushing past it. Maybe there wasn't enough gas left in the tank this go around.
S&P 500 Daily Chart, with Volume
Source: TradeStation
Still, you have to like the follow-through on the rebound effort, along with the fact that the bulls didn't scurry away after Thursday's harrowing selloff. You also have to like how Friday's "up" volume was about as solid as Thursday's volume. For that matter, notice on the weekly chart's VIX made a decided peak - and eclipsed the ceiling around 30 - and is now back in a firm downtrend with lots of room to keep running lower.
S&P 500 Weekly Chart, with Volume
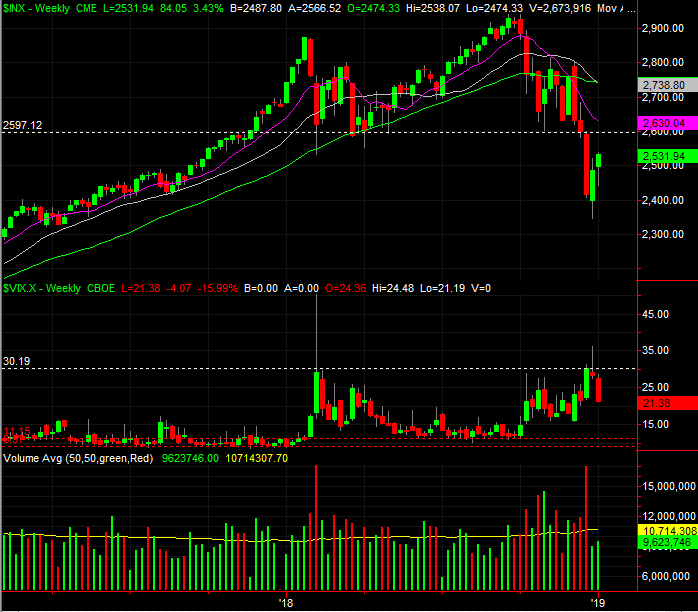
Source: TradeStation
The NASDAQ's Volatility Index, the VXN, is sending an even more bullish message. It hit a major peak around 38 two weeks ago, and started a decided downward move this past week. Like the VIX, it's got room to keep falling - even more than the VIX does - giving the rally some breathing room.
NASDAQ Composite Weekly Chart, with Volume
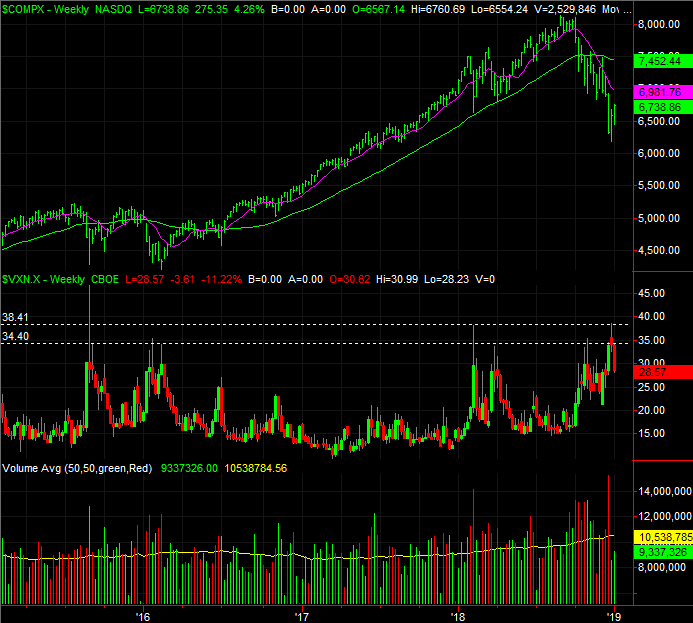
Source: TradeStation
So what is all of this collectively telling us?
Be careful about jumping to any conclusions here. As crazy as the early December meltdown was, it would be naive to think the response can't be just as crazy. Tensions are still high. Common sense and reason are scarce. Too many traders are only willing to take their cues from each day's new headlines, and they're overreacting when they do so. Anything can still happen here, and we're hardly out of the woods.
But, the undertow is currently a bullish one, and traders aren't quite as hysterical as they were just a few days ago.
We'll follow the momentum and assume the uptrend is going to last until we can't afford to think that any longer. However, until the S&P 500 and the NASDAQ at least push their way above their respective 20-day moving average lines, we're going to keep any bullish trades on a short least. In fact, we won't turn comfortably bullish until the indices are back above their 200-day moving average lines. The good news is, the S&P 500 will only need to gain another 9% to get there. It fell a little more than 20% from September's high to last month's low, so it would only need to retrace some of its steps to restore the uptrend seen for the better part of last year.
On the flipside, a move back under Thursday's low could easily turn into a problem. Investors aren't exactly giving stocks a lot of leeway here.
The steep selling is looking more and more like a garden variety correction. It had just been so long since traders have seen one, they overreacted when they saw it. A closer look at the economic data suggests there's no need or reason for a bear market yet.
Let's see if that's still the case on Wednesday, with the mid-week update.