Weekly Market Outlook - Friday's Recovery Leaves Stocks on the Fence
The market bounced back on Friday, rallying 1.3% from Thursday's close. But, it just wasn't enough. The S&P 500 ended the week down 4.8%, dealing the advance that got going in March a severe blow. It wasn't a death blow - the indices seem to have found support right where they needed to do so after it looked like they wouldn't on Thursday. But, Thursday's drubbing was so severe that more selling would have been surprising. The market's still on the fence.
We'll take a detailed look at the matter below, as always. First though, let's take a look at the big economic announcements made last week and the ones in the queue for this week. Traders are looking for direction wherever they can find it.
Economic Data Analysis
A relatively tame week, though a couple of biggies other than Wednesday's word from the Fed. Among the more noteworthy was the inflation data published earlier that same day. Consumer prices fell 0.1% in May following the 0.8% setback the month before. It's not so much demand-capacity as it is demand-capability - people are struggling to "do" commerce that keeps prices propped up. Interestingly, producers (factories and assembly plants) didn't get the same price break. Producer prices were up 0.4% compared to the 1.3% decline in April. Either way, it's encouraging that price pressure isn't completely deteriorating.
Inflation Charts
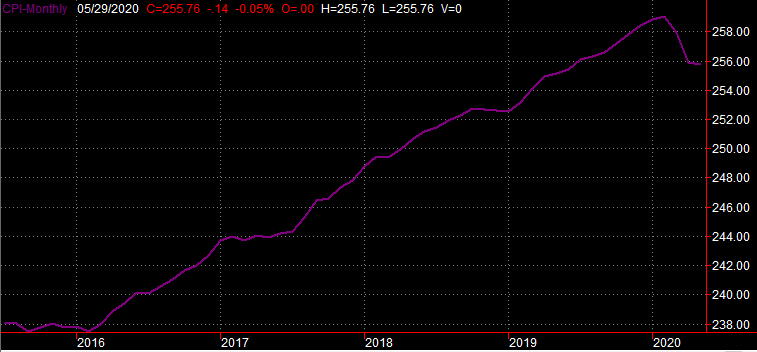
Source: TradeStation
The only other big data from last week worth mentioning was Friday's look - though not final look - at the University of Michigan Sentiment Index. It was up slightly from May's final reading of 72.3, suggesting consumers feel that things are at least stabilizing.
Sentiment Charts
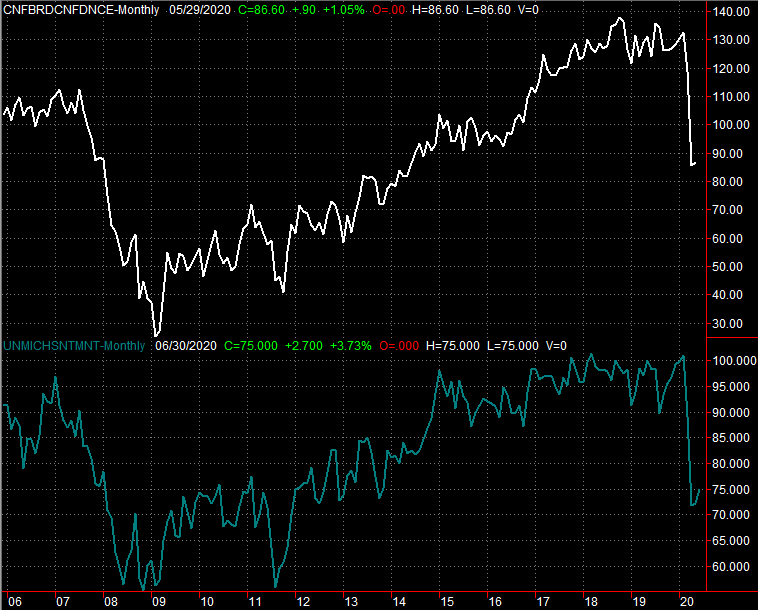
Source: TradeStation
Everything else is on the grid.
Economic Calendar
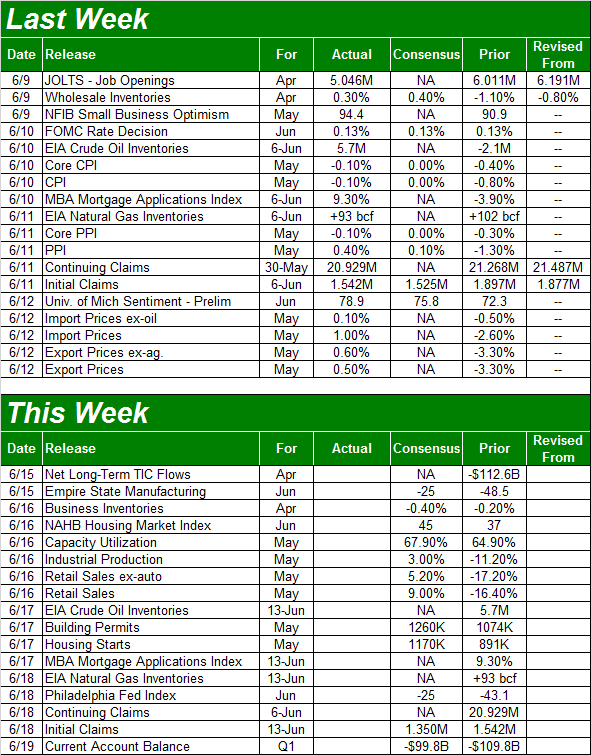
Source: Briefing.com
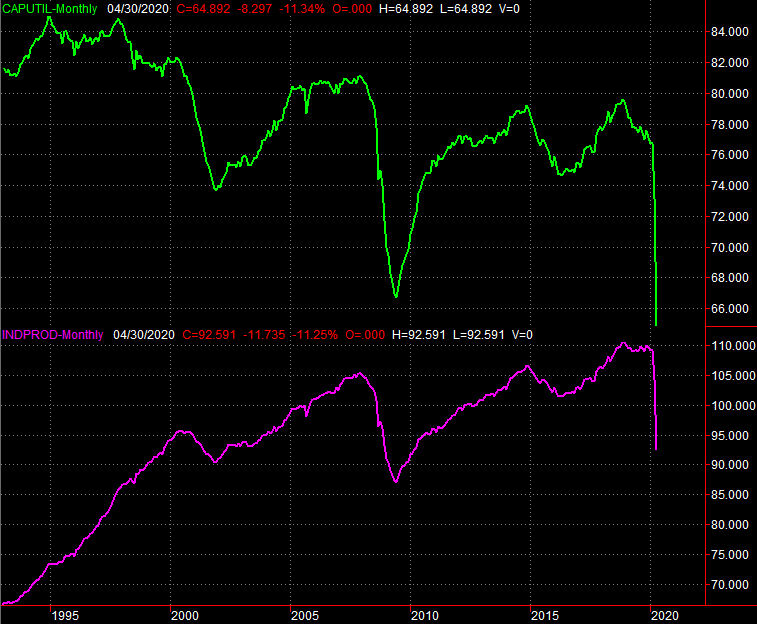
This week is going to be a little busier, starting with Tuesday's look at last month's capacity utilization and industrial production numbers. They've been horrendous, but the pros are calling for a slight improvement for May as people start to get back to work (and back to buying).
Capacity Utilization and Industrial Productivity Charts
Source: TradeStation
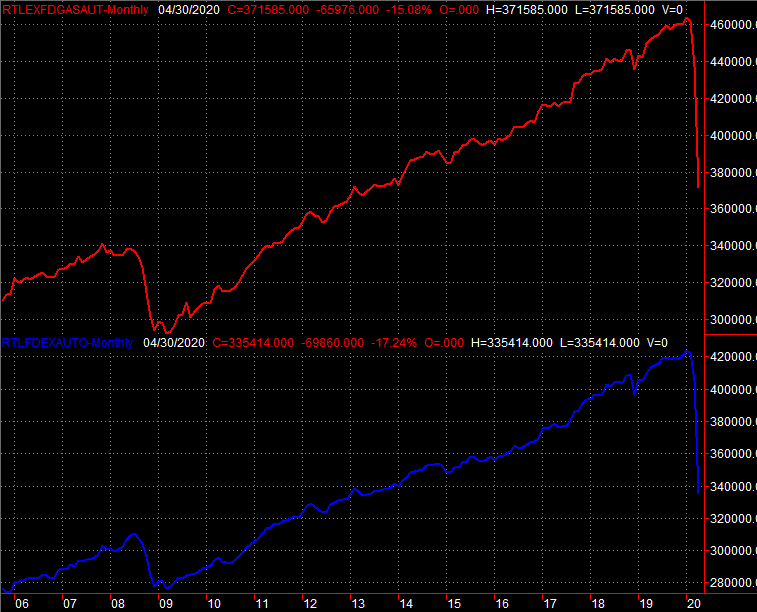
Ditto for retail sales for May, which will be posted on Tuesday as well. Economists are calling for a 4.5% uptick (not counting cars) following April's 17.2% plunge.
Retail Sales Charts
Source: TradeStation
On Wednesday look for May's housing starts and building permits, which like everything else should be better than April's suppressed results.
Housing Starts and Building Permits Charts

Source: TradeStation
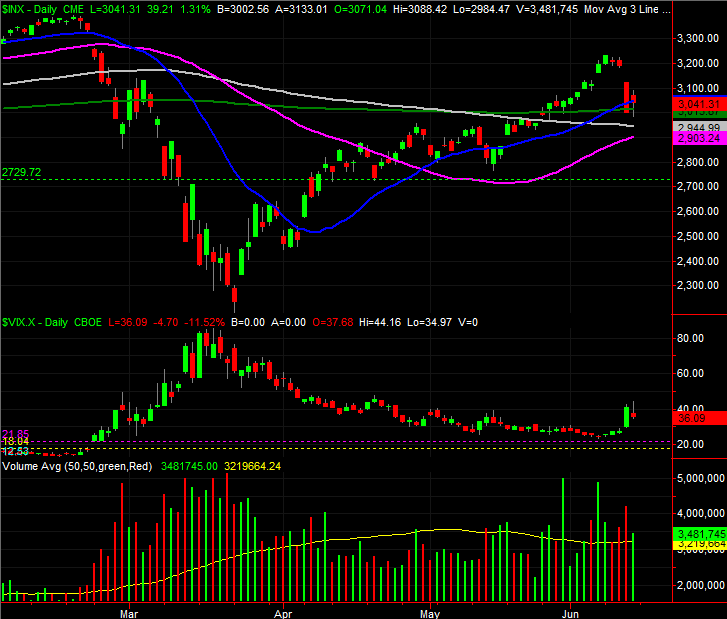
Stock Market Index Analysis
It's not the ideal scenario. But, all things considered, a glimmer of hope for the bulls started to shine on Friday after a rough Thursday.
The daily chart of the S&P 500 below tells the tale. On Thursday, the index broke below its 20-day and 200-day moving average line, suggesting stocks had been dealt a fatal blow. On Friday it became clear that may not have been the case. The 20-day and 200-day moving averages appeared to serve as support, preventing any further damage from being done. Thursday's opening bearish gap and the sheer size of the selloff may have been a contributing factor, but unlike February and March, at least the bulls were willing to make the effort.
S&P 500 Daily Chart, with VIX, Volume
Source: TradeStation
It wasn't the ideal outcome. Namely, there was modest bullish volume behind Friday's gain, and stocks didn't spend the whole day in the black - the bulls staged a late comeback. It still counts though.
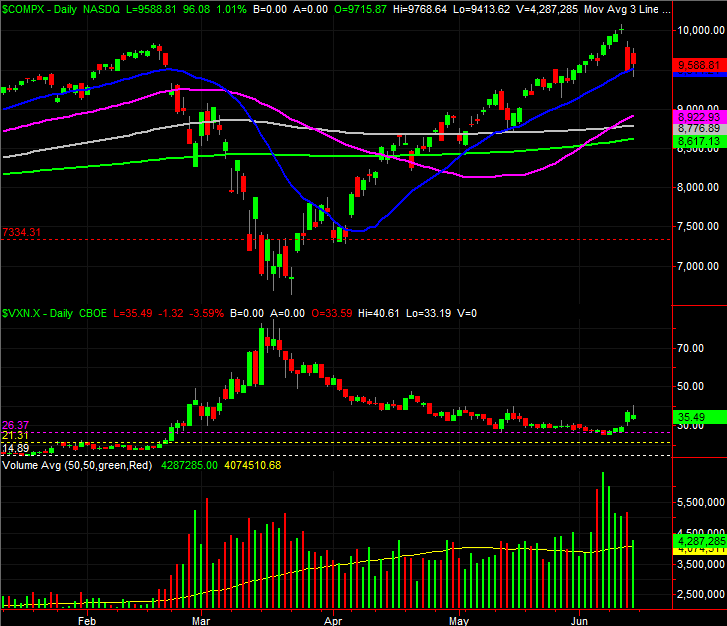
The NASDAQ Composite tells a similar but not identical story. Namely, the composite's 20-day moving average line (blue) held up as support on Thursday and then again on Friday.
NASDAQ Composite Daily Chart, with VIX, Volume
Source: TradeStation
Like the S&P 500, the NASDAQ has plenty of potential support underneath it. In this case the convergence of the 50, 100, and 200-day moving average lines around 8775 sets the stage for a technical floor coming into play; a slide back to that area would be a near-ideal corrective move that cleans the slate for another leg higher.
There are a couple of reason to worry that may not be what's in store, however. It requires a look at weekly charts to fully appreciate why.
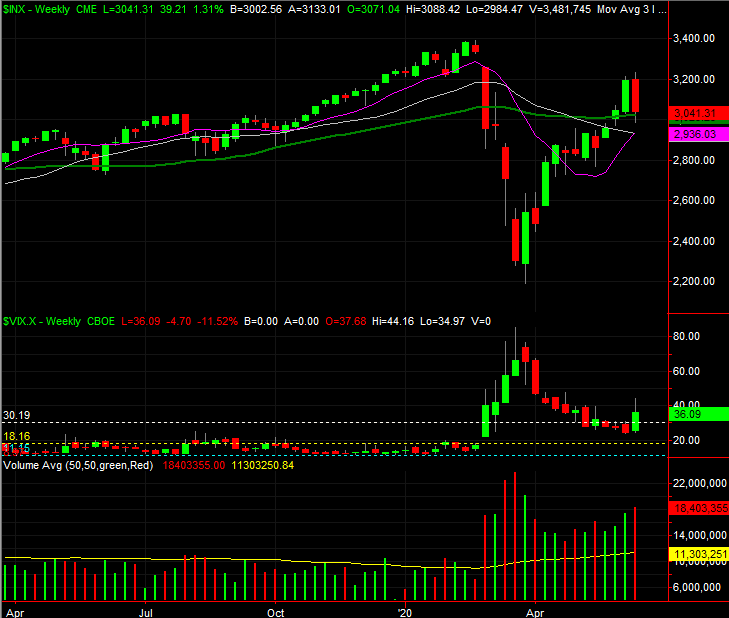
The weekly chart of the S&P 500 isn't a perfect outside day reversal, but it's close. An "outside day" (or outside week, in this case) is a bar with an open and close that completely engulfs the prior week's high-to-low range with a move in the opposite direction. While sometimes seen for stocks, they're a rarity for indexes simply because indexes don't move too wildly. The spirit of an outside-day/week bar is still evident though, meaning we saw a sweeping change of heart for traders last week that decidedly reversed a big rally.
S&P 500 Weekly Chart, with VIX, Volume
Source: TradeStation
We saw a related but different reversal clue from the NASDAQ Composite last week. Here we say an inside day, or week, where the week's open and close were both contained within the previous week's open-to-close range, again moving in opposite directions. The interpretation is the same though. That is, it was a sweeping change of heart that should give the bulls pause.
NASDAQ Composite Weekly Chart, with VIX, Volume
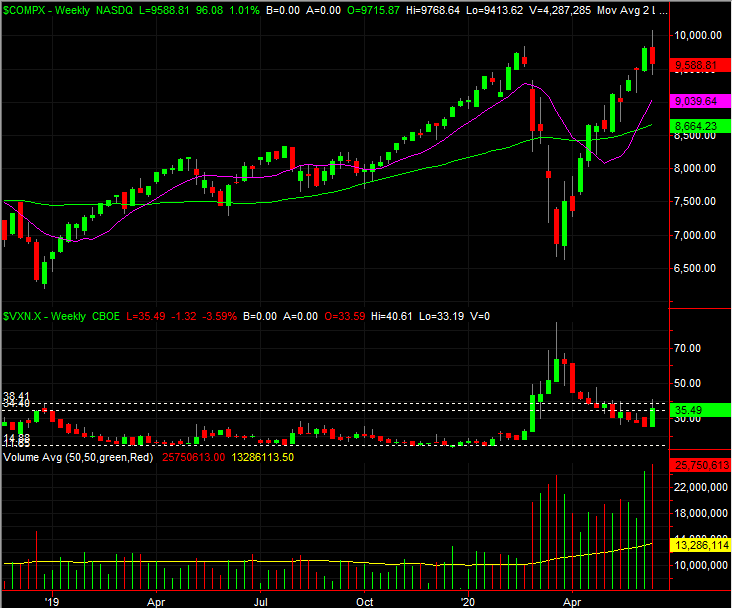
Source: TradeStation
Things could go either way from here. We have to respect the support the indices have already found as well as the support they'll likely find just a little below where they are now. It's too soon to start assuming we can count on that support though, just as it's too soon to assume the indices are going to break under last week's technical floors to test the next prospective support lines. The only thing we know as of right now is, last week forced the bulls to rethink their optimism. They may not have changed their minds again as much as Friday's modest bounce may imply.
Thursday's gap, of course, begs stocks higher again.