Weekly Market Outlook - Friday's Rebound Didn't Actually Get Stocks Off the Fence
Stocks may have ended the week on a bullish note, but the week itself wasn't bullish. For the first time in six weeks, the market logged a net loss for the past five trading days. The worry we voiced a week ago has (thus far, anyway) been merited. Investors would still be wise to plan for the worst even if they're still hoping for the best.
We'll look at how it's all shaping up in a moment; just know that there's still plenty of room for more weakness without threatening the bigger-picture uptrend. Before we get to that though, let's recap last week's big economic news and preview what's coming this week.
Economic Data Analysis
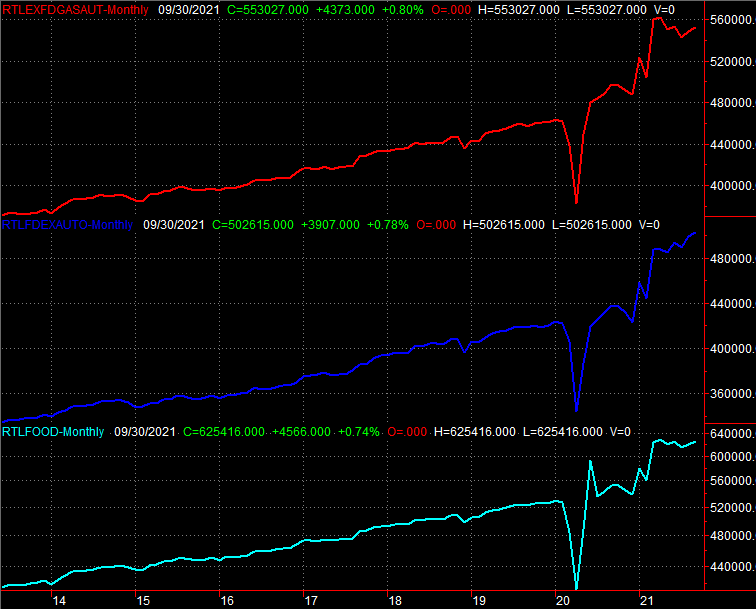
There was really only one set of data released last week that was of any interest, but it was a biggie - last month's inflation reports. We're neck-deep, eaten up with it. Some calculations of current inflation are at record highs, and all measures of price increases are at least at or near multi-year highs.
Inflation Rate (Annualized) Charts
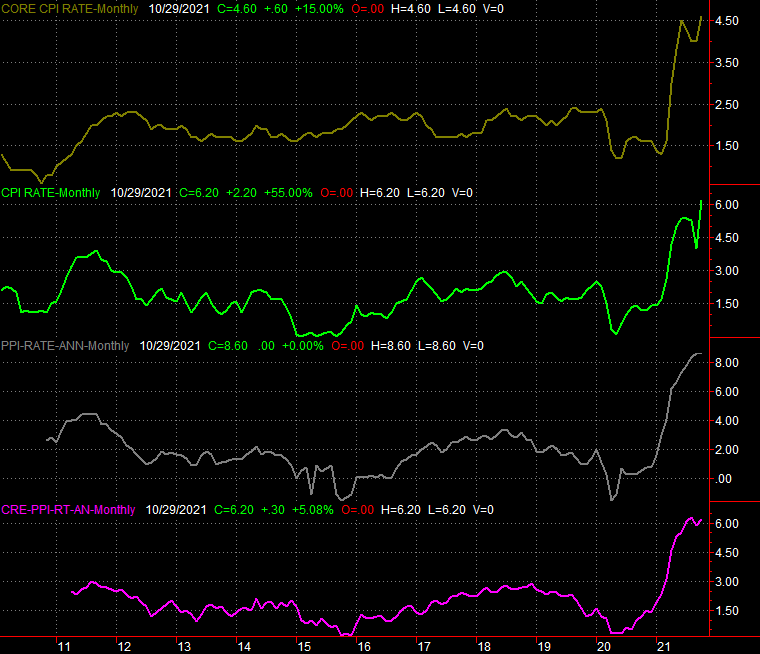
Source: Bureau of Labor Statistics, TradeStation
The Federal Reserve thus far has been wary of raising rates too soon to curb this inflation, although it is backing off on bond purchases that have a stimulative effect. The first anticipated rate hike is mentally scheduled to take shape sometime in the early part of next year. If inflation rates remain this firm though, the FOMC may need to make that move sooner.
Everything else is on the grid.
Economic Calendar
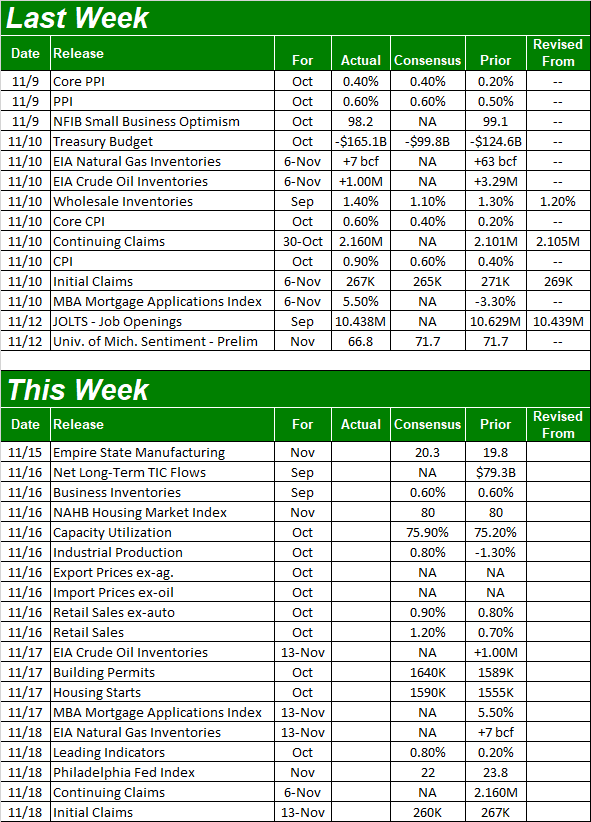
Source: Briefing.com
This week is going to be busier, with the party starting in earnest on Tuesday. That's when we'll hear about last month's capacity utilization and industrial productivity from the Fed, as well as October's retail sales data from the Census Bureau.
As for industrial production and the use of the nation's manufacturing capacity, things were humming until last month when both figures suffered a setback. Economists are calling for a recovery of the rebound effort this time around, although not an especially firm recovery move. The numbers aren't expected to be much better than last month's.
Capacity Utilization and Industrial Productivity Charts
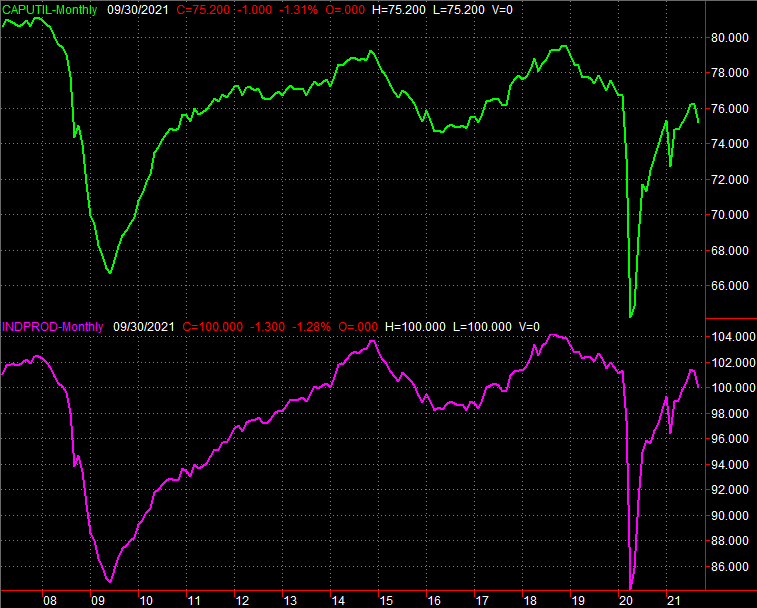
Source: Federal Reserve, TradeStation
Analysts are modeling strong month for consumer consumption, accelerating from September's brisk levels... and that's saying something given how brisk retail spending has been for the past few months.
Retail Sales Charts
Source: Census Bureau, TradeStation
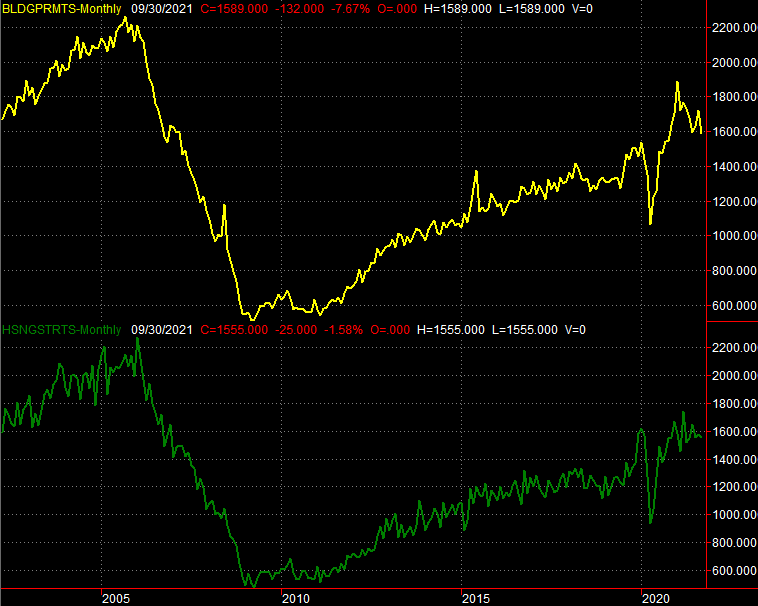
The only other item of interest coming this week is a look at last month's housing starts and the number of building permits issued. Forecasters are modeling slight growth from September's numbers, and after a few months of slow decline, we need it. This is modest proof that the real estate market is really running into a headwind. Almost needless to say, beating or missing starts and permits estimates has the potential to really move the market.
Housing Starts and Building Permits Charts
Source: Census Bureau, TradeStation
Stock Market Index Analysis
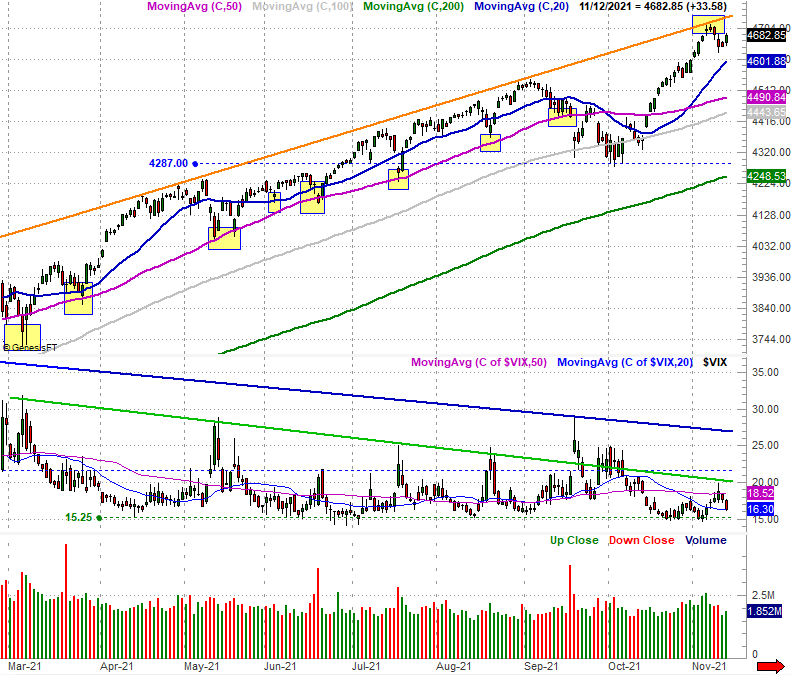
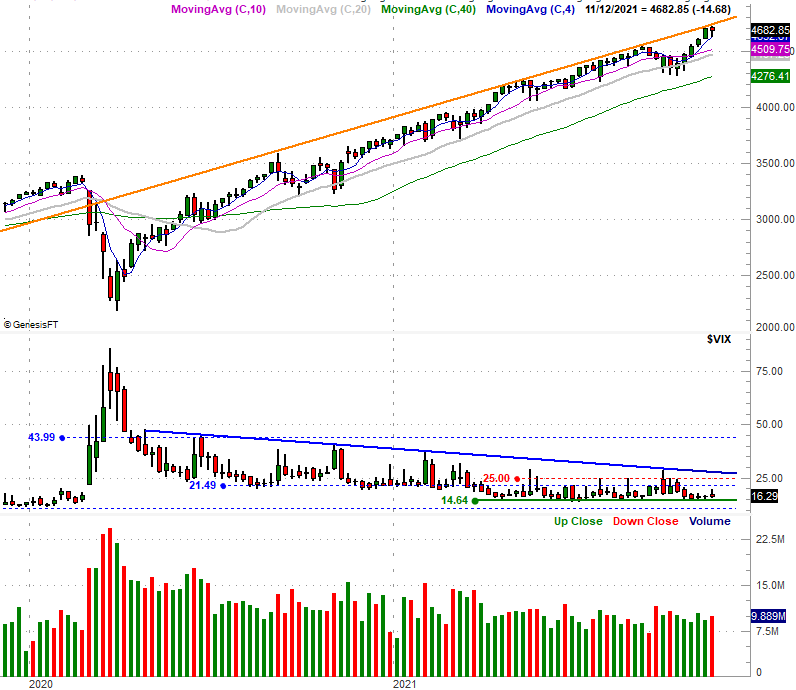
The weekly chart of the S&P 500 speaks volumes here, so we'll start with a look at it. The most noteworthy feature is the fact that - as we feared a week ago - the resistance line (orange) that connected all the key highs going back to September of last year continued to act as technical resistance last week. The bears may have drawn a major line in the sand.
S&P 500 Weekly Chart, with VIX and Volume
Source: TradeNavigator
Bumping into resistance isn't the same thing as the beginning of a pullback. As the more detailed daily chart of the S&P 500 plainly illustrates, the index remains above all sorts of technical support lines, the most important of which is the 50-day moving average line (purple). Several times since May it's stopped and reversed a dip, rekindling the rally onto higher high [see the highlighted reversals].
S&P 500 Daily Chart, with VIX and Volume
Source: TradeNavigator
As the daily chart also makes clear, although Thursday saw the stoppage of the pullback and we saw a bit of bullishness on Friday, both were low volume days... suggesting the conviction behind the effort wasn't all that great. It's just that the sellers were even more disinterested on those days (not that the sellers were all-in during Tuesday's and Wednesday's pullbacks).
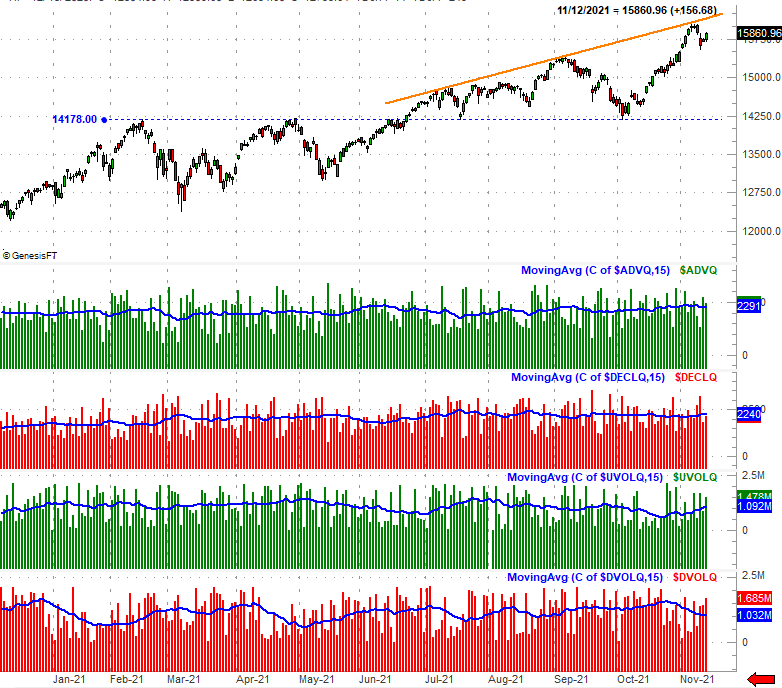
There's a better way to test this conviction, or lack thereof. As we've done several times in recent months, a comparison of the NYSE's bullish and bearish volume as well as its daily advancers and decliners can give us a better feel for what traders are truly thinking. Unfortunately, this time around, even this analysis isn't extremely convincing, although it is telling.
Take a look. While the NYSE's advancers (ADV) were above average on Thursday and Friday, that average -- the blue line -- was slumping even before Monday's peak. In a similar vein, the daily decliners are, on average, on the rise even though they were below average on Thursday and Friday. Perhaps more problematic for the broad market is that the NYSE's daily "up" volume (UVOL) and "down" volume (DVOL) are also trending lower and higher, respectively. They have been for a couple of weeks, even though the market itself was still rising during the first half of that two-week stretch.
S&P 500 Daily Chart w/ NYSE Advancers and Decliners, Up and Down Volume
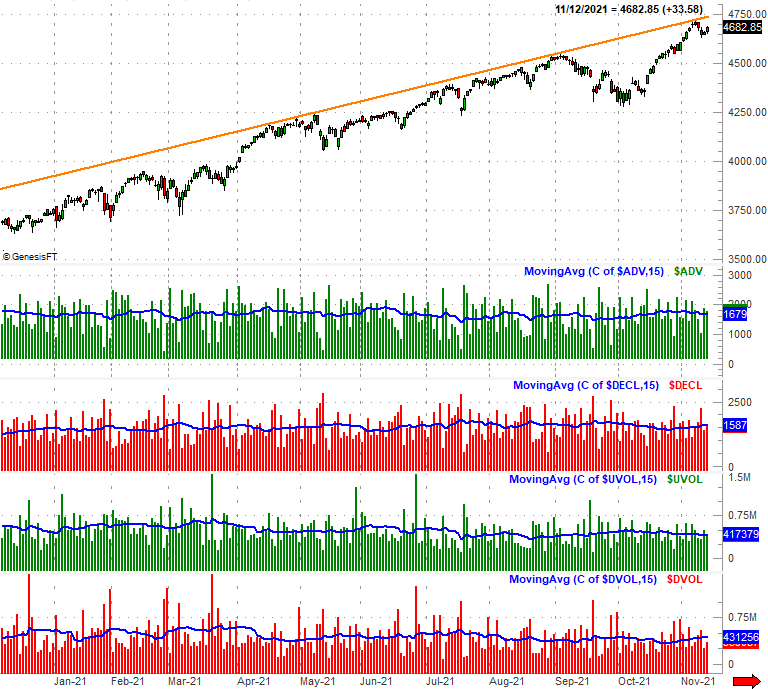
Source: TradeNavigator
Problem: The NASDAQ Composite's breadth and depth isn't leaning bearishly the way the NASDAQ's is.
NASDAQ Daily Chart w/ NASDAQ Advancers and Decliners, Up and Down Volume
Source: TradeNavigator
It's a problem for the obvious reason -- it sends a mixed message. Investors as a whole may be shying away from the market in general, but traders are still gravitating toward the riskier, more aggressive growth names typically listed at the NASDAQ. Still, the daily chart of the NASDAQ Composite looks mostly like that of the S&P 500's, unable to hurdle the technical ceiling that had stopped rallies back in July and late August.
NASDAQ Composite Daily Chart, with VXN

Source: TradeNavigator
Conclusions? That's just it... there aren't any to make. The bigger-picture rally is still technically intact even if it stumbled at a ceiling last week, and all of the indices remain above several technical support levels. We're also in a very bullish time of year. Still, it would be short-sighted to ignore the fact that this rally has gotten more than a little long in the tooth, and is ripe for a more serious correction than we've seen in quite some time.
This is (still) an environment where you just have to watch things on a day-to-day basis, as there is no real undertow or conviction. Just keep an eye on all the lines plotted on all the charts above. The VIX and VXN are still the keys to spotting the beginning of a more serious correction. We'll look at them in greater detail next week, if merited.