Weekly Market Outlook - Friday's Big Setback Was Apt to Happen No Matter What

The holiday-shortened week appeared to be moving along nicely, even if sleepily. Then, WHAM! Word a new variant of the COVID-19 virus up-ended everything. Friday's big losses led the market to one of the biggest weekly losses logged in months.
There are two diametrically-opposed views of the steel selloff. One is, the pullback was so big that a bounce is now in order. And to be fair, this has been the market's norm for some time now. Indeed, the sheer scope of Friday's plunge along with the big gaps left behind seems to set the stage for this outcome. The other view is, Friday's sizable stumble marks the beginning of an overdue selloff that ends up turning into a full-blown correction.
We'll weigh the odds of both prospective outcomes below, knowing that the calendar favors a rebound from here. First though, let's recap last week's biggest economic announcements and see what's on the dance card for this week.
Economic Data Analysis
Matters remained just so-so on the real estate front after chewing on last week's data. Sales of existing home sales came in a little better than expected, while sales of new houses fell short of expectations. Neither changed much from September's tallies though, which weren't especially thrilling compared to the surge in home-buying we saw late last year and into this year.
New, Existing Home Sales Charts
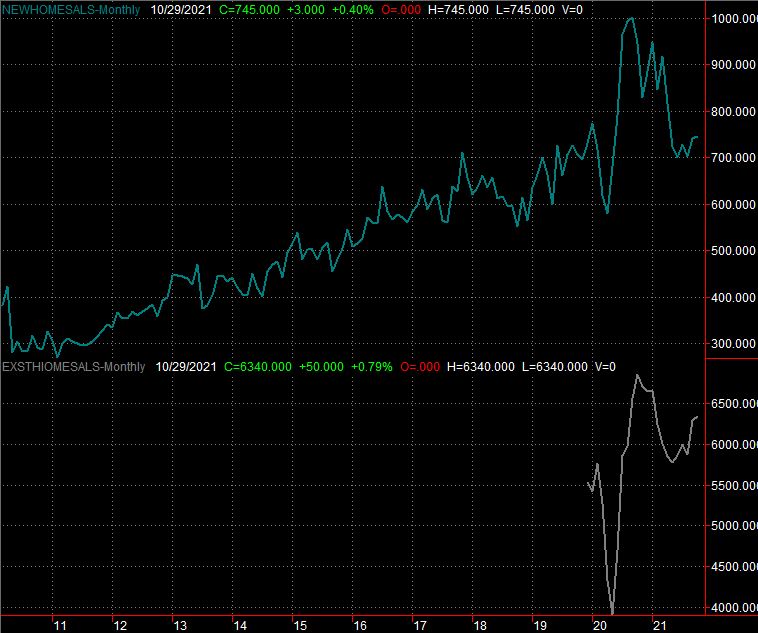
Source: Census Bureau, National Association of Realtors, TradeStation
The best that can be said about either is, at least sales aren't getting worse.
Given the waning interest in buying homes, it comes as no real surprise to learn that consumer sentiment slumped last month... at least as it's measured by the University of Michigan. The Conference Board's look at consumer confidence for November will be posted this week, though economists are calling for a modest lull there as well.
Consumer Sentiment Charts
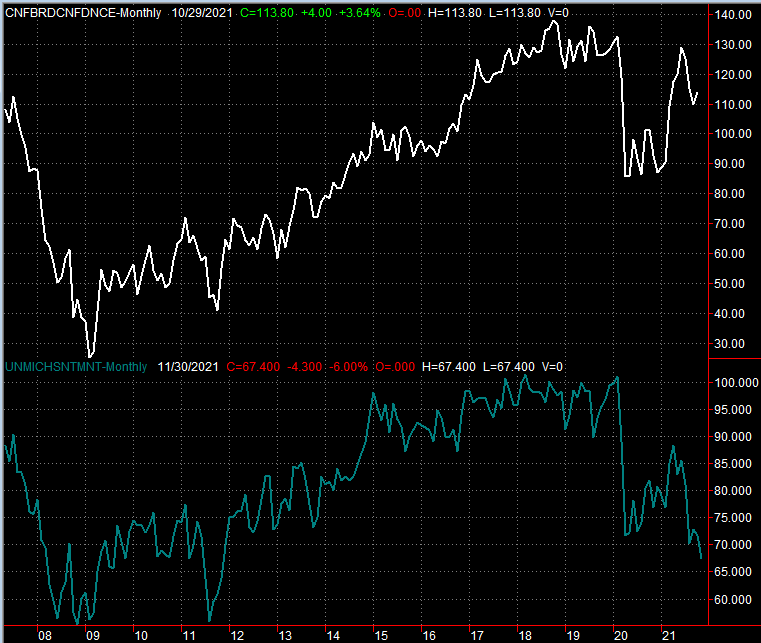
Source: Conference Board, University of Michigan, TradeStation
Though we're not charting it here, note that the 2nd calculation of Q3's GDP growth rate dialed it back just a bit, from 2.2% to 2.1%; neither is a thrilling figure. Yet, even with this tepid forward progress, the Federal Reserve is seemingly more concerned about the dragging effect of inflation than that stimulative effect of low interest rates. Per the minutes from the most recent FOMC meeting, the Fed is thinking about -- and willing to -- accelerate its plans to curb stimulation and start working towards curbing inflation sooner than had been expected.
Everything else is on the grid.
Economic Calendar
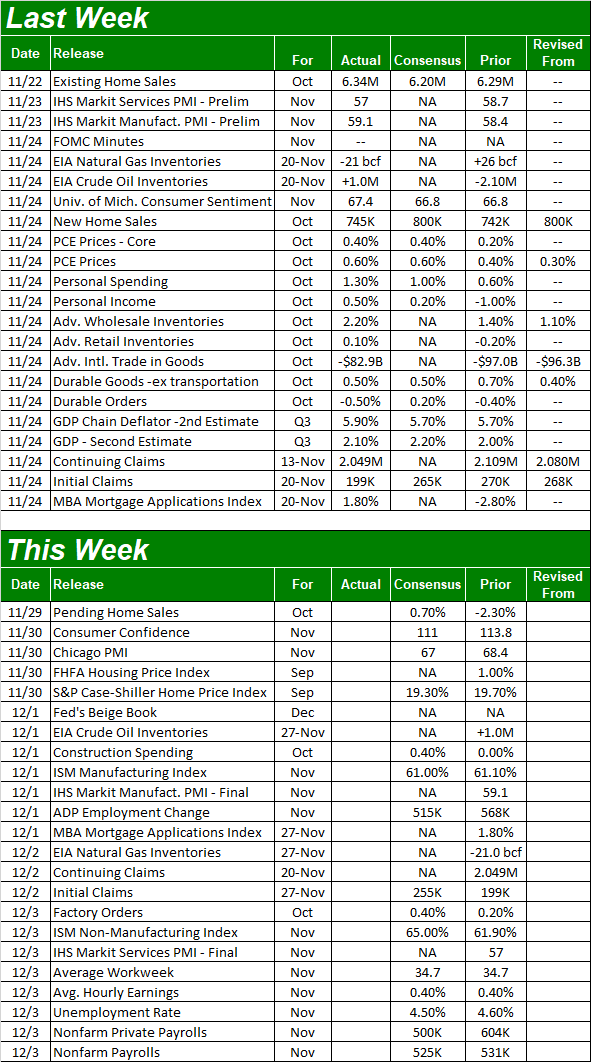
Source: Briefing.com
This week's grand finale is grand indeed... a look at November's jobs data. There are a couple of big reports to process before we have to think about this one though.
One of them is real estate pricing data, as measured by the FHFA as well as Standard & Poor's. Although total activity appears to be moderating, home prices themselves seem to remain on the rise. Both reports are only for September, so note the lag. It's possible any price slowdown could have taken shape in October or November.
Home Price Charts
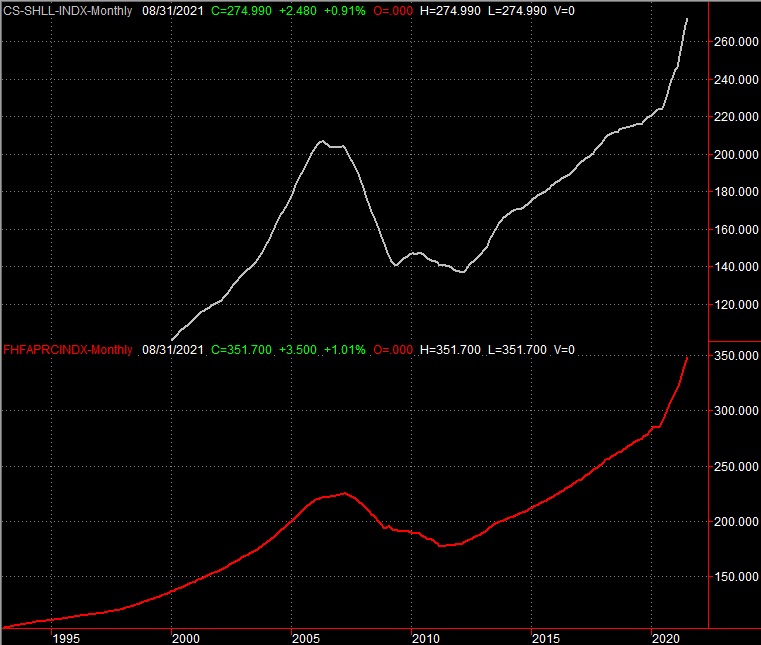
Source: Standard & Poor's, FHFA, TradeStation
We'll also get both ISM numbers this week. Forecasters are calling for a very slight ebb in manufacturing activity, but a sizable improvement in services. Either way, both figures are and will remain well above the critical 50 level that delineates strength and weakness.
ISM Manufacturing and Services Index Charts
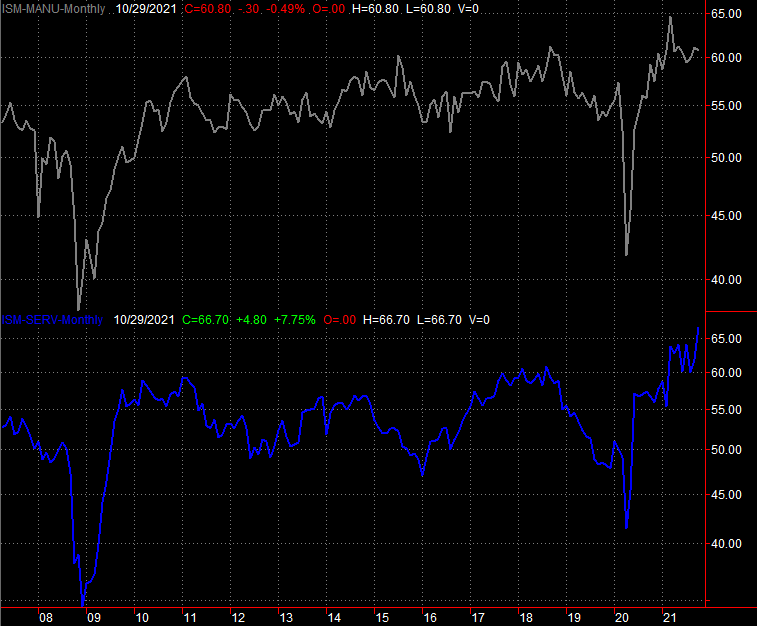
Source: Institute of Supply Management, TradeStation
As was noted though, this week's most-watched report will undoubtedly be Friday's employment numbers from the Department of Labor. Economists are collectively calling for 525,000 newly-created jobs, in line with October's levels. And, that should be enough to push the unemployment rate down from 4.6% to 4.5%.
Unemployment Rate and Payroll Growth Charts

Source: Department of Labor, TradeStation
Do bear in mind that a report that comes in well above or well below either forecast has the potential to move the market in a big way.
Stock Market Index Analysis
Ouch. That's the only way to describe what happened on Friday, which was the worst "Black Friday" (as in the day after Thanksgiving) since 1931... a period when up-ending the market came relatively easy. The S&P 500's 2.53% stumble translated into a more modest full-week loss of 2.2%, also that's still the worst weekly loss in a long, long time.
The thing is, the setback was likely to happen anyway. Traders just needed a reason to start taking profits. Headlines regarding the new strain of the coronavirus were up to the task.
Take a look at the daily chart of the S&P 500 for perspective. The index started out in trouble, and dug itself deeper into the hole for the entire shortened trading day. The pullback, however, ultimately took shape after the index bumped into a long-standing resistance line (orange) that connects all the key highs going back for months.
S&P 500 Daily Chart, with VIX and Volume
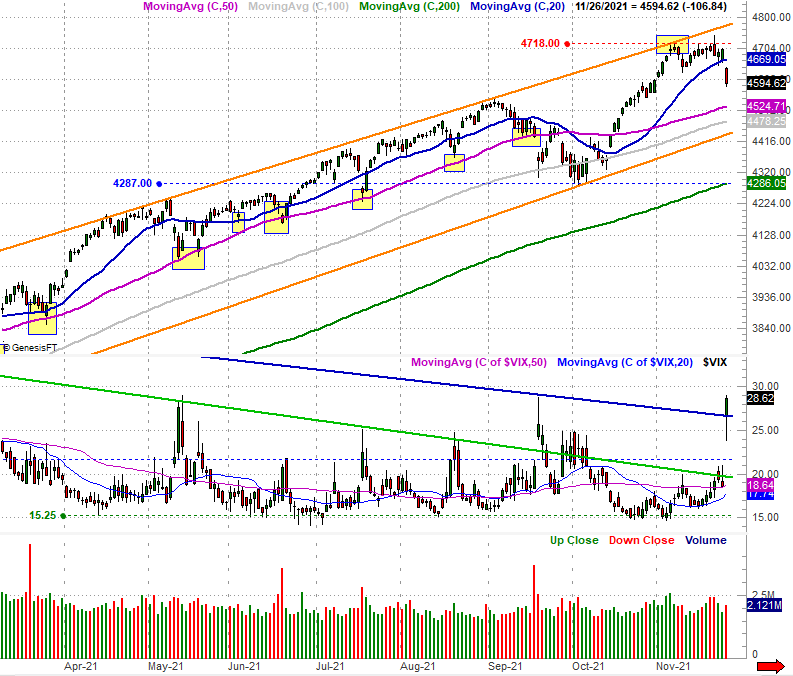
Source: TradeNavigator
It's hardly the ideal stumble the bears would like to see though. Namely, the sheer size of the gap left behind at Friday's open as well as the size the volatility index's (VIX) opening gap are now aching to be filled in by a bounce from the broad market.
Except, not every index left behind a bearish gap with Friday's selloff. Namely, the NASDAQ Composite simply and smoothly extended a pullback that had already begun to materialize a few days prior anyway... after bumping into a technical ceiling (orange) of its own.
NASDAQ Composite Daily Chart, with VXN
Source: TradeNavigator
The daily chart of the NASDAQ Composite shows us something else that's more than a little alarming. Like the VIX, the NASDAQ Volatility Index (VXN) punched through a major technical ceiling of its own. In fact, it pushed its way above a couple of resistance lines. This changes things more than it may seem on the surface. The weekly chart of the NASDAQ Composite and its volatility index puts this idea in a better perspective. [The weekly chart of the composite also makes clear that the index also has a major technical support level currently near 14,600 that could halt any pullback before it races out of control.]
NASDAQ Composite Weekly Chart, with VXN
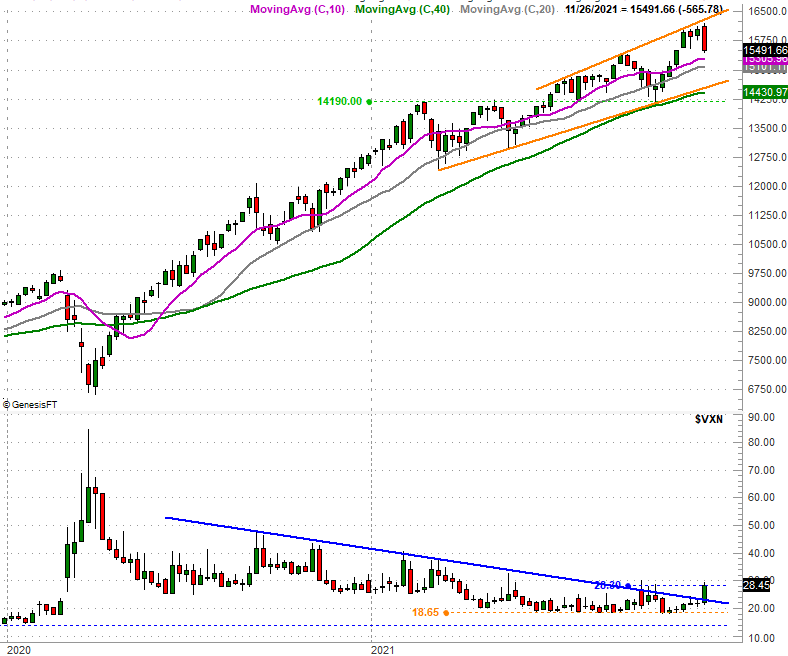
Source: TradeNavigator
This is no small matter. The volatility indices are the one thing that have explained why the 20-month rally has been able to last that long without ever really being tested. As long as the volatility indices were falling it loosely suggested traders bullishly believed in the stocks they were buying. For whatever reason though, all of a sudden on Friday, most traders started playing a lot of defense. If they're thinking it, it may only be a matter of time before they start to act on those fears in a much bigger way than they did last week.
So, we're starting this week out with a complicated scenario. We're in the midst of the most bullish two-month stretch for the market, and drubbings like last week's have generally been met with buying that pushes stocks to even higher highs. That outcome could certainly be in the cards this time around.
On the flipside, even if this isn't the beginning of a more serious correction, it's clear there's still room and reason for both of the aforementioned indices to slide back to support levels that have been defined by lows made since early this year (also plotted in orange on the charts above).
The one thing you don't want to do is jump to a conclusion based solely on the direction stocks start this week. A bunch of people are still getting their bearings, and a few-too-many people are apt to be plowing into stocks just because they'll buy on any dip.