Weekly Market Outlook - Fed to Force a Decision This Week
Stocks may not have ended the week on an especially bullish foot, but it doesn't matter. The market was bullish enough to log a gain last week, reaching record highs in the process. You have to follow the momentum, which is still bullish overall.
 On the other hand, this remains a tricky situation. Things continue to move higher and higher, but there's a certain level of hesitation behind the effort. There's also a certain lack of volume behind the effort. Perhaps that just due to the time of year. Or, maybe it's a sign that all these bulls just aren't all that convicted.
We'll explore both arguments after taking a closer look at last week's and this week's economic news.
Economic Data
Last week was quite modest in terms of economic reports. In fact, there was only one we were interested in -- June's housing starts and building permits. We needed a strong showing to offset weak numbers for the prior couple of months, and we got exactly that. Starts jumped to an annual pace of 1.215 million (from 1.122 million), and permits grew to 1.254 million (from 1.168 million).
Housing Starts and Building Permits Charts
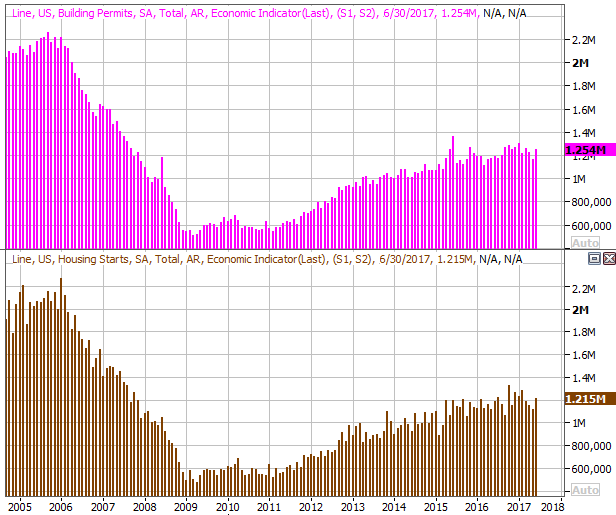
Source: Thomson Reuters Eikon
One good month doesn't make a trend, but all trends start out with one good month. A couple more like June's activity and construction stocks will be compelling again.
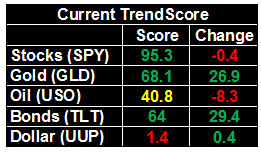
Everything else is on the grid.
Economic Calendar

Source: Briefing.com
This week is going to be much busier, rounding out the real estate picture in full form. That is, we'll get June's existing home sales on Monday, the FHFA and Case-Shiller indices on Tuesday, and last month's new home sales on Wednesday. Economists aren't looking for any change in terms of sales, but do look for more solid growth in terms of home prices.
Purchases have been leveling out, and could use a boost.
Home Sales (New & Existing) and Inventory Charts
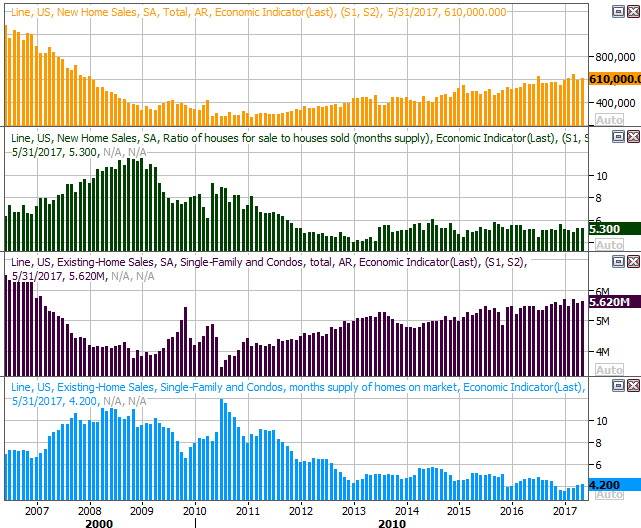
Source: Thomson Reuters Eikon
As for home prices, they're still making good progress, and are expected to keep making that progress.
FHFA and Case-Shiller Home Price Charts

Source: Thomson Reuters Eikon
Also this week we'll get our one and only consumer confidence reading from the Conference Board as well as the third and final look at the Michigan Sentiment Index. Each has been broadly trending higher for months now... bullish in the sense that investors make buy/sell decisions based on how they feel. July's readings are supposed to be a little lower that June's, though not alarmingly so.
Consumer Sentiment Charts
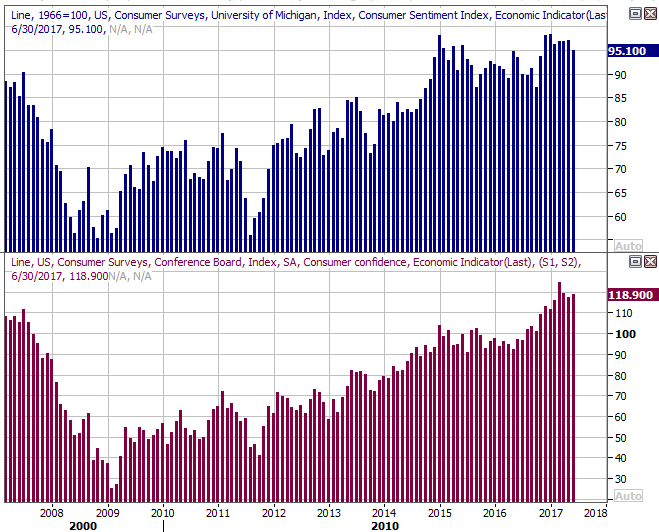
Source: Thomson Reuters Eikon
On Friday we'll get the first of three readings on Q2's GDP growth. The pros are calling for a pace of 2.8% (annualized), doubling the first quarter's growth pace. If we get such a strong reading it could affirm what a lot of investors have been hoping for ... and buying for.
GDP Growth Charts
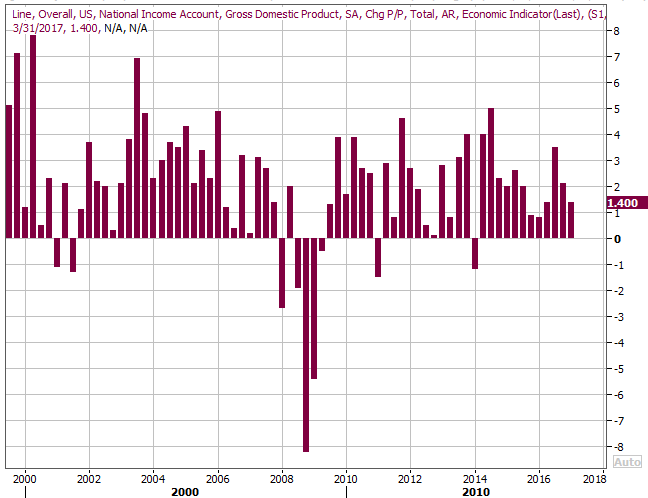
Source: Thomson Reuters Eikon
Of course, the one big item on this week's agenda that everyone will be watching is Wednesday's interest rate decision from the Fed. As of the latest look there's a 97.5% chance the Federal Reserve will aim for a Fed Funds rate of between 1.0% and 1.25%... where it is now. The market is suggesting the next change won't happen until March of next year (and even that's a "just barely" scenario). Do know the odds of rate-hike start to slightly improve for December though.
Almost needless to say, a surprise from the FOMC on Wednesday -- even if it's just surprising rhetoric in the Fed's commentary -- has the potential to really shake things up.
Index Analysis
The market ended up following through on the breakout thrust from two Fridays ago, reaching record highs on Thursday before cooling off a bit on the last day of last week. The momentum is strong, but as has been the case for too long now, there's something uneasy about the bullishness. Indeed, there's something increasingly uneasy about this strength, in that the VIX has fallen back to multi-year lows.
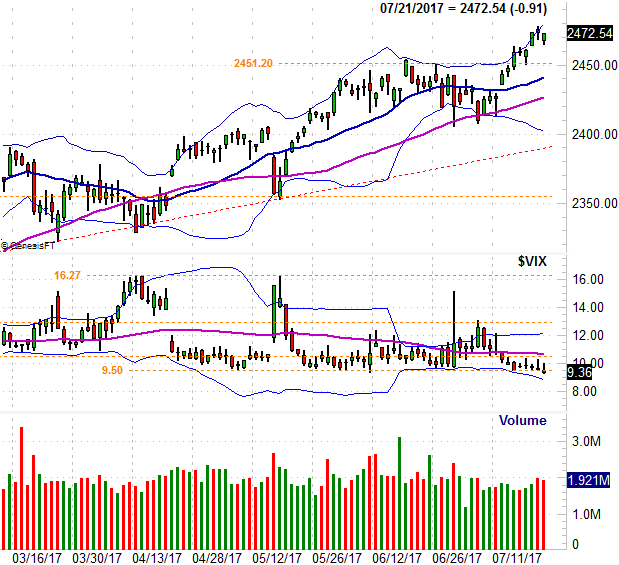
Take a look at the daily chart of the S&P 500 -- with the VIX -- to see this. The VIX's close of 9.36 on Friday pulls it below a key floor at 9.50, suggesting complacency is at even more dangerous lows.
S&P 500 Daily Chart
Source: TradeNavigator
This has been a point of contention for many. The argument is that a low VIX doesn't necessarily indicate a lack of complacency or too much confidence, but rather, an actual expectation of limited volatility in the foreseeable future. [It is, after all, a volatility index.] The argument isn't unmerited either. It's an argument, however, that conveniently jibes with what many traders want to believe, and overlooks a lot of history.
The weekly view of the S&P 500 puts the matter in a little more perspective. That is, we can see just how long in the tooth the rally is, AND that the VIX is pressing into the lower edge of a falling converging wedge pattern (framed in red). Something's going to have to give soon. Note there's not much room left within the VIX's wedge to maneuver.
S&P 500 Weekly Chart
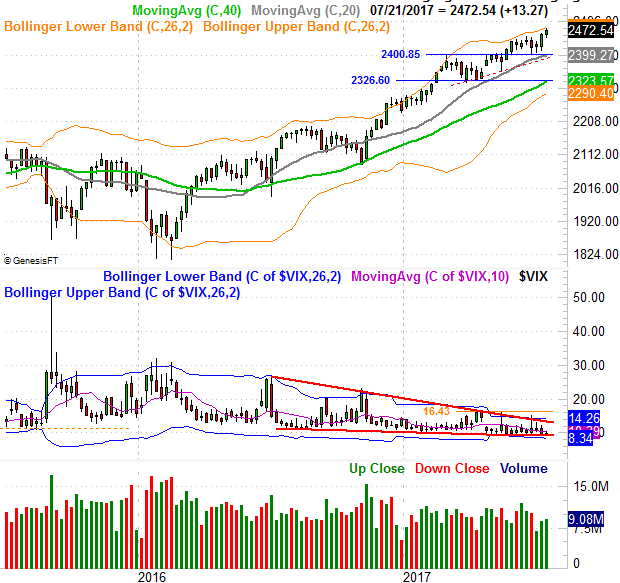
Source: TradeNavigator
Still, it's entirely possible any pullback could be muted, ending quickly and rekindling what's become a surprisingly reliable uptrend. For the S&P 500, there's a huge line at 2401 where several key indicators and a former peak have converged. As long as that level doesn't break down as a floor, the uptrend is still intact. And, the bulls won't have to sweat in earnest until the 200-day moving average line -- green, at 2323 and rising -- is broken. That's only going to matter unless, however, the VIX has also broken above 14.2 at the same time. And really, the VIX needs to clear its prior peak at 16.4 to really seal that deal.
Either way, look for the FOMC's ruling on Wednesday to force traders into making some sort of decision.